
Music App Market Size and Share
Market Overview
| Study Period | 2020 - 2031 |
|---|---|
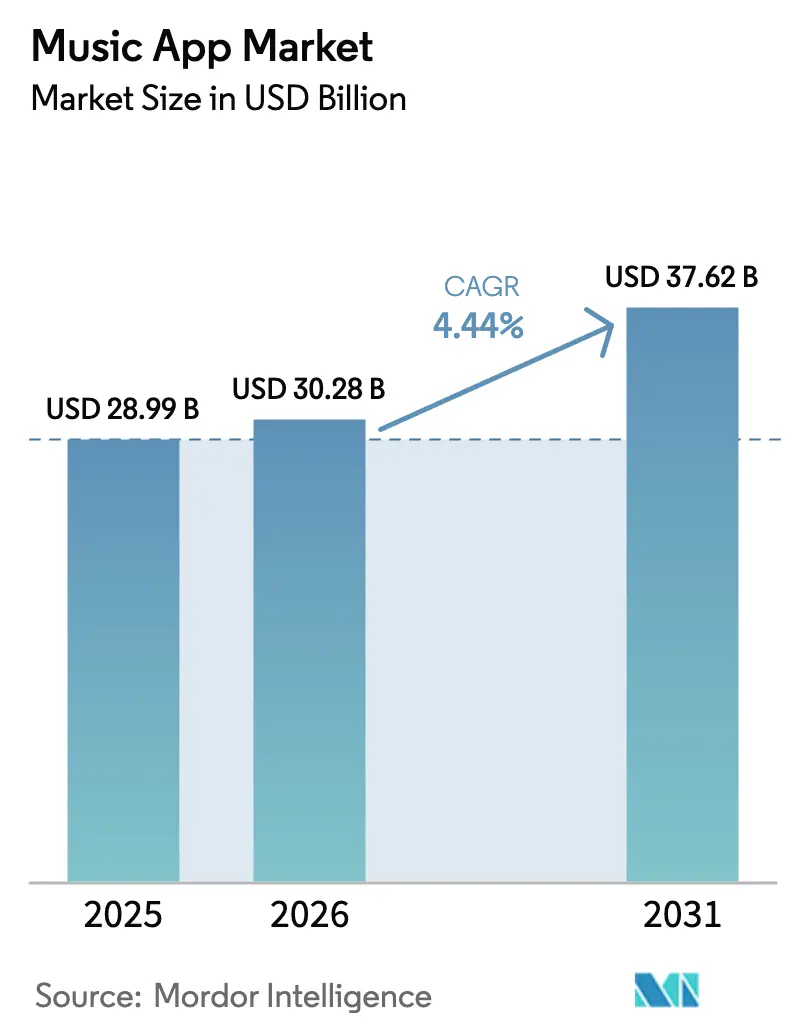
| Market Size (2026) | USD 30.28 Billion |
| Market Size (2031) | USD 37.62 Billion |
| Growth Rate (2026 - 2031) | 4.44 % |
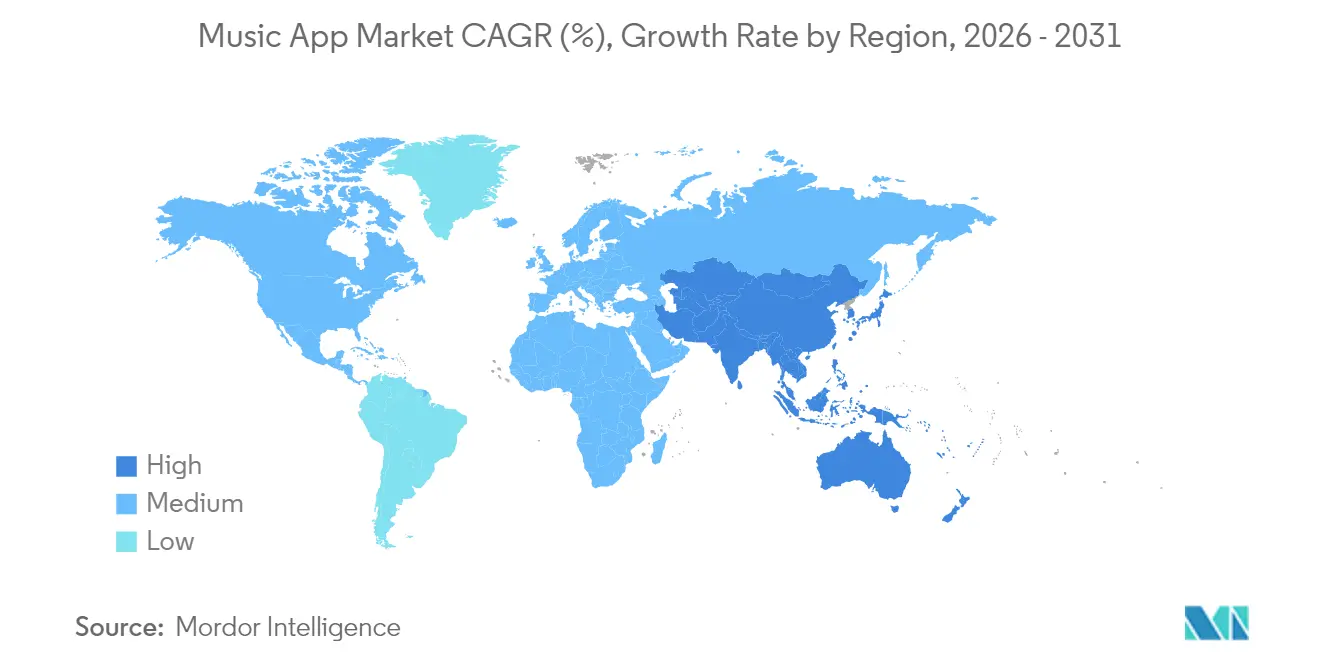
| Fastest Growing Market | Asia-Pacific |
| Largest Market | North America |
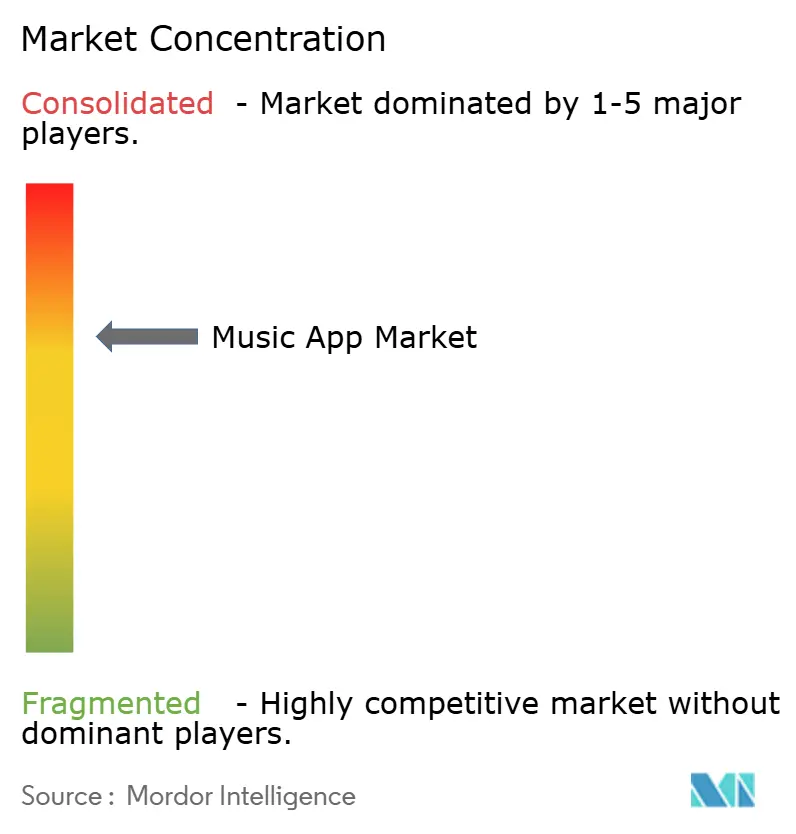
| Market Concentration | Medium |
Major Players *Disclaimer: Major Players sorted in no particular order Image © Mordor Intelligence. Reuse requires attribution under CC BY 4.0. | |
Music App Market Analysis by Mordor Intelligence
The music app market size in 2026 is estimated at USD 30.28 billion, growing from 2025 value of USD 28.99 billion with 2031 projections showing USD 37.62 billion, growing at 4.44% CAGR over 2026-2031. This expansion reflects a maturing yet opportunity-rich landscape in which subscription models still dominate but are increasingly reinforced by hybrid freemium tiers, bundled offerings, and connected-device channels that lengthen engagement cycles. Growing smartphone penetration, affordable mobile data, and AI-powered recommendation engines continue to widen the addressable base, while rising carrier-billing adoption in emerging regions removes historical payment frictions. In parallel, partnerships with automotive OEMs and smart-home brands are extending listening beyond phones, creating incremental touchpoints that strengthen platform stickiness. Competitive pressure remains intense as licensing costs climb and margin protection requires simultaneous investment in catalog depth, geotargeted content, and personalized user experiences, prompting platforms to diversify revenue and rationalize pricing strategies.
Key Report Takeaways
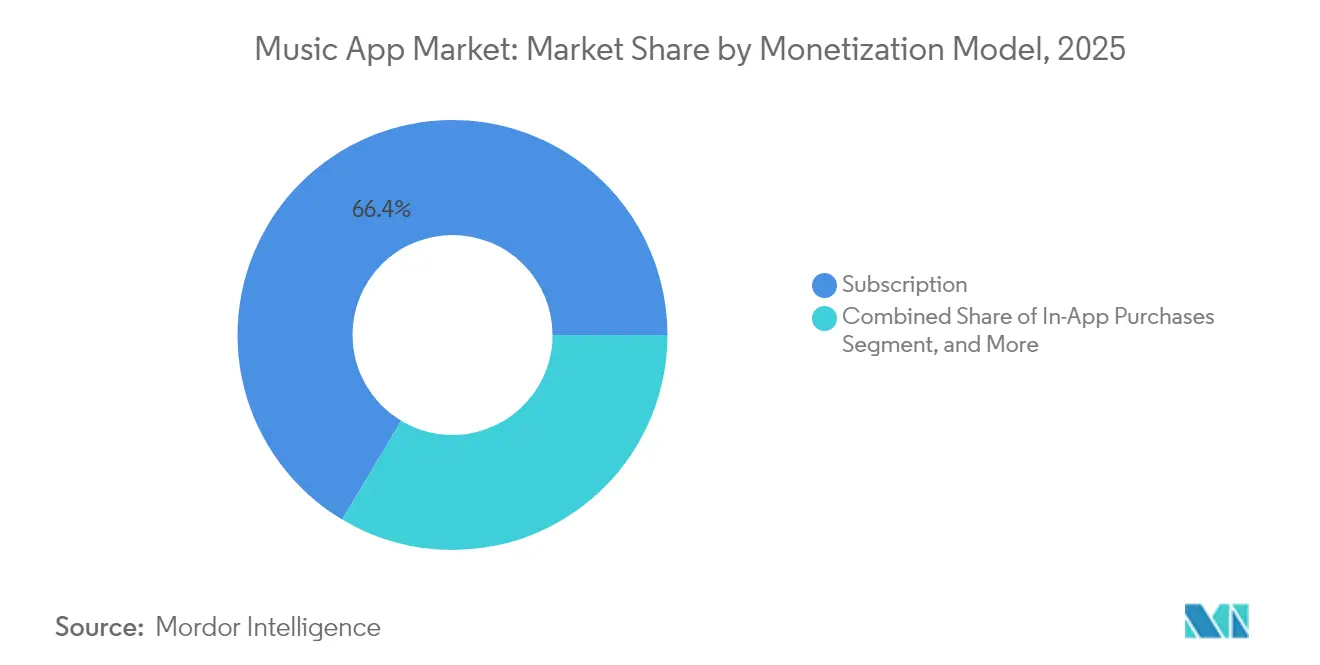
- By monetization model, subscription streaming held 66.42% of the music app market share in 2025, while hybrid freemium is forecast to accelerate at a 13.58% CAGR through 2031.
- By platform, Android accounted for 71.05% of the music app market size in 2025; smart speakers and connected devices are projected to grow at an 17.25% CAGR between 2026 and 2031.
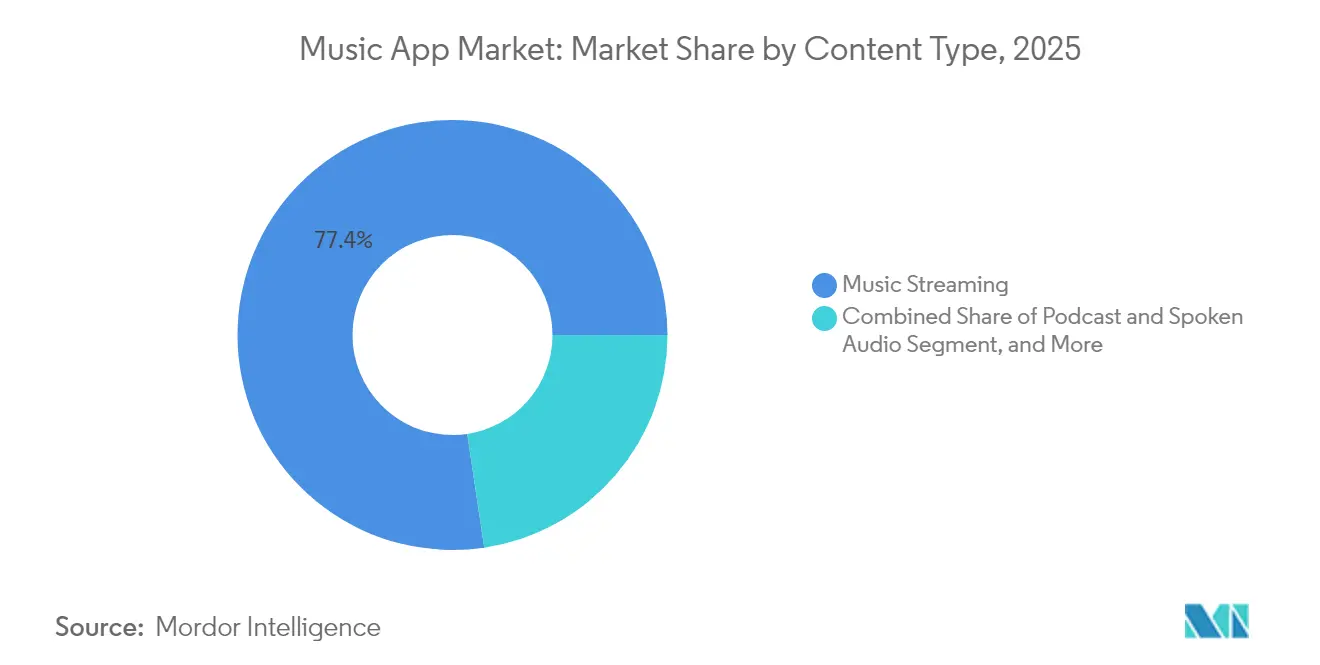
- By content type, podcast and spoken audio segments are advancing at a 20.85% CAGR through 2031, whereas music streaming retained 77.36% share of the music app market size in 2025.
- By age group, users aged 13-24 years captured 36.12% of the music app market share in 2025 and are expanding at a 10.53% CAGR to 2031.
- By geography, North America held a 46.58% share of the market in 2025, while Asia-Pacific is projected to grow with a 24.70% share.
Note: Market size and forecast figures in this report are generated using Mordor Intelligence’s proprietary estimation framework, updated with the latest available data and insights as of 2026.
Market Trends and Insights
Drivers Impact Analysis of Music App Market*
| Driver | (~) % Impact on CAGR Forecast | Geographic Relevance | Impact Timeline |
|---|---|---|---|
| Rising adoption of paid music-streaming subscriptions | +1.8 | Global, strongest in Asia-Pacific and Latin America | Medium term (2–4 years) |
| Growing smartphone penetration and mobile-data affordability | +1.2 | India, Southeast Asia, Sub-Saharan Africa | Short term (≤ 2 years) |
| Integration with smart speakers and connected cars | +0.9 | North America and Europe first, Asia-Pacific next | Long term (≥ 4 years) |
| Expansion of global licensing agreements and catalog depth | +0.7 | Global | Medium term (2–4 years) |
| AI-driven hyper-personalization boosting retention | +0.5 | Mature markets then emerging | Short term (≤ 2 years) |
| Carrier-billing uptake in emerging regions | +0.4 | Asia-Pacific, Latin America, Middle East and Africa | Medium term (2–4 years) |
| Source: Mordor Intelligence | |||
Rising Adoption of Paid Music-Streaming Subscriptions
Subscription conversion momentum continues to climb as platforms refine value propositions through exclusive content bundles and dynamic pricing. Universal Music Group reported EUR 1.61 billion (USD 1.77 billion) in subscription and streaming revenue for Q1 2025, up 7.2% year over year, reflecting robust paid-user growth. Tencent Music Entertainment added 13.4% more paying users in China, reaching 121 million and lifting monthly ARPPU to RMB 11.1 (USD 1.6), underscoring price elasticity even in cost-sensitive markets. Platforms also leverage diversified content—podcasts, audiobooks, and artist exclusives to reinforce perceived value and justify incremental price steps.
Growing Smartphone Penetration and Mobile-Data Affordability
Low-cost Android devices and competitive data plans have unlocked vast rural and youth cohorts. In India, streaming constituted 88% of recorded-music revenue in 2024, with listeners averaging 26.7 hours per week 30% above the global mean. Carrier-billing rails such as Airtel Mobile Money now plug more than 31.5 million Kenyans directly into app stores, removing credit-card dependence and expanding the music app market.
Integration with Smart Speakers and Connected Cars
Voice-enabled speakers and native in-car apps are redefining distribution. Mercedes-Benz’s FYI RAiDiO, built with Google Cloud and Azure OpenAI, personalizes audio for eligible 2024+ models, demonstrating OEM appetite for embedded services. TuneIn’s alliance with Visteon embeds 100,000 radio stations and millions of podcasts in dashboards aimed first at India and Asia-Pacific buyers. These integrations lengthen daily listening windows, boosting retention metrics and ARPU.
Expansion of Global Licensing Agreements and Catalog Depth
Cross-border licensing expands discovery and raises switching costs. Universal Music Group’s multiyear pact with Amazon Music covers exclusive releases and “Streaming 2.0” features, signaling the strategic weight of differentiated catalogs. IFPI data show that one-third of artists earning over USD 1,000 receive more than 75% of their income from outside their home market, highlighting the commercial upside of global availability.[3]
Restraints Impact Analysis of Music App Market*
| Restraint | (~) % Impact on CAGR Forecast | Geographic Relevance | Impact Timeline |
|---|---|---|---|
| Escalating content-licensing costs compressing margins | -1.1 | Global, greatest in mature markets | Short term (≤ 2 years) |
| High churn amid intense platform competition | -0.8 | Mature markets then emerging | Medium term (2–4 years) |
| Regulatory scrutiny on royalties and antitrust issues | -0.4 | North America and Europe | Long term (≥ 4 years) |
| Sustainability concerns over streaming energy use | -0.2 | Europe and North America first | Long term (≥ 4 years) |
| Source: Mordor Intelligence | |||
Escalating Content-Licensing Costs Compressing Margins
Mechanical royalty rates effective January 2025 rose to 12.7 cents per song plus 2.45 cents per minute, lifting cost bases for every major platform. [2]Spotify’s rule that tracks must hit 1,000 streams within 12 months before earning royalties reflects attempts to triage payouts and protect gross margin. High fees hit hardest in low-ARPU emerging markets, challenging scalability and potentially driving price tier differentiation.
High Churn Amid Intense Platform Competition
Average subscription life cycles hover around seven months as promotions reset user expectations and feature parity narrows. Rapid imitation, illustrated by NetEase Cloud Music and QQ Music’s public clash over player customization, erodes novelty advantages and fuels user switching. Bundling strategies that cut per-seat revenue yet raise retention complexity further pressure profitability benchmarks.
*Our forecasts treat driver/restraint impacts as directional, not additive. The impact forecasts reflect baseline growth, mix effects, and variable interactions.
Music App Market Segment Analysis
By Monetization Model:
Subscription Dominance Drives Premium ShiftSubscription services commandeered 66.42% music app market share in 2025, translating into predictable recurring revenue that underpins most platform valuations. Hybrid freemium tiers, however, are projected to grow 13.58% annually as platforms accommodate variable purchasing power. Spotify’s USD 11.99 Premium and lower-priced Basic options illustrate layered monetization that widens the funnel while preserving yield. Tencent Music Entertainment diversified revenue to RMB 21.74 billion (USD 3.04 billion) in 2024, combining subscriptions, virtual albums, and live events. Carrier billing proliferation is expected to add tens of millions of first-time payers, broadening the music app market size for lower-priced introductory plans. Advertising-supported models remain essential in markets where average disposable income constrains subscription uptake, but rising ad loads risk dampening user satisfaction and could speed the pivot to micro-payment or creator-tip mechanisms.
The music app market is evolving toward blended income streams that fuse subscriptions, micro-transactions, and contextual advertising. As catalog costs climb, platforms favor higher-margin verticals such as podcast ads and live-event ticketing. Analysts expect subscription ARPU to stabilize as bundles replace single-format offerings, reducing churn and smoothing revenue for rights-holders. Competitive advantage will rest on data-driven segmentation that aligns tier pricing with regional income bands and content preferences, ensuring the music app market size expands without sacrificing profitability.

By Platform:
Android Leadership Faces Smart Device DisruptionAndroid commanded 71.05% of global installations in 2025, anchored by its ubiquity in emerging economies. Despite this dominance, smart speakers and connected devices are surging at an 17.25% CAGR, signaling the next frontier for the music app market. Voice-first usage simplifies discovery, while in-car integration captures captive commuting time. iOS, although smaller in user count, delivers higher per-capita revenue, reinforced by Apple’s ecosystem stickiness. Desktop platforms play a complementary role for playlist management and creator tools, especially in professional and prosumer circles.
Connected cars are becoming significant demand drivers; KUKE Music now reaches 100 million Chinese in-vehicle users through partnerships covering 90% of local OEMs. BMW streams classical performances direct to dashboards, illustrating niche-content differentiation strategies. These developments suggest that future music app market share gains will hinge on seamless cross-device continuity rather than mobile-only dominance. Platforms investing early in automotive SDKs and smart-home APIs are poised to secure outsized influence as screenless listening accelerates.
By Content Type:
Music Streaming Dominance Amid Podcast AccelerationMusic streaming still accounts for 77.36% of the music app market size in 2025, functioning as the gateway product for most users. Podcast and spoken-audio content, however, is expanding at a 20.85% CAGR as exclusive shows and serialized storytelling increase session length. Podcast advertising surpassed USD 2.4 billion in 2024, offering CPMs well above music equivalents and giving platforms a margin lever. Live audio, though nascent, enables artist-fan monetization pathways that bypass traditional label splits. High-resolution formats serve audiophile niches but act as premium-tier differentiators that justify price premiums and lock in high-value customers.
The diversification into spoken-word strengthens platform economics by optimizing ad inventory and boosting dwell time, sharpening retention cohorts. Exclusive shows from major studios and cross-sport collaborations exemplify content strategies aimed at capturing non-music listening moments, reinforcing the music app market growth narrative. Future expansion will likely mix short-form interactive audio and AI-generated soundscapes tailored to wellness, education, and productivity contexts.
By Age Group:
Youth Demographics Drive Innovation CyclesUsers aged 13-24 years controlled 36.12% music app market share in 2025 and are growing at 10.53% annually, making them the primary engine of product innovation. Their appetite for social listening, short-form discovery, and creator interaction shapes platform roadmaps. The 25-34 cohort, though smaller, delivers the highest subscription conversion and premium-tier uptake. Older segments require frictionless interfaces and curated discovery rather than social-first engagement, prompting UI bifurcation strategies.
Integrations like TikTok-to-Spotify playlist saving exemplify how platforms harness youth-centric viral loops to acquire and retain users. Collaborative playlists, gaming tie-ins, and AR filters are becoming table stakes in courting Gen Z listeners. Balancing this youth focus with universal usability is pivotal as the music app market matures; family plans and cross-generational curation tools will help platforms extend lifetime value across age brackets.
Geography Analysis
North America Music App Market
North America retained 46.58% music app market share in 2025, driven by high-value subscribers willing to pay USD-level premiums for lossless audio and bundled services. Apple’s Services segment generated USD 26.3 billion in Q1 FY25, highlighting the region’s monetization depth. However, saturation is slowing net additions, shifting strategic emphasis to ARPU optimization via multi-format bundles and connected-device upsells. Regulatory headwinds around royalty transparency and antitrust scrutiny are intensifying, influencing content-licensing negotiations and platform fee structures.
APAC Music App Market
Asia-Pacific delivered the fastest growth at 24.70% CAGR through 2031, propelled by India’s mobile-first adoption and China’s scale. Tencent Music Entertainment reported RMB 28.40 billion (USD 3.98 billion) in 2024 revenue, with premium service upselling offsetting a user-base contraction. India’s users average 26.7 hours of weekly listening, yet subscription penetration remains low, presenting a sizable conversion opportunity. Carrier billing and localized pricing models are essential for unlocking this latent demand.
EMEA and LATAM Music App Market
Europe posted steady 8.05% growth in 2025 as supportive digital-single-market regulations and affluent audiences sustain healthy paid uptake. Latin America advanced 21.9%, with Mexico entering the global top-10 recorded-music markets, demonstrating Spanish-language catalog power. Middle East and North Africa grew 22.1%, with Anghami emphasizing Arabic content and culturally aligned UX. Sub-Saharan Africa’s 24.0% growth potential hinges on continued investment in network infrastructure and micro-payment solutions that align with lower income levels.
Regulatory Landscape
The regulatory landscape for music apps is shaped by copyright and royalty-setting regimes, scrutiny of platform conduct, and country-level cultural policy interventions. In the United States, statutory publishing payments are influenced by the Copyright Royalty Board and administering entities such as The Mechanical Licensing Collective (MLC), while 2026 rate-setting updates for certain digital subscription configurations introduced CPI-U-linked adjustments, with published 2026 rates cited at USD 0.0241 (standalone) and USD 0.0401 (bundled contracts). Enforcement and consumer-protection scrutiny can also extend to discovery and promotion mechanics. In April 2026, Texas Attorney General Ken Paxton opened an investigation into Spotify, Apple Music, Pandora, Amazon Music, and YouTube Music around potential undisclosed payola arrangements, adding pressure on compliance practices related to sponsored promotion, disclosure, and ranking integrity.
In Canada, implementation of the Online Streaming Act has increased the policy burden on large online audio and video platforms. Industry reporting indicates that the CRTC tripled the streaming levy to 15% of Canadian revenues effective May 2026. These changes increase licensing and compliance costs and can affect how platforms structure pricing, reporting, and content investment, especially for localized catalogs and Canadian-market revenue attribution.
Value Chain Analysis
The music app value chain begins with creators (songwriters, performers) and rights owners (publishers and record labels), then moves through rights administration and licensing intermediaries such as collective management organizations (CMOs) and statutory administrators. Aggregators and distributors connect these rights portfolios to digital service providers (DSPs) that run music apps. On the publishing side, mechanical and performance royalties are governed by jurisdictional rules, and in the United States the Copyright Royalty Board sets statutory formulas while entities like The Mechanical Licensing Collective (MLC) administer blanket mechanical licensing for eligible uses. Industry bodies such as IFPI and the Digital Media Association (DiMA) also influence standards and advocacy, including policy positions on streaming integrity and fraud.
DSPs (including Spotify, Apple Music, Amazon Music, and YouTube Music) package licensed catalogs into consumer offerings across mobile, web/desktop, and connected-device endpoints, then monetize through subscriptions, advertising, and hybrid tiers. Downstream of the app storefront, payment processing and distribution rails, including carrier billing in emerging markets, can materially affect conversion from free to paid. Data and personalization capabilities, along with content operations such as curation and recommendation systems, are central in the service layer because they shape engagement, streaming volumes, and ultimately royalty outflows to rights holders and administrators.
Competitive Landscape
The competitive arena exhibits moderate concentration. Spotify retained roughly 32% global share after adding 28 million subscribers in 2024. Apple Music, Amazon Music, and Tencent Music follow, collectively bringing the top four to approximately 70% of the paid universe. Competitive differentiation increasingly revolves around ecosystem breadth, AI-powered personalization, and exclusive content rather than core catalog, which is largely commoditized. Rapid feature replication shortens innovation cycles, as visible in Chinese platforms’ swift copying of social and UI enhancements.
White-space competition is heating up in the automotive and smart-home verticals. Mercedes-Benz’s FYI RAiDiO illustrates OEM efforts to internalize entertainment layers, potentially disintermediating smartphone-centric apps. Creator economy dynamics also add complexity: Spotify’s Partner Program allows video podcasters to earn ad revenue, while Tencent Music offers virtual concert tickets. These initiatives alter revenue splits and require delicate balancing between labels, creators, and platform margins.
Sustainability considerations, such as data-center energy intensity, are emerging as brand-equity factors, especially in Europe where consumers show growing eco-sensitivity. Platforms investing in green cloud architectures may gain reputational advantage as regulators examine streaming’s carbon footp
Music App Industry Leaders
-
Spotify AB
-
Apple Inc.
-
Amazon.com, Inc.
-
Alphabet Inc. (YouTube Music)
-
Tencent Music Entertainment Group
- *Disclaimer: Major Players sorted in no particular order
Music App Market Companies Covered in this Report
- Spotify AB
- Apple Inc.
- Amazon.com, Inc.
- Alphabet Inc. (YouTube Music)
- Tencent Music Entertainment Group
- NetEase, Inc.
- Deezer SA
- SoundCloud Global Limited and Co. KG
- Pandora Media, LLC
- Tidal Music AS
- Wynk Limited
- ByteDance Ltd. (Resso)
- Saavn Media Private Limited (JioSaavn)
- Anghami PLC
- Idagio GmbH
- Napster Group PLC
- KKBOX Inc.
- Yandex LLC (Yandex Music)
- iHeartMedia, Inc. (iHeartRadio)
- Sirius XM Holdings Inc.
- TuneIn, Inc.
- Boomplay Digital Service Limited
- Qobuz Xandrie SA
Market Opportunities and Future Outlook
One opportunity area is the overlap between paid streaming scale and product differentiation, since streaming remains the primary growth engine for recorded music and continues to deepen consumer spending. IFPI reported global recorded music revenues of USD 31.7 billion in 2025, with streaming at 69.6% of total income and paid subscription streaming at 52.4% of the total. The paid subscriber base reached 837 million users in 2025, and for music apps this scale supports continued experimentation with tiering and bundling, including hybrid freemium, while treating catalog breadth as a baseline.
Discovery and engagement are also moving beyond manual playlist curation toward conversational and agentic AI experiences. Feature momentum around Spotify DJ and voice-assistant use cases such as Alexa+ points to whitespace in hands-free, context-aware discovery across smart speakers and connected cars, consistent with the report's focus on connected-device channels. At the same time, 2026 policy actions, including Canada’s CRTC levy changes under the Online Streaming Act and US-level scrutiny of payola practices, increase the commercial value of transparent promotion tooling, auditable recommendation and ad disclosures, and stronger rights reporting as platforms push for sustainable growth in regulated, high-royalty environments.
Recent Industry Developments in Music App Market
- July 2026: Apple Music price increase announced for global subscription plans. The pricing shift highlights licensing-cost exposure and reinforces premium tiering across streaming platforms. The adjustment raises ARPU pressure across platforms and may influence competitor pricing strategies.
- June 2026: Apple Music Classical partnership with Wigmore Hall to stream digital-only recordings. The partnership expands premium catalog through a dedicated classical channel. It strengthens content differentiation and supports exclusive and upgradeable content in the premium segment.
- May 2026: Spotify AI DJ language expansion to French, German, Italian, and Brazilian Portuguese in eight new markets. AI-driven personalization expands across key markets. It enhances user engagement and retention through localized, AI-curated experiences.
Music App Market Report Scope and Research Methodology
Market Definition and Coverage
For this methodology, the music app market covers revenue earned from consumer-facing applications that let users discover, listen to, or manage audio content on phones and connected devices. Monetization is tracked through subscriptions, in-app purchases, and advertising support.
Scope exclusions: Hardware sales, live event ticketing, and non-app music revenue streams are excluded even if they influence listening time.
Segments Covered in This Report
- By Monetization Model
- In-App Purchases
- Subscriptions
- Advertising-Supported
- Hybrid and Other Models
- By Platform
- Android
- iOS
- Web/Desktop
- Smart Speakers and Connected Devices
- By Content Type
- Music Streaming
- Podcast and Spoken Audio
- Live Audio and Events
- High-Resolution and Lossless Streaming
- By Age Group
- 13-24 Years
- 25-34 Years
- 35-44 Years
- 45 Years and Above
- By Geography
- North America
- United States
- Canada
- South America
- Brazil
- Argentina
- Rest of South America
- Europe
- United Kingdom
- Germany
- France
- Spain
- Italy
- Russia
- Rest of Europe
- Asia Pacific
- China
- India
- Japan
- South Korea
- Australia and New Zealand
- Rest of Asia Pacific
- Middle East and Africa
- Middle East
- Saudi Arabia
- United Arab Emirates
- Turkey
- Rest of Middle East
- Africa
- South Africa
- Nigeria
- Rest of Africa
- Middle East
- North America
Data Sources, Market Sizing, and Validation
Desk Research
Desk research was used to build the baseline market map and to anchor assumptions that should not change from one interviewee to the next. We leaned on public, non-paywalled sources such as IFPI global music reports, U.S. FCC broadband and smartphone connectivity indicators, ITU digital adoption statistics, and OECD digital economy tables to set realistic adoption and usage guardrails.
To translate the market into dollars, we also reviewed company filings and investor presentations, earnings call transcripts, reputable business press coverage, and developer documentation published on platform and device ecosystems. Patent databases were referenced selectively to understand feature direction, including personalization and audio delivery. For consistency in timelines and revenue disclosures, we used a news and financials subscription plus a company financials and intelligence subscription. These examples are not exhaustive, and many other sources were consulted for cross-checking, clarification, and validation.
Primary Interviews and Surveys
Primary work centered on expert interviews and structured surveys with app ecosystem participants, including product and monetization owners, ad operations teams, distribution partners, and industry advisors who track user growth and pricing. Because this is a global market, coverage was balanced across major regions so adoption patterns, ad rates, and the subscription mix could be tested before the final totals were locked.
Distribution of primary research fieldwork respondents
| Company type | Respondent position | Region |
|---|---|---|
| Top tier: 30% | CXOs: 17% | APAC: 44% |
| Mid tier: 51% | Functional/Unit leaders: 28% | EMEA: 34% |
| Smaller Players: 19% | Managers: 55% | Americas: 22% |
Market-Sizing & Forecasting
Sizing starts with a top-down demand pool build that links smartphone and connected-device usage to audio app engagement, then converts that into paying and ad-supported monetization. The model is subsequently checked through selective bottom-up approximations, such as sampled subscription price points by region multiplied by estimated subscriber bases, along with channel checks on ad-supported listening economics, and then totals are adjusted where gaps appear.
Key inputs include paid subscriber penetration, advertising load and effective ad rates, regional monthly pricing and discounting behavior, shifts between subscription and hybrid plans, and usage expansion from smart speakers and other connected devices. Where public figures are incomplete, ranges are used and tightened using primary feedback, and the final market number is anchored to the levers that can be explained through observable signals.
For forecasting, scenario analysis is used so outcomes reflect different paths for price increases, ad market cycles, and the pace of connected-device listening. Assumptions are reviewed with experts by region, and the forward view is updated when meaningful shifts occur in data pricing, regulation affecting advertising, or changes in consumer willingness to pay.
Data Validation & Update Cycle
Validation is done through multiple passes so the final figures do not depend on a single dataset or a single interview. We compare the modeled outputs against independent signals such as reported music industry revenue splits, disclosed subscription trends, and regional digital adoption metrics, then investigate outliers before sign-off.
If a variance looks structural, for example a sudden jump in implied ARPU or an ad-driven revenue share that does not reconcile with the underlying assumptions, the model is reworked and interview follow-ups are triggered to confirm what changed. Reports are refreshed annually, with interim updates when material events occur, and a fresh pre-delivery check is completed so clients receive the most current view available at the time of publication.
Mordor Intelligence's Music App Market Sizing Compared With Other Published Estimates
Published market numbers for music apps can vary widely, even when the titles sound similar, because each publisher draws the boundary differently on what counts as a music app and how monetization is treated. Differences also come from base-year choice, how pricing is converted across currencies, and whether estimates are updated after shifts in major platforms, the ad market, or consumer behavior.
The main gap comes from content scope, where Mordor Intelligence counts podcast and spoken-audio activity inside the app only when it is monetized as part of the app business model, rather than automatically rolling all digital audio revenue into the same total. Other gaps often show up in how hybrid plans are split between ad and subscription revenue, how regional price discounts are handled, and whether connected-device listening is valued consistently rather than double-counted across platforms.
Benchmark comparison
| Source | Market Size | Gaps in Research Methodology |
|---|---|---|
| Mordor Intelligence | USD 30.28 B (2026) | |
| Global Consultancy A | USD 33.90 B (2026) | Uses broader digital-audio framing that can pull in adjacent revenues beyond app-delivered consumption, and applies a more aggressive pricing progression without enough regional discounting checks. |
| Industry Association B | USD 26.10 B (2026) | Leans heavily on recorded-music revenue reporting and under-allocates value from hybrid and advertising-supported models, which can leave out monetization that sits inside consumer apps. |
Looking across the table, most of the spread can be explained by what is included as app revenue and how subscription versus ad-supported value is allocated. By tying the total to observable levers such as paid penetration, ad yield, pricing by region, and connected-device contribution, the final number stays traceable and repeatable when assumptions need to be revisited.
Key Questions Answered in the Report
How large is the music app market in 2026, and what growth is expected by 2031?
The music app market size is USD 30.28 billion in 2026 and is forecast to reach USD 37.62 billion by 2031, expanding at a 4.44% CAGR.
Which monetization model generates the most revenue for music apps today?
Subscription streaming remains dominant, holding 66.42% music app market share in 2025, with hybrid freemium tiers growing fastest at 13.58% CAGR through 2031.
Which region will contribute the most new users over the next five years?
Asia-Pacific is projected to grow at a 24.70% CAGR through 2031, accounting for the majority of new subscriber additions as smartphone adoption and carrier billing proliferate.
What technology trends are shaping future music app experiences?
AI-driven personalization, integrated smart-speaker and automotive apps, and expanded podcast catalogues are redefining how users discover and consume audio content.
How are rising royalty rates affecting platform strategies?
Higher U.S. mechanical royalties effective 2025 increase cost pressure, prompting platforms to refine pricing tiers and impose minimum-stream thresholds to protect margins.
Which age segment is growing fastest among music-app users?
The 13-24 age bracket is expanding at 10.53% CAGR, driving demand for social-centric features, collaborative playlists, and short-form discovery tools.