
MPOS Terminals Market Size and Share
Market Overview
| Study Period | 2020 - 2031 |
|---|---|
| Market Size (2026) | USD 40.73 Billion |
| Market Size (2031) | USD 54.01 Billion |
| Growth Rate (2026 - 2031) | 5.81 % |
| Fastest Growing Market | Asia Pacific |
| Largest Market | Asia Pacific |
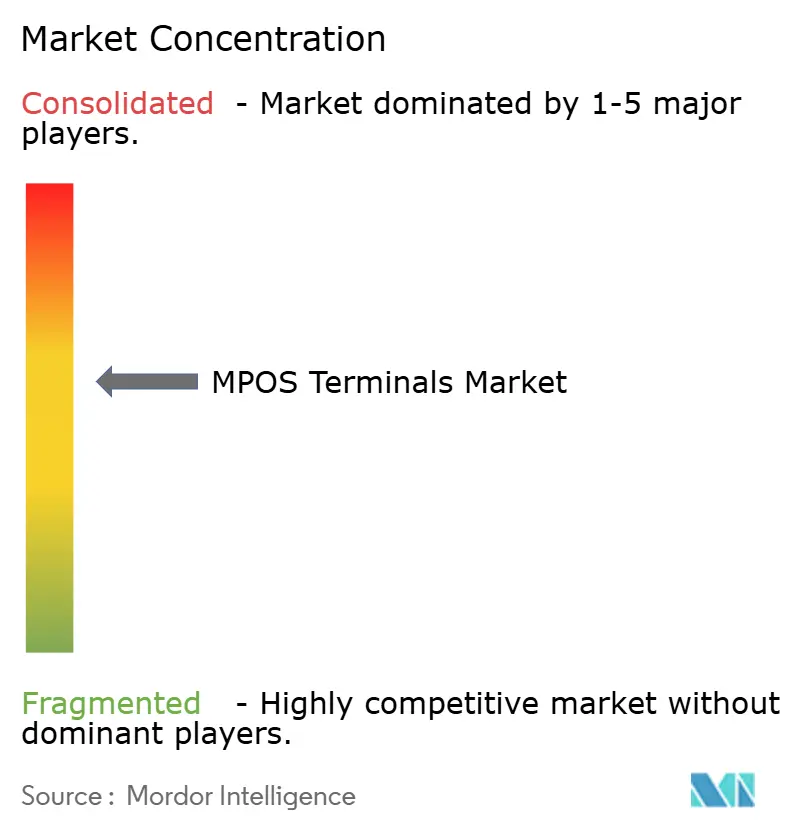
| Market Concentration | Medium |
Major Players *Disclaimer: Major Players sorted in no particular order Image © Mordor Intelligence. Reuse requires attribution under CC BY 4.0. | |
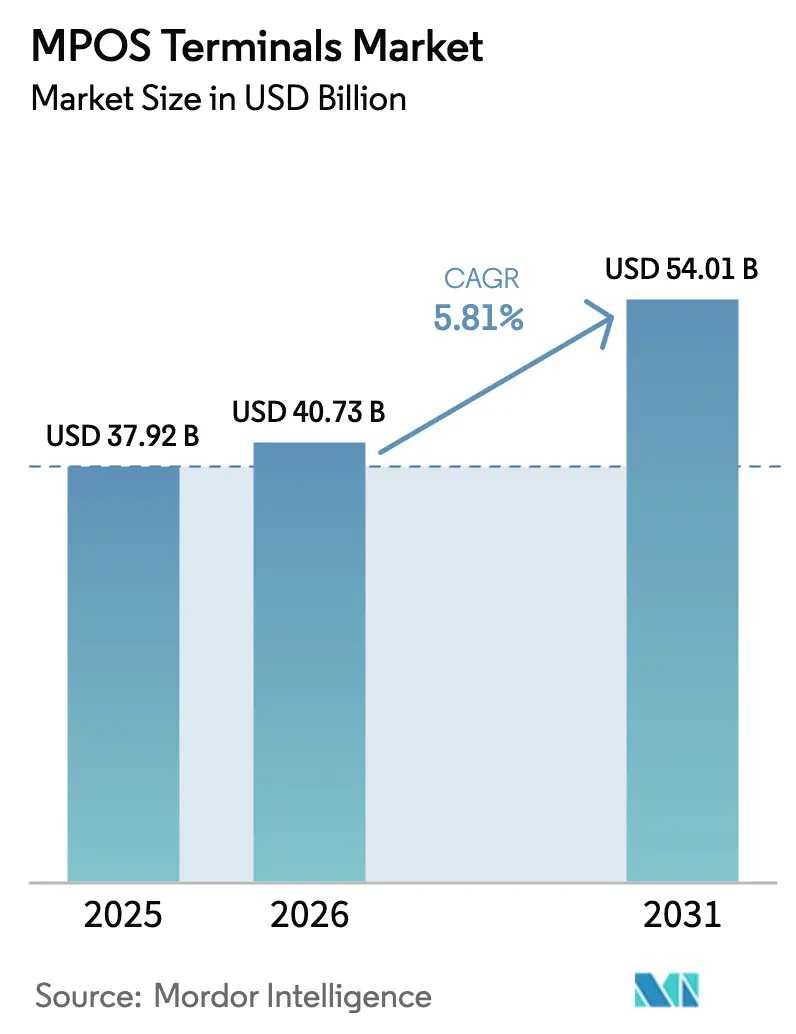
MPOS Terminals Market Analysis by Mordor Intelligence
The MPOS terminals market size is projected to expand from USD 37.92 billion in 2025 and USD 40.73 billion in 2026 to USD 54.01 billion by 2031, registering a 5.81% CAGR between 2026 to 2031. Software-only tap-to-phone certification is removing the need for dedicated entry-level hardware, while biometric Strong Customer Authentication regulations in Europe are stretching refresh cycles for premium devices. Platform players now bundle working-capital loans and data analytics with acceptance, raising merchant switching costs and compressing margins for pure-play hardware vendors. Regionally, Asia-Pacific is setting the tone with real-time payment rails and QR acceptance that speed new-merchant onboarding, whereas Europe is a compliance-driven replacement market and North America is approaching penetration limits. Cloud-based deployment keeps gaining favor because zero-capex onboarding, automated PCI DSS updates, and instant feature rollouts are more valuable to micro-merchants than local control of infrastructure.
Key Report Takeaways
- By geography, Asia-Pacific led with 29.41% of the MPOS terminals market share in 2025; it is projected to expand at a 6.02% CAGR through 2031.
- By device type, chip-and-PIN held 36.89% of the MPOS terminals market share in 2025, while biometric-enabled devices are forecast to grow at a 9.13% CAGR through 2031.
- By mode of payment, contact-based transactions retained 76.67% share of the MPOS terminals market size in 2025, yet contactless modes are advancing at an 8.34% CAGR to 2031.
- By end-user industry, retail accounted for 43.92% share of the MPOS terminals market size in 2025, whereas hospitality is advancing at a 6.47% CAGR through 2031.
- By deployment mode, on-premise solutions commanded 70.59% share of the MPOS terminals market size in 2025, but cloud-based platforms are growing at a 7.21% CAGR through 2031.
Note: Market size and forecast figures in this report are generated using Mordor Intelligence’s proprietary estimation framework, updated with the latest available data and insights as of January 2026.
Market Trends and Insights
Drivers Impact Analysis of MPOS Terminals Market*
| Driver | (~) % Impact on CAGR Forecast | Geographic Relevance | IMPACT TIMELINE |
|---|---|---|---|
| Ubiquity of Low-Cost Card Acceptance Hardware | +1.2% | Global - highest in Asia-Pacific and South America | Short term (≤ 2 years) |
| Accelerating Consumer Shift to Contactless and E-Wallet Payments | +1.5% | Global - led by Europe and Asia-Pacific, North America catching up | Medium term (2-4 years) |
| On-Device Tap to Phone Certification Unlocking Smartphone-as-POS Solutions | +0.9% | Global - early gains in Europe, North America, urban Asia-Pacific | Medium term (2-4 years) |
| Rapid Rollout of Value-Add Analytics for Micro-Merchants | +0.7% | Global - strongest in North America and Western Europe | Medium term (2-4 years) |
| Biometric SCA Mandates Under PSD2 Boosting Hardware Refresh | +0.6% | Europe with spillover to Middle East and select Asia-Pacific | Long term (≥ 4 years) |
| In-Store BNPL Enablement Requiring MPOS Firmware Upgrades | +0.5% | North America and Europe, expanding to Asia-Pacific | Medium term (2-4 years) |
| Source: Mordor Intelligence | |||
Ubiquity of Low-Cost Card Acceptance Hardware
Entry-level readers priced below USD 50 have unlocked acceptance for street vendors, pop-up retailers, and gig-economy workers that previously operated on cash alone. Square, SumUp, and PayPal Zettle all list sub-USD 50 dongles, and Asia-Pacific contract manufacturers now supply white-label units at under USD 30 ex-works, accelerating penetration into India’s tier-2 cities and Southeast Asia’s informal retail sector.[1] Device commoditization is forcing vendors to pivot toward higher-margin subscriptions for analytics dashboards, loyalty integration, and embedded financing, reducing reliance on hardware gross profit. ISO 20022 messaging and EMVCo specifications guarantee interoperability, stripping away vendor lock-in and sharpening price competition.
Accelerating Consumer Shift to Contactless and E-Wallet Payments
Ireland logged mobile wallets at 58.2% of point-of-sale value during H1 2025, and 92% of U.K. card payments were tap-to-pay in 2024. For merchants, a 15-second tap replaces a 30-45-second PIN entry, shrinking queues and labor costs in quick-service restaurants. Hospitality venues report 10-15% faster table turns when tableside NFC terminals remove trips to a cashier station. The upside for MPOS vendors is an accelerated replacement wave for contactless-capable hardware, although the same consumer preference also makes SoftPOS viable, applying downward pressure on entry-level device sales.
On-Device Tap to Phone Certification Unlocking Smartphone-as-POS Solutions
PCI MPoC v1.1, released in November 2024, formalized security for software acceptance on commercial smartphones, removing the dongle requirement for many micro-merchants. Apple Tap to Pay lets small businesses download an app, pass KYC, and start accepting payments the same day, with no hardware cost beyond an NFC-enabled phone.[2] Visa and Mastercard have since certified dozens of Android-based SoftPOS apps, widening availability in Europe and North America. By collapsing the total cost of acceptance to near-zero hardware and sub-2% processing, SoftPOS is poised to capture up to one-fifth of new micro-merchant onboarding in Europe by 2027.
Rapid Rollout of Value-Add Analytics for Micro-Merchants
Terminals have evolved into business-intelligence hubs that surface real-time revenue splits, peak-hour heatmaps, and inventory alerts. Square Dashboard, Toast’s restaurant analytics, Clover-QuickBooks integration, and Shopify POS each monetize premium insights at USD 20-50 per month, a margin multiple of hardware sales.[3] Micro-merchants with no dedicated finance staff can now optimize pricing, staffing, and promotion strategy, translating data into immediate profitability gains. The added stickiness drives retention and keeps payment volume on platform, counterbalancing margin erosion in hardware.
Restraints Impact Analysis of MPOS Terminals Market*
| Restraint | (~) % Impact on CAGR Forecast | Geographic Relevance | IMPACT TIMELINE |
|---|---|---|---|
| Emerging Tap-on-Phone SoftPOS Cannibalizing Dedicated MPOS Hardware | -0.8% | Global - most acute in Europe and North America | Short term (≤ 2 years) |
| Costly Migration to PCI MPoC and PCI v6 Compliance | -0.6% | Global - affects all hardware manufacturers | Medium term (2-4 years) |
| Patchy Broadband and Power in Rural Markets | -0.4% | Emerging Africa, South Asia, rural South America | Long term (≥ 4 years) |
| Persistent Security and Fraud Concerns | -0.3% | Global - heightened scrutiny in Europe and North America | Medium term (2-4 years) |
| Source: Mordor Intelligence | |||
Emerging Tap-on-Phone SoftPOS Cannibalizing Dedicated MPOS Hardware
Stripe’s software-only SDK, Apple Tap to Pay, and Android SoftPOS from Adyen and Worldline eliminate the USD 50-150 hardware purchase for small merchants, substituting existing smartphones for separate terminals. Micro-merchants and seasonal vendors processing fewer than 100 transactions a month are particularly drawn to zero-capex onboarding. European SoftPOS adoption could reach 15-20% of new merchant accounts by 2027, eroding entry-level device demand.[4] Incumbent vendors are countering by emphasizing countertop units with printers, customer displays, and biometric readers that smartphones cannot replicate, but the low-margin high-volume segment is already migrating toward software.
Costly Migration to PCI MPoC and PCI v6 Compliance
PCI PTS POI v6.0 adds secure boot, encrypted firmware, and hardware key storage, raising design complexity and lifting certification fees to USD 50,000-150,000 per model. The compliance deadline was pushed from January 2025 to June 2026, yet smaller manufacturers still face 6-12-month testing backlogs and risk stranded inventory if approvals slip. Meanwhile, PCI MPoC adds parallel compliance costs for vendors offering SoftPOS, multiplying R&D budgets. Scale players such as VeriFone, PAX Technology, and Ingenico can amortize expenses across global volume, whereas regional OEMs face margin compression or exit pressures.
*Our forecasts treat driver/restraint impacts as directional, not additive. The impact forecasts reflect baseline growth, mix effects, and variable interactions.
MPOS Terminals Market Segment Analysis
By Device Type:
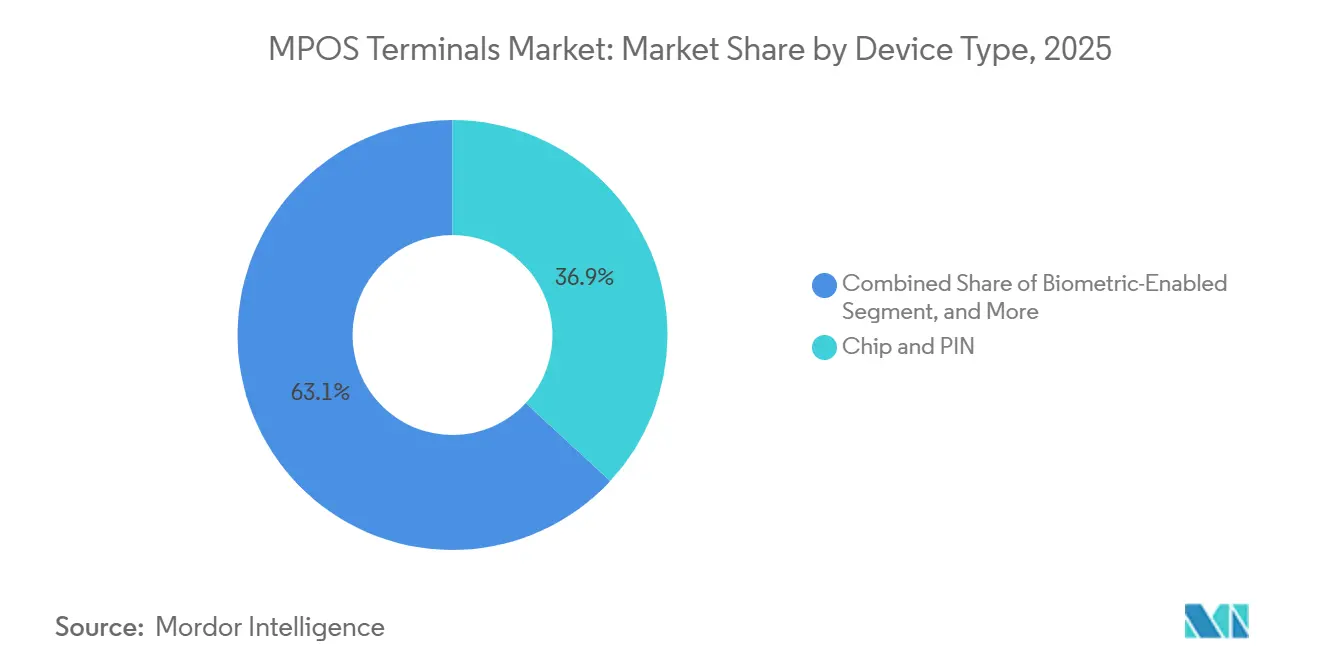
Biometric Authentication Drives Premium Tier ExpansionChip-and-PIN held 36.89% of the MPOS terminals market share in 2025, underscoring its entrenchment in regulated environments. Biometric readers, however, are recording a 9.13% CAGR to 2031 after PSD2 raised authentication thresholds, fueling demand for fingerprint or facial recognition terminals across Europe. The MPOS terminals market size allocated to biometric devices therefore rises disproportionately as merchants absorb 30-40% higher unit prices to reduce chargebacks and align with data-protection rules. Low-feature magnetic-stripe and chip-only models now occupy a residual niche, mainly in countries with delayed EMV migration. Over time, device competition is shifting from interface technology toward authentication sophistication, with FIDO-certified sensors and privacy-preserving algorithms emerging as product differentiators.
The premium emphasis is attracting specialized suppliers such as Next Biometrics, which deployed fingerprint sensors in Vietnamese terminals, and PopID, which piloted facial-auth payment systems in the United Arab Emirates. Established vendors are integrating similar modules to defend share, while software platforms tie biometric readiness to value-add features like age verification and self-checkout. Cost-sensitive merchants in low-fraud environments stick with chip-and-PIN, while higher-ticket verticals migrate toward biometric-embedded models to balance security and user experience.

By Mode of Payment:
Contactless Gains Accelerate Despite Contact-Based DominanceContact-based transactions retained 76.67% share in 2025, yet contactless volume is expanding at an 8.34% CAGR, nearly 1.5 times the overall MPOS terminals market growth. Consumer familiarity with tap-to-pay cards and mobile wallets has reached a tipping point, exemplified by Canada’s 3.4 billion mobile contactless transactions in 2024 and the United Kingdom’s 92% tap rate. To remain competitive, merchants are accelerating terminal refresh cycles toward NFC-enabled models or adopting SoftPOS that leverages the built-in antenna on smartphones.
Speed and convenience drive this migration. Contactless swipes average 15 seconds versus up to 45 seconds for PIN entry, translating into shorter queues and higher throughput in retail and hospitality. While compliance-driven verticals such as fuel or high-value ticketing will sustain contact-based methods, the growth premium for contactless is expected to keep widening as mobile wallet ecosystems expand loyalty, coupon, and digital-identity features that deepen user engagement.
By End-User Industry:
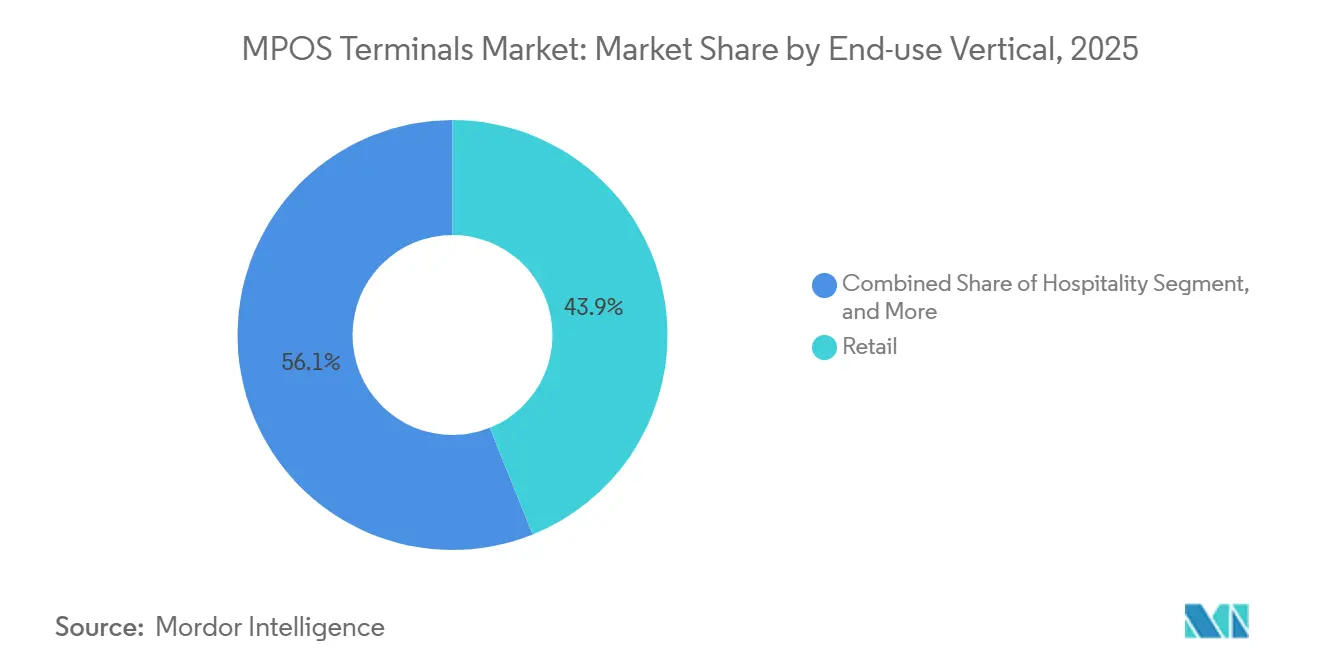
Hospitality Leads Growth as Retail Holds ShareRetail bookings represented 43.92% of the MPOS terminals market size in 2025 owing to transaction volume and geographic ubiquity. Hospitality, however, is on track for a 6.47% CAGR through 2031, catalyzed by tableside payments that improve table turns by 10-15% and boost tip capture through suggested-gratuity screens. The MPOS terminals market share commanded by hospitality is therefore rising faster than its underlying transaction count, reflecting multiple terminals per venue rather than single checkout points.
Beyond restaurants, hotels are adopting handheld check-in units, and stadiums are shifting concessions to mobile kiosks. Healthcare is another growth pocket, integrating HIPAA-compliant MPOS modules into practice-management software for patient co-pay capture. Transportation fleets embed readers into driver handhelds for proof-of-delivery payment capture, while parking operations retrofit pay-on-foot machines with contactless modules. These specialized workflows highlight a pivot from generic payment acceptance toward process-specific terminal deployment that monetizes convenience and data insights.
By Deployment Mode:
Cloud-Based SaaS Gains on Zero-Capex AppealOn-premise infrastructure still held 70.59% share in 2025, but cloud adoption is accelerating at a 7.21% CAGR on the back of zero upfront capital expenditure, automated PCI updates, and rapid feature release cadences. Stripe, Adyen, and Square provision new merchants in hours, bundling payment processing, analytics, and settlement within a single subscription interface. The MPOS terminals market size linked to cloud models is enlarging faster than the headline market as micro-merchants favor pay-as-you-go economics.
Connectivity remains the constraint. Rural India, Indonesia, and sub-Saharan Africa, where broadband penetration lags 40%, still rely on on-premise or hybrid devices that buffer transactions offline. Vendors are mitigating risk with dual-SIM modules, local storage, and solar-charging docks, but those features lift device cost and complicate inventory. Over time, 5G rollout and satellite backhaul will ease the constraint, extending SaaS predominance into currently underserved regions.
Geography Analysis
APAC MPOS Terminals Market
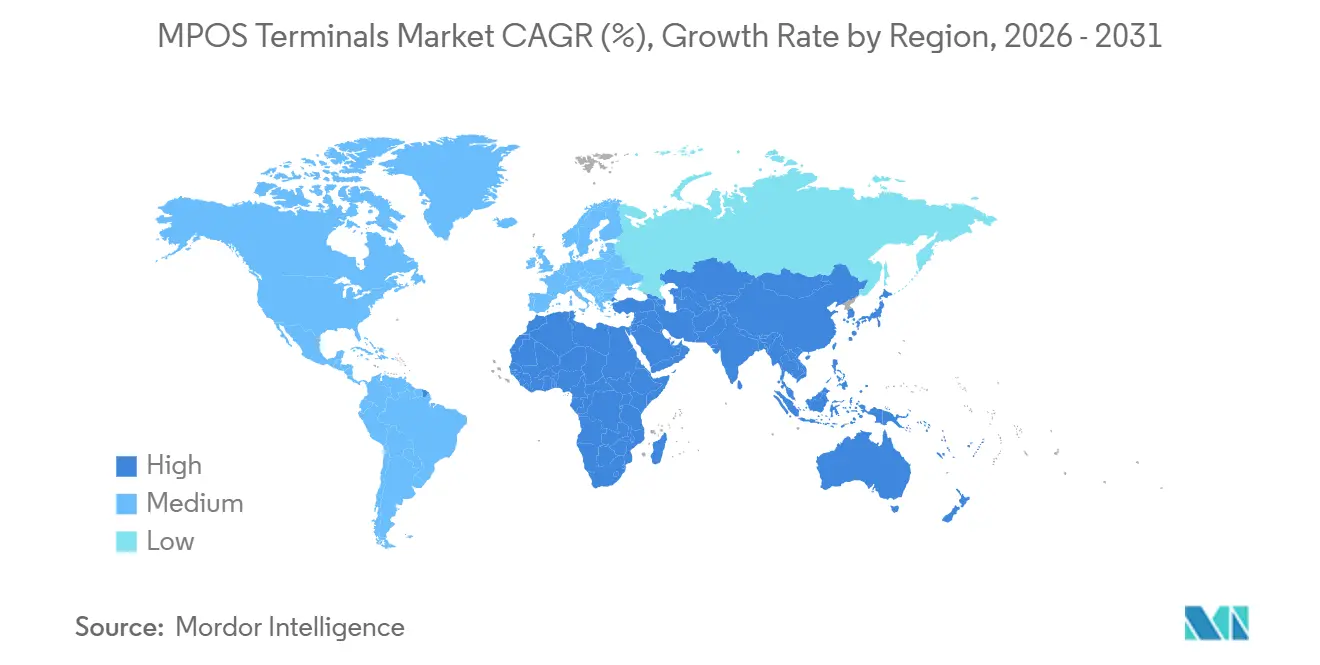
Asia-Pacific contributed 29.41% of global revenue in 2025 and is forecast to post a 6.02% CAGR through 2031, the fastest of any region. Momentum stems from India’s UPI, which recorded 16.73 billion transactions in December 2024, and China’s Alipay Plus, which lets Thai, Malaysian, and Indonesian merchants accept payments from Chinese visitors via QR code without new hardware. Japan and South Korea are migrating from magnetic stripe to NFC ahead of regulatory sunsets, while Australia’s tap-and-go penetration tops 95%. Rural broadband in India and Indonesia hovers below 40%, and inconsistent electricity in Bangladesh and Vietnam limits always-on deployment.
North America MPOS Terminals Market
North America ranks second in size. The region’s early EMV liability shift front-loaded hardware upgrades, so current demand revolves around replacing legacy units with contactless and biometric models. Canada’s 3.4 billion mobile contactless payments in 2024 showcase the consumer uptake, and Mexico’s fintech-driven merchant onboarding adds incremental headroom. Growth is steady but trails Asia-Pacific, reflecting market maturity and high existing penetration.
EMEA and South America MPOS Terminals Market
Europe’s trajectory hinges on PSD2 Strong Customer Authentication, which is driving premium hardware refresh even as SoftPOS cannibalizes entry tiers. Markets such as France and Germany are retrofitting terminals with fingerprint sensors to meet exemption thresholds, while micro-merchants adopt smartphone-based acceptance to avoid capital outlays. South America is propelled by Brazil’s Pix instant-payment system that exceeded 40 billion transfers in 2024, integrating QR acceptance directly into point-of-sale software. The Middle East benefits from smart-city investments in the United Arab Emirates and Saudi Arabia’s Vision 2030, whereas Africa remains constrained by power availability, forcing hybrid offline-first deployments despite strong mobile-money ecosystems.
Regulatory Landscape
The regulatory environment for MPOS terminals is anchored in card-security standards and payments-authentication mandates that shape product design and refresh cycles. The PCI Security Standards Council has progressed requirements for software and hardware acceptance, including PCI MPoC v1.1 released in November 2024 and the broader move toward newer PCI baselines. In Europe, PSD2 Strong Customer Authentication continues to influence the uptake of biometric-capable devices in regulated merchant categories. At the same time, scheme and interoperability specifications, including EMVCo and ISO 20022, reduce proprietary lock-in but increase the need for consistent certification and lifecycle patching.
Compliance expectations are also expanding beyond payments security into software integrity and merchant conduct. In June 2026, the United Kingdom opened a consultation on electronic sales suppression controls for EPOS/MPOS systems, which points to tighter technical expectations for retail software and has implications for MPOS platform logging, reporting, and auditability requirements. Separately, enforcement activity has increased scrutiny on platform operators, with 2026 consent-judgment actions involving Block Inc. at the state level in the United States underscoring that onboarding, disclosures, and compliance management can affect payment-acceptance ecosystems alongside device certifications.
Value Chain Analysis
The MPOS value chain runs from component suppliers, including NFC controllers, secure elements, biometric sensors, batteries, and displays, through device OEMs and ODMs, certification and test bodies, payment networks, acquirers and payment facilitators, software platforms, and merchant-facing channels. Manufacturing and final assembly remain concentrated in Asia, while security-critical elements and firmware stacks depend on specialized silicon and cryptographic key-management processes. A growing share of value sits above hardware, including cloud-based device management, analytics, and embedded financial services bundled with acceptance.
Certification acts as a gating function that can delay launches and shape bill-of-materials decisions, particularly as vendors run parallel paths for hardware terminals and smartphone-based SoftPOS. In January and February 2026, European Card Payment Cooperation (ECPC) published CPACE contactless kernel certification documents for PAX and VeriFone configurations, illustrating how scheme-adjacent certification programs influence which device models and software kernels can be deployed across acquiring ecosystems. On the demand side, acquirers and platform players increasingly decouple device procurement from processing contracts, using multi-vendor hardware portfolios while monetizing distribution, settlement, and software subscriptions.
Competitive Landscape
Competition is moderate in concentration but intense in platform value-added layers. Block’s Square, Fiserv’s Clover, and Toast’s restaurant-specific stack employ hardware as a gateway to recurring software revenue, including analytics, payroll, and working-capital loans that raise switching costs. Traditional device OEMs like VeriFone and PAX Technology increasingly supply white-label units to fintech aggregators, preserving scale volumes while ceding direct merchant touchpoints. Hardware gross margins have compressed from about 40% a decade ago to near 15-20% today, compelling all players to rely on subscription and processing fees over unit sales.
Strategic whitespace persists in healthcare, transportation, and rural emerging markets. Fewer than 30% of U.S. small medical practices have modern point-of-care payment capture because HIPAA compliance and legacy billing integrations raise adoption friction. Logistics operators need interoperable handheld readers for proof-of-delivery settlement, yet the segment remains splintered across proprietary solutions. Rural India, Indonesia, and sub-Saharan Africa still favor hybrid offline-first devices, creating entry points for vendors capable of pairing solar charging and offline buffering with cloud analytics.
Start-ups are leveraging pricing and settlement speed to chip at incumbents. South Africa’s Yoco offers zero-monthly-fee processing and same-day settlement to 400,000 micro-merchants, while Eastern Europe’s myPOS bundles IBAN accounts and instant payouts across the European Economic Area. Square Capital lent USD 4.1 billion to merchants in 2025, and Toast Capital expanded Working Capital loans beyond the United States, tying financing rates to payment volume. The fight is gradually shifting from device features to embedded financial-service breadth.
MPOS Terminals Industry Leaders
-
Block Inc. (Square)
-
Fiserv Inc. (Clover)
-
VeriFone Inc.
-
PAX Technology Ltd.
-
Newland Payment Technology
- *Disclaimer: Major Players sorted in no particular order
MPOS Terminals Market Companies Covered in this Report
- Block Inc. (Square)
- Fiserv Inc. (Clover)
- VeriFone Inc.
- PAX Technology Ltd.
- Newland Payment Technology
- BBPOS Ltd.
- SumUp Payments Ltd.
- PayPal Zettle
- Adyen N.V.
- Lightspeed Commerce Inc.
- Shopify Inc. (Shop POS)
- Toast Inc.
- NCR Voyix Corp.
- HP Development Company L.P.
- NEC Corporation
- Panasonic Holdings Corp.
- Spectra Technologies India Pvt Ltd.
- Posiflex Technology Inc.
- Oracle Micros Systems
- North American Bancard (PayAnywhere)
- Yoco Technologies Pty Ltd.
- myPOS World Ltd.
Market Opportunities and Future Outlook
Opportunities increasingly concentrate in platform-led distribution, where MPOS hardware is packaged with software, financing, and omnichannel tools, lifting merchant lifetime value as entry-level device pricing compresses. Fiserv disclosures on expanding merchant capabilities through payment-adjacent assets support the relevance of integrated offers, including ordering, loyalty, and digital engagement, for Clover-style ecosystems. For hardware OEMs, whitespace remains in premium and regulated use cases where dedicated devices are still preferred, including biometric authentication under Strong Customer Authentication pressure in Europe and countertop configurations requiring peripherals such as printers, scanners, and customer displays that smartphones do not replicate.
A second opportunity area centers on compliance-driven upgrades and certification readiness, which steer merchant and acquirer purchasing toward vendors that can sustain secure software-update cadences and pass regional kernels and security baselines. ECPC CPACE certifications published in early 2026 for PAX and VeriFone contactless kernel implementations highlight continued investment in contactless interoperability as a commercial prerequisite in parts of Europe. At the same time, government attention on EPOS/MPOS software integrity, including the UK consultation on electronic sales suppression controls in June 2026, creates demand for auditable transaction records, tamper-resistant logs, and tighter integration between POS software and payment acceptance, giving ISVs and platform providers a lever to differentiate through compliance-by-design rather than hardware alone.
Recent Industry Developments in MPOS Terminals Market
- June 2026: Verifone Victa Mobile available for pre-order in the U.S. and Canada as part of a Shopify partnership. The pre-order expands access to cloud-enabled mobile POS and accelerates merchant onboarding within the Shopify-Verifone ecosystem.
- May 2026: Newland NPT integration with Fiserv following Letter of Approval for North American deployment. The North American deployment enablement via pre-certified infrastructure supports smoother partner integration and accelerates MPOS adoption for Newland and Fiserv customers.
- April 2026: PAX A920Pro PCI 7 smart mobile POS device launched (Android-based). The Android-based device enters the mainstream market and enables ecosystem-wide software integrations and hardware refresh cycles.
MPOS Terminals Market Report Scope and Research Methodology
Market Definition and Coverage
For this study, the mPOS terminals market covers payment-acceptance terminals used in-store or on-the-go that connect to mobile devices or enable mobile-led checkout. Revenue is captured from the terminal hardware and related embedded terminal components sold for merchant use.
Scope exclusions: We exclude fixed countertop POS systems, pure software-only payment acceptance apps, and back-end payment processing fees that are not tied to terminal sales.
Segments Covered in This Report
- By Device Type
- Chip and PIN
- Chip and Signature
- Contactless and NFC
- Magnetic-Stripe-Only
- Biometric-Enabled
- By Mode of Payment
- Contact-based
- Contactless
- By End-User Industry
- Retail
- Hospitality
- Healthcare
- Transportation and Logistics
- Other End-User Industries
- By Deployment Mode
- On-Premise
- Cloud-Based and SaaS
- By Geography
- North America
- United States
- Canada
- Mexico
- South America
- Brazil
- Argentina
- Rest of South America
- Europe
- Germany
- United Kingdom
- France
- Italy
- Spain
- Rest of Europe
- Asia-Pacific
- China
- Japan
- India
- South Korea
- Southeast Asia
- Rest of Asia-Pacific
- Middle East
- Saudi Arabia
- United Arab Emirates
- Rest of Middle East
- Africa
- South Africa
- Egypt
- Rest of Africa
- North America
Data Sources, Market Sizing, and Validation
Desk Research
Desk research was used to set the market frame and anchor the model to visible demand signals before assumptions were taken to interviews. We mainly reviewed public payments and retail indicators such as central bank and regulator updates, card network and EMVCo publications, and government trade statistics that show terminal-related import and export patterns.
We also used sources such as the World Bank, IMF, and OECD for macro inputs that affect merchant spending, plus annual reports and investor presentations to understand device launches and channel emphasis. When needed, paid databases were used for company financials, patent trend checks, and shipment-level trade reads to validate directionally. The sources listed above are illustrative only, and additional public documents and datasets were referenced for data collection, validation, and clarification.
Primary Interviews and Surveys
Primary interviews and structured surveys were used to pressure-test pricing, replacement timing, and adoption differences across small merchants, retail chains, and field-service sellers. We spoke with a mix of device ecosystem participants (including terminal makers, distributors, acquirers, and merchant-facing solution providers) across major regions so secondary signals could be verified, and we could close gaps in country-level rollout timing.
Distribution of primary research fieldwork respondents
| Company type | Respondent position | Region |
|---|---|---|
| Top tier: 36% | CXOs: 16% | APAC: 38% |
| Mid tier: 44% | Functional/Unit leaders: 34% | EMEA: 37% |
| Smaller Players: 20% | Managers: 50% | Americas: 25% |
Market-Sizing & Forecasting
The core sizing logic uses a top-down build that reconstructs the addressable demand pool from merchant digitization and cashless payment expansion, then converts that pool into device value using adoption and replacement assumptions. To keep totals realistic, we cross-check outputs with selective bottom-up approximations, such as sampled average selling price (ASP) by device class multiplied by estimated annual unit placements, followed by channel checks indicating where shipments are concentrated.
Key inputs that shaped the model included contactless penetration, EMV certification and compliance cycles, merchant onboarding pace in small business-heavy sectors, typical device refresh timelines, and regional ASP progression as entry devices commoditize. For forecasting, we leaned on scenario analysis supported by expert consensus on variables such as regulatory enforcement timing, soft acceptance substitution risk, and the pace of new merchant additions. Where country detail was thin, we used proxy indicators from similar markets and adjusted based on interview feedback so the gap did not mechanically inflate the global total.
Data Validation & Update Cycle
Estimates are validated through triangulation across independent signals, followed by variance checks at region and device level so outliers are not carried forward. If a key assumption shifts, such as a sudden pricing reset or a regulatory deadline change, the model is re-run and the related experts are re-contacted to confirm whether the change is temporary or structural.
Before numbers are finalized, a multi-step review is done to ensure calculations, conversions, and growth logic are consistent across the full time series. Reports are refreshed annually, and interim updates are made when material events occur that can move demand, pricing, or replacement behavior. Right before delivery, a fresh pass is completed so the latest public updates are reflected in the final view.
Mordor Intelligence's Mpos Terminals Market Size Versus Other Published Estimates
Published market values for mPOS terminals can look far apart because authors do not always count the same revenue streams, time frames, or device definitions, even when the topic label sounds identical. Differences also come from how ASP changes are handled, how quickly replacement cycles are assumed, and whether regional rollout timing is validated with field feedback.
Some external estimates lean toward narrow hardware-only counting for mobile readers, and others stretch into broader acceptance infrastructure and bundled payments services that sit beyond terminal sales. In Mordor Intelligence's estimate, the market is limited to terminal device value (hardware and embedded terminal components), and the year-on-year totals are refreshed using region-specific ASP and replacement assumptions that were checked with interviews.
Benchmark comparison
| Source | Market Size | Gaps in Research Methodology |
|---|---|---|
| Mordor Intelligence | USD 40.73 B (2026) | |
| Industry Publisher A | USD 3.76 B (2024) | Uses a tighter device definition that often maps to mobile POS terminals as dedicated handheld units, and it can exclude large volumes of smartphone-paired mPOS attachments and higher-value smart terminals, which keeps the total smaller. |
| Business Report Outlet B | USD 32.20 B (2023) | Applies a broader inclusion set that can mix mPOS terminals with wider payment acceptance solutions and faster-growth assumptions, and it is also anchored to an earlier base year that does not reflect later ASP compression. |
The spread across the three numbers is mostly explained by what gets counted as a terminal sale and how quickly pricing and replacement are assumed to move. By keeping scope tied to device value and stress-testing those inputs through interviews and cross-checks, our model stays repeatable and easier to reconcile with observable deployment and pricing signals.
Key Questions Answered in the Report
What is the projected value of the MPOS terminals market in 2031?
The MPOS terminals market is forecast to reach USD 54.01 billion by 2031.
How quickly is the MPOS terminals market expected to grow between 2026 and 2031?
The market is projected to advance at a 5.81% CAGR over the 2026-2031 period.
Which region is expanding fastest in MPOS terminal adoption?
Asia-Pacific is anticipated to register the highest regional growth with a 6.02% CAGR through 2031.
Why are biometric MPOS devices gaining traction?
European Strong Customer Authentication rules and wider fraud-reduction efforts are driving a 9.13% CAGR in biometric-enabled terminal shipments.
What is SoftPOS and why does it matter?
SoftPOS software turns NFC-enabled smartphones into payment terminals, eliminating separate hardware costs and attracting micro-merchants seeking zero-capex acceptance.
How are vendors offsetting shrinking hardware margins?
Providers bundle analytics, financing, payroll, and inventory tools into subscription packages, shifting revenue toward high-margin recurring software and services.