
Motion Sensor Market Size and Share
Market Overview
| Study Period | 2020 - 2031 |
|---|---|
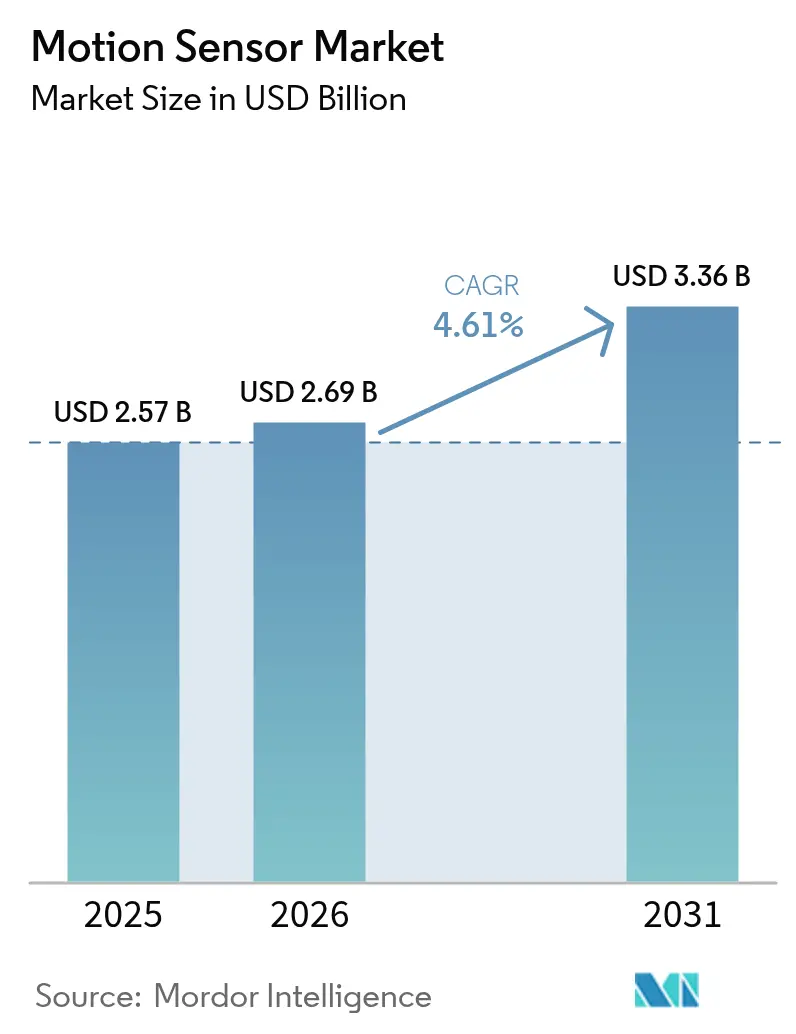
| Market Size (2026) | USD 2.69 Billion |
| Market Size (2031) | USD 3.36 Billion |
| Growth Rate (2026 - 2031) | 4.61% CAGR |
| Fastest Growing Market | Middle East and Africa |
| Largest Market | Asia Pacific |
| Market Concentration | Medium |
Major Players *Disclaimer: Major Players sorted in no particular order Image © Mordor Intelligence. Reuse requires attribution under CC BY 4.0. | |
Motion Sensor Market Analysis by Mordor Intelligence
The motion sensor market size is expected to grow from USD 2.57 billion in 2025 to USD 2.69 billion in 2026 and is forecast to reach USD 3.36 billion by 2031 at 4.61% CAGR over 2026-2031. Consistent demand created by mandatory automotive safety systems, rising smart-home deployments, and the semiconductor sector’s cyclical rebound underpins this steady expansion. Government safety regulations in the United States and European Union continue to standardize technology requirements, giving suppliers clear production roadmaps. Parallel growth in edge artificial intelligence and ultra-low-power design shortens upgrade cycles, while incremental innovations in multi-axis solutions sustain pricing power. Competitive intensity remains moderate as vertically integrated chipmakers leverage in-house design, packaging, and software stacks to secure design wins.
Key Report Takeaways
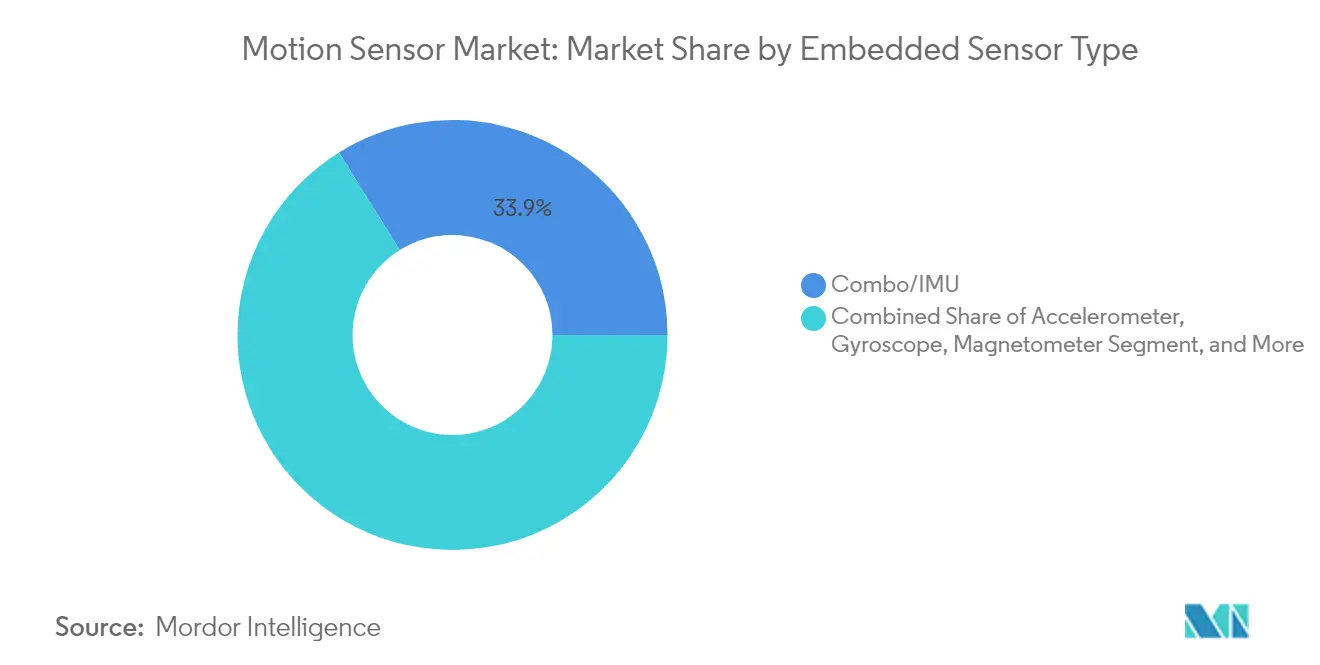
- By embedded sensor type, Combo/IMU solutions captured 33.85% of motion sensor market share in 2025 and are advancing at a 4.72% CAGR through 2031.
- By application, consumer electronics led with 41.65% revenue share in 2025, while smart-home and building automation is projected to expand at a 6.88% CAGR to 2031.
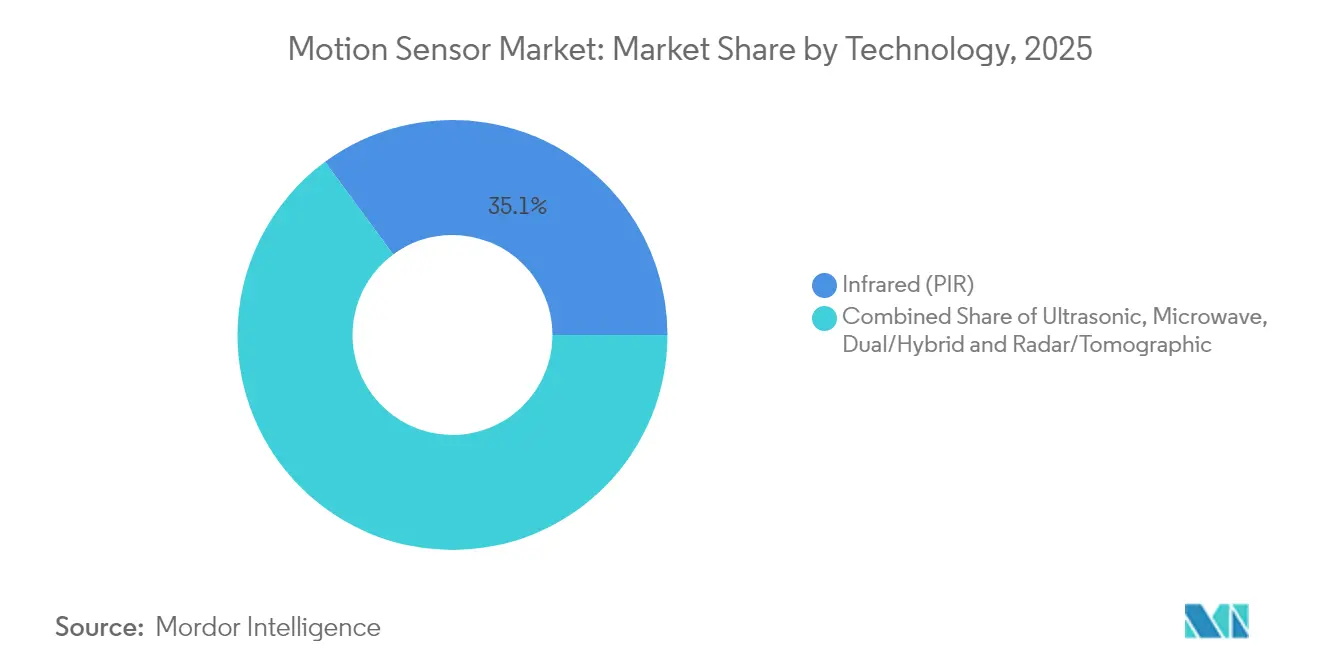
- By technology, infrared sensors held 35.10% share of the motion sensor market size in 2025; radar/tomographic solutions post the fastest CAGR at 5.42% through 2031.
- By functionality, fully automatic systems accounted for 55.70% share of the motion sensor market size in 2025 and are growing at 4.95% CAGR between 2026-2031.
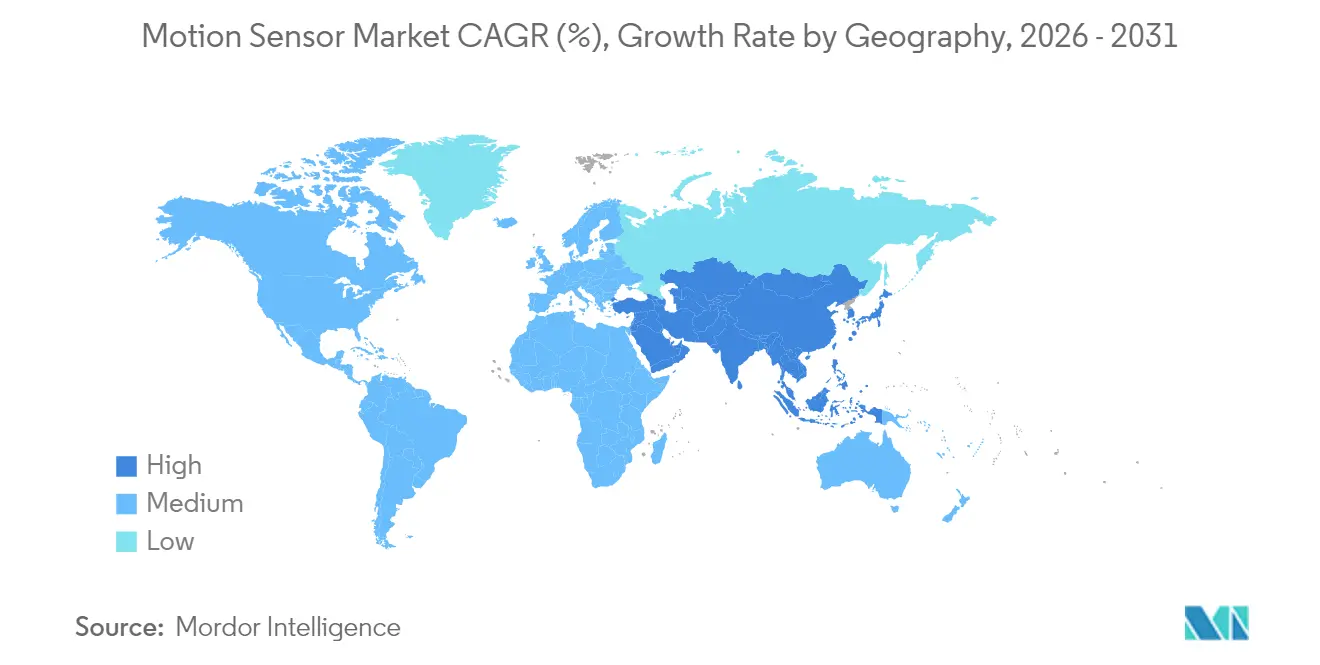
- By geography, Asia-Pacific dominated with 36.95% revenue share in 2025, whereas the Middle East & Africa region is forecast to record the highest 5.04% CAGR to 2031.
Note: Market size and forecast figures in this report are generated using Mordor Intelligence’s proprietary estimation framework, updated with the latest available data and insights as of 2026.
Global Motion Sensor Market Trends and Insights
Drivers Impact Analysis*
| Driver | (~) % Impact on CAGR Forecast | Geographic Relevance | Impact Timeline |
|---|---|---|---|
| MEMS penetration in automotive and mobile devices | +1.2% | Global (APAC, North America) | Medium term (2-4 years) |
| Surge in motion-enabled gaming and AR/VR | +0.8% | North America, EU, expanding to APAC | Short term (≤ 2 years) |
| Smart-home and building-automation rollout | +1.1% | Global, early adoption in developed markets | Long term (≥ 4 years) |
| Edge-AI ultra-low-power sensor innovations | +0.6% | North America & EU technology hubs | Long term (≥ 4 years) |
| Wearable and IoT sensor-fusion demand | +0.7% | Global urban centers | Medium term (2-4 years) |
| ADAS-mandate-led demand for inertial combos | +1.0% | Global, regulation driven | Short term (≤ 2 years) |
| Source: Mordor Intelligence | |||
MEMS Penetration in Automotive and Mobile Devices
Regulators have locked in long-range roadmaps for advanced driver assistance functions, and each incremental feature requires added inertial sensing. The National Highway Traffic Safety Administration’s 2024 decision to rate vehicles on blind-spot, lane-keeping, and pedestrian automatic braking incentives ensures that each new model refresh carries more motion sensing content.[1]National Highway Traffic Safety Administration, “New Car Assessment Program Final Decision Notice-Advanced Driver Assistance Systems and Roadmap,” nhtsa.govSmartphone vendors meanwhile embed multiple micro-electro-mechanical sensors to power augmented reality interfaces and gesture controls, creating overlapping demand cycles that cushion suppliers from sector-specific slowdowns. Vertically integrated chipmakers benefit most because they can shift foundry capacity between automotive and mobile runs without redesigning core sensor elements. Centralized vehicle compute architectures may temper total unit volumes later in the decade, yet higher per-device complexity should offset any volume erosion.
Surge in Motion-Enabled Gaming and AR/VR
Immersive gaming platforms need sub-millisecond tracking accuracy; a 2025 study showed that acoustic injection attacks can mislead inertial measurement units in leading headsets, distorting virtual content and inducing motion sickness These vulnerabilities spur demand for redundant sensor arrays and secure fusion algorithms that raise overall bill-of-materials value. Controller vendors, exemplified by haptic-rich console accessories, already combine accelerometers, gyroscopes, and capacitive touch to improve realism. As mixed-reality adoption spreads to enterprise training and field maintenance, the motion sensor market gains a diversified customer base that is less tied to consumer spending cycles.
Smart-Home and Building-Automation Rollout
Commercial smart-building pilots have demonstrated average electricity savings of 36.8 kW per site by using networked motion detectors to tailor HVAC and lighting schedules.[2]Hakilo Sabit and Thit Tun, “IoT Integration of Failsafe Smart Building Management System,” mdpi.com Sony’s 2024 deployment of edge-AI vision detection in 500 Japanese convenience stores highlights how retailers use privacy-preserving analytics to optimize labor and reduce energy costs without exporting raw video.[3]Sony Semiconductor Solutions, “Edge AI-Driven Vision Detection Solution Introduced at 500 Convenience Stores in Japan,” sony-semicon.comAs payback periods shorten, building owners integrate multiple sensing modalities-passive infrared, radar, and vision-to cover varied occupancy scenarios. Federated learning frameworks further allay privacy concerns by keeping data on-premise, though higher system complexity raises integrator skill requirements and may slow uptake among smaller installers.
Edge-AI Ultra-Low-Power Sensor Innovations
Industrial maintenance now favors embedded analytics at the sensor node rather than streaming vibration data to cloud engines. Analog Devices’ Voyager4 platform illustrates this shift by combining a MEMS accelerometer with local machine-learning inference to flag bearing faults in real time while extending battery life.[4]Analog Devices, “Designing Edge Sensors with Artificial Intelligence-Part 1,” analog.comThe Semiconductor Research Corporation’s decadal plan singles out intelligent sensing as a strategic priority, reinforcing US federal funding proposals to underwrite domestic R&D and shorten supply chains. Success in merging AI cores and motion detection will depend on continued breakthroughs in sub-threshold circuitry and neuromorphic co-processors that limit heat dissipation.
Restraints Impact Analysis*
| Restraint | (~) % Impact on CAGR Forecast | Geographic Relevance | Impact Timeline |
|---|---|---|---|
| High cost of advanced MEMS alternatives | -0.9% | Global, price-sensitive markets | Medium term (2-4 years) |
| Semiconductor supply-chain bottlenecks | -0.7% | Global, acute in APAC | Short term (≤ 2 years) |
| Privacy backlash against ubiquitous sensing | -0.5% | EU & North America | Long term (≥ 4 years) |
| Calibration drift in multi-axis IMUs | -0.4% | Global precision-critical use cases | Medium term (2-4 years) |
| Source: Mordor Intelligence | |||
High Cost of Advanced MEMS Alternatives
Photonic and quantum-scale motion sensors promise ten-fold precision gains but remain several cost curves away from high-volume deployment. Packaging complexity and lack of common test standards inflate per-unit pricing, deterring adoption in commodity smart-lighting and budget appliance lines. Research groups are pursuing machine-learning-based calibration schemes that reduce production tuning steps to under 10 seconds while maintaining accuracy. Widespread commercialization, however, depends on shared manufacturing infrastructure that can amortize capital outlays across multiple sensor families.
Semiconductor Supply-Chain Bottlenecks
The United States still relies on offshore fabrication for complementary metal–oxide–semiconductor (CMOS) image sensors used in automotive and security cameras, exposing OEMs to geopolitical risk. Policy measures such as the CHIPS for America Act and the European Chips Act aim to localize lithography and packaging, yet greenfield fabs typically take three to five years to reach volume. Just-in-time inventories prevalent in automotive manufacturing magnify the impact of any wafer shortage, forcing OEMs to redesign platforms around more readily available sensor combinations.
*Our forecasts treat driver/restraint impacts as directional, not additive. The impact forecasts reflect baseline growth, mix effects, and variable interactions.
Segment Analysis
By Technology: Infrared Stability, Radar Upswing
Passive infrared devices held 35.10% share of the motion sensor market size in 2025 due to low cost and proven reliability in lighting automation. Adoption of radar-based tomographic systems is growing at a 5.42% CAGR because millimeter-wave chips offer material penetration and object-classification advantages needed for advanced automotive safety.
Infrared shipments remain high for budget security installations, but multi-technology nodes that blend radar with PIR are emerging in premium residential kits. Laboratories are also refining segmented thermal calibration for MEMS gyroscopes, trimming drift across temperature swings and thereby widening usable ranges for high-end robotics. Photonic interference sensors under early trial could eventually disrupt both radar and infrared if packaging barriers fall.


By Functionality Level: Automation Preference
Fully automatic systems commanded 55.70% share in 2025, reflecting buyer preference for “install-and-forget” devices that optimize lighting, HVAC, or driver assistance without human input. The segment’s 4.95% CAGR rests on expanding smart-building retrofits where self-learning algorithms reduce commissioning labor.
Semi-automatic designs endure in industrial lines requiring manual overrides, yet the gradual rollout of AI-enabled auto-calibration trims their configuration time. Edge inference engines now embedded in sensors shrink latency from hundreds of milliseconds to single-digit milliseconds, meeting stricter safety thresholds for collaborative robots on factory floors.
By Embedded Sensor Type: IMU Consolidation
Combo inertial measurement units account for 33.85% share of the motion sensor market and are growing at 4.72% CAGR as designers consolidate accelerometers, gyroscopes, and magnetometers to cut board area. Stand-alone accelerometers and gyros continue in ultra-cost-sensitive toys and appliances, yet sophisticated wearables now depend on fused, nine-axis devices to improve gesture resolution.
Academic work on joint magnetometer-IMU calibration reduces heading error by applying maximum a-posteriori algorithms that run on microcontrollers, yielding high precision without cloud aid. Remaining challenges include long-term bias drift, which demands periodic field calibration or adaptive filtering.
By Application: Consumer Electronics Lead, Smart Homes Accelerate
Consumer electronics maintained 41.65% share of the motion sensor market in 2025, spanning smartphones, tablets, and game controllers. Growth remains solid yet incremental as penetration nears saturation. Smart-home and building automation, by contrast, advances at 6.88% CAGR, underpinned by energy codes and corporate decarbonization targets that reward sensor-based occupancy management.
Healthcare monitors benefit from progress in micro-flow sensing, allowing wearable patches to capture joint angles and acceleration for remote rehabilitation programs. Security integrators increasingly bundle motion detection with AI video analytics to cut nuisance alarms, opening a mid-tier channel between entry-level DIY kits and enterprise surveillance suites.
Geography Analysis
Asia-Pacific generated 36.95% of motion sensor market revenue in 2025, enabled by dense electronics supply chains in China, Japan, and South Korea. Local fabs specialize in bulk CMOS and wafer-level chip-scale packaging, allowing regional OEMs to launch new sensor-rich mobile devices on compressed timelines. Regulatory pushes for advanced driver assistance systems in Japan and South Korea further reinforce baseline demand.
North America and Europe remain technology pace-setters rather than high-volume production centers. The U.S. New Car Assessment Program revisions obligate automakers to integrate blind-spot detection, lane-keeping, and pedestrian braking, guaranteeing a multi-year uplift for inertial combos and radar subsystems. Europe’s General Safety Regulation II places similar requirements on new car models sold from mid-2024 onward, synchronizing demand across both mature markets.
The Middle East & Africa, though only a modest share contributor today, is projected to grow at 5.04% annually to 2031 as Gulf smart-city budgets prioritize intelligent lighting, security, and traffic-monitoring infrastructure. Broad-spectrum motion sensors suited to harsh desert climates gain traction in large-scale perimeter security installations and rapid-transit projects. Local assembly partnerships help circumvent import tariffs and align with regional content rules.

Value Chain Analysis
The motion sensor value chain covers upstream materials and wafer inputs (silicon wafers, specialty gases/chemicals, and packaging substrates), front-end fabrication (MEMS and mixed-signal CMOS processing), and back-end assembly and test (including wafer-level packaging and module integration). Downstream, sensors are distributed to OEMs and system integrators for consumer electronics, automotive and transportation safety, building automation, and industrial robotics. The OECD’s 2025 mapping of the semiconductor value chain highlights concentrated chokepoints in critical inputs and regionally specialized manufacturing, which directly impacts motion sensors where qualification cycles and multi-sourcing are constrained by process-node, packaging, and test capability availability.
Midstream participants increasingly pair sensing elements with on-module processing and software hooks to reduce system-level compute and simplify customer integration. As examples, Asahi Kasei Microdevices began mass production of the AK5816AIM antenna-in-module millimeter-wave radar module in July 2026 for camera-less activity and presence sensing. STMicroelectronics introduced its VL53L9 direct Time-of-Flight 3D LiDAR module, with mass production initiated in July 2026, targeting robotics and edge-AI use cases. On the channel side, design wins are often driven by reference designs and ecosystem partnerships with OEM engineering teams, while constraints continue to concentrate around packaging capacity, calibration and test throughput for multi-axis devices, and exposure of certain refining steps to geopolitical risk.
Competitive Landscape
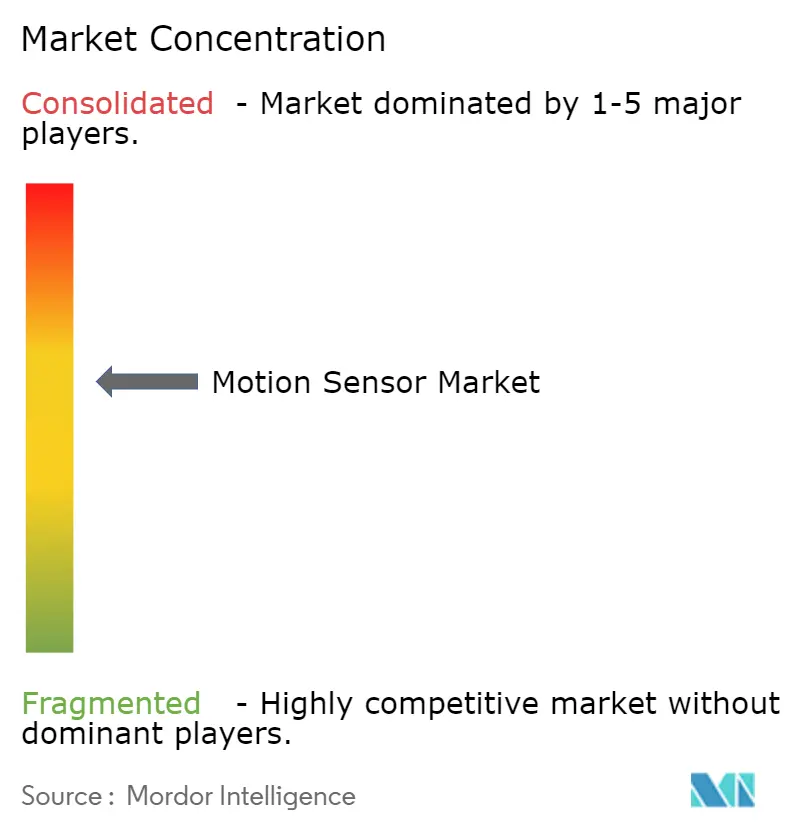
The motion sensor market displays moderate concentration. Tier-one semiconductor houses integrate design, wafer processing, and software toolchains, enabling them to bundle inertial combos with power management and wireless subsystems for smart-edge nodes. Sony’s expansion into edge AI vision, Analog Devices’ condition-monitoring suite, and Infineon’s automotive safety focus exemplify diversified strategic bets.
Smaller innovators target photonic gyroscopes and quantum tunneling accelerometers, but high capital intensity and lengthy qualification cycles limit their immediate competitive threat. Collaboration models such as SEMI’s MEMS & Sensors Executive Congress foster co-development of packaging standards that shorten time-to-revenue for niche suppliers.
Strategic alliances between sensor vendors and AI accelerator startups accelerate feature integration at the edge, allowing incumbents to upsell value-added firmware updates. Privacy-preserving designs are emerging as a new differentiation axis, particularly for European enterprise customers who must comply with the General Data Protection Regulation. Supply-chain relocation incentives in the United States and Europe could re-rank leaders if onshore capacity lags demand spikes.
Motion Sensor Industry Leaders
Murata Manufacturing Co. Ltd
Analog Devices Inc
NXP Semiconductor NV
TDK Corporation
Bosch Sensortec GmbH
- *Disclaimer: Major Players sorted in no particular order

Market Opportunities and Future Outlook
The clearest opportunity is in higher-value motion sensing that combines multiple modalities (inertial, radar, time-of-flight) with edge intelligence. This can shorten commissioning timelines and support sensor-fusion-driven functions in robotics, building automation, and industrial monitoring. NIST’s 2026 roadmap on AI and machine learning for smart manufacturing also elevates heterogeneous sensing and control integration as a barrier area, which in turn increases demand for motion sensors that include embedded diagnostics, synchronization, and interfaces that fit modern industrial architectures. For suppliers, whitespace is strongest where customers need privacy-preserving presence detection beyond basic on-off PIR, and where system designers want fewer discrete components by consolidating motion sensing, compute, and security primitives closer to the node.
In premium inertial segments, new capacity and industrialization programs expand the addressable supply base for higher-precision gyroscopes used in navigation and stabilization-heavy platforms. Safran Electronics & Defense announced a EUR 120 million investment in June 2026 to expand its Montlucon facility in France, adding cleanroom space and scaling hemispherical resonator gyroscope output over time, which indicates ongoing investment in high-end motion sensing manufacturing. Separately, automotive and robotics sensing stacks are adding additional perception layers, and Hesai’s January 2026 plan to raise lidar production capacity in 2026 reinforces momentum around multi-sensor platforms where motion sensing and perception are designed together for localization, safety, and autonomy.
Recent Industry Developments
- July 2026: Analog Devices completed the acquisition of Empower Semiconductor to strengthen its high-density power management capabilities. Power integrity and efficiency are becoming more tightly linked to high-performance sensing and edge compute, supporting ADI’s ability to deliver more integrated sensor-to-system platforms for AI-driven endpoints.
- May 2026: Murata Manufacturing announced the SCH1633-D05, a high-performance 6-axis IMU positioned for AD/ADAS ECU integration, with mass production scheduled for June 2026. The release supports higher-content inertial sensing in automotive platforms where performance and qualification requirements favor established suppliers.
- April 2026: Murata Manufacturing commenced mass production of the MRMS166R and MRMS168R AMR sensors for healthcare and wearable IoT applications. By moving these AMR devices into volume production, Murata expands its motion and magnetic sensing portfolio for compact, low-power designs that rely on sensor fusion.


Research Methodology Framework and Report Scope
Market Definition and Coverage
For this study, the market covers revenues generated from motion-sensor devices that detect movement in people or objects, whether they are sold as standalone parts or embedded inside systems across end-use equipment.
Scope exclusions: We exclude camera-only imaging modules that do not have motion-specific sensing functionality.
Segmentation Overview
- By Technology
- Ultrasonic
- Microwave
- Infrared (PIR)
- Dual/Hybrid
- Radar/Tomographic
- By Functionality Level
- Fully Automatic
- Semi-Automatic
- By Embedded Sensor Type
- Accelerometer
- Gyroscope
- Magnetometer
- Combo/IMU (6-axis, 9-axis)
- Pressure/Barometric
- By Application
- Consumer Electronics
- Automotive and Transportation
- Healthcare and Medical Devices
- Security and Surveillance
- Lighting Controls
- Smart Home and Building Automation
- Industrial and Robotics
- Gaming and Entertainment
- Other Applications
- By Geography
- North America
- United States
- Canada
- Mexico
- South America
- Brazil
- Argentina
- Rest of South America
- Europe
- Germany
- France
- United Kingdom
- Italy
- Spain
- Russia
- Rest of Europe
- Asia-Pacific
- China
- Japan
- South Korea
- India
- South East Asia
- Rest of Asia-Pacific
- Middle East and Africa
- GCC
- Turkey
- South Africa
- Rest of Middle East and Africa
- North America
Data Sources, Market Sizing, and Validation
Desk Research
Desk research started with mapping how motion sensors are built and shipped across electronics value chains, then aligning that with demand signals from large end markets. We leaned on public sources such as U.S. Census Bureau trade statistics, UN Comtrade trade tables, Eurostat industrial and trade series, and standards and guidance from bodies such as IEC and ISO that clarify what gets counted as a sensor versus a system.
To keep assumptions practical, we also reviewed patent databases to understand technology direction and where ASP pressure could show up, peer-reviewed journals covering PIR, microwave, and MEMS inertial sensing, and reported indicators from smart building and automotive safety domains. Company filings, investor presentations, and credible press were used to cross-check shipment commentary and pricing changes, and a paid subscription for company financials and intelligence supported revenue sanity checks where disclosures were limited. These sources are illustrative, and many other references were also used for data collection, validation, and clarification.
Primary Interviews and Surveys
Primary inputs came from interviews and short surveys with sensor ecosystem participants, including component suppliers, device makers, distributors, and system integrators, followed by discussions with buyers in automotive, consumer electronics, and building automation. Because the market is global, we covered major demand regions and used the conversations to validate pricing logic, adoption timing, and which adjacent products should stay out of scope.
Distribution of primary research fieldwork respondents
| Company type | Respondent position | Region |
|---|---|---|
| Top tier: 25% | CXOs: 13% | APAC: 48% |
| Mid tier: 60% | Functional/Unit leaders: 27% | EMEA: 29% |
| Smaller Players: 15% | Managers: 60% | Americas: 23% |
Market-Sizing & Forecasting
Sizing combined a top-down build that reconstructs demand from electronics production and trade signals, and then allocates that pool into motion-sensing use cases based on adoption rates shared by industry experts. To keep totals realistic, we corroborated results with selective bottom-up approximations such as sampled average selling price (ASP) times volume for key sensor families, plus channel checks on shipment direction.
Key model inputs included ASP progression by sensor type (PIR, microwave, ultrasonic, and MEMS inertial), penetration of motion sensing in smart lighting and building automation, vehicle safety feature fitment trends, consumer electronics shipment cycles, and replacement rates where sensors are commonly swapped during device refresh. When bottom-up detail was not available in certain regions or applications, gaps were handled through proxy ratios tied to import or export mixes and confirmed through interviews. Forecasting was run using scenario analysis, where the base case reflects consensus views on pricing erosion, adoption speed, and macro demand, and alternative cases test faster smart-home uptake or slower industrial spending.
Data Validation & Update Cycle
Outputs were checked through multiple steps, including variance checks against related electronics indicators, region-level reasonableness tests, and internal analyst review before sign-off. When a number looked unusual, we revisited the assumptions, rechecked currency conversions, and re-contacted respondents if the variance could not be explained by a clear demand or pricing driver.
The report is refreshed annually, and interim updates are triggered when major events materially affect shipments, ASPs, or demand timing. Before delivery, a final pass is completed so clients receive the latest updated view for the current market environment.
Mordor Intelligence's Motion Sensor Market Size Compared With Other Published Estimates
Published market sizes for motion sensors often differ because the counted product boundaries and pricing assumptions are not the same, and the update timing can shift the same demand into different years. It is also common to see mixed treatment of embedded sensing versus system-level modules, which changes what gets included in revenue totals.
In practice, the spread usually comes from how quickly ASP declines are refreshed, what currency timing is used for conversions, and whether interview checks confirm shipment direction during electronics cycle changes. This is why the refresh-led approach used here, including quarterly currency normalization and re-validation of ASP curves, is followed by Mordor Intelligence.
Benchmark comparison
| Source | Market Size | Gaps in Research Methodology |
|---|---|---|
| Mordor Intelligence | USD 2.69 B (2026) | |
| Trade Publisher A | USD 7.38 B (2024) | Uses an earlier base year and appears to include a broader sensor set across motion and related detection functions, which can pull in adjacent devices and lift totals. The higher growth rate also suggests faster ASP and adoption assumptions that may not be re-checked region by region. |
| Industry Platform B | USD 5.78 B (2023) | Starts from a different forecast window and may aggregate motion sensing at a more system-driven level, where module revenues and bundled sensing content can be counted together. Currency timing and pricing erosion are not transparent, which can shift the value outcome. |
The table shows that year selection and what gets counted as a motion sensor versus an adjacent module are the main reasons the values separate. By keeping the scope tied to motion-specific sensing revenue and by keeping pricing and currency assumptions on a consistent refresh cycle, we present a traceable market value that clients can replicate and stress-test with a few clear inputs.


Key Questions Answered in the Report
What is the current size of the motion sensor market?
The motion sensor market stands at USD 2.69 billion in 2026 and is projected to reach USD 3.36 billion by 2031.
Which application segment is growing the fastest?
Smart-home and building automation is expanding at a 6.88% CAGR, outpacing traditional consumer electronics demand.
Why are Combo/IMU sensors gaining share?
They integrate multiple axes of motion detection in one package, reducing board size and enabling advanced sensor-fusion features that designers need for wearables and ADAS.
How do new automotive safety rules affect demand?
US and EU regulations make features like blind-spot detection and driver-state monitoring compulsory, ensuring steady multi-year orders for inertial and radar sensors.
What are the main obstacles to faster market growth?
High costs of next-generation MEMS, supply-chain fragility in advanced wafer nodes, and privacy concerns surrounding ubiquitous sensing temper adoption rates.
Which region leads the motion sensor market?
Asia-Pacific holds the largest regional share at 36.95%, supported by dense electronics manufacturing ecosystems and expanding electric-vehicle production.
Page last updated on:






