
Monoclonal Antibodies Market Size and Share
Market Overview
| Study Period | 2020 - 2031 |
|---|---|
| Market Size (2026) | USD 323.89 Billion |
| Market Size (2031) | USD 596.12 Billion |
| Growth Rate (2026 - 2031) | 12.99 % |
| Fastest Growing Market | Asia Pacific |
| Largest Market | North America |
| Market Concentration | Medium |
Major Players *Disclaimer: Major Players sorted in no particular order Image © Mordor Intelligence. Reuse requires attribution under CC BY 4.0. | |
Monoclonal Antibodies Market Analysis by Mordor Intelligence
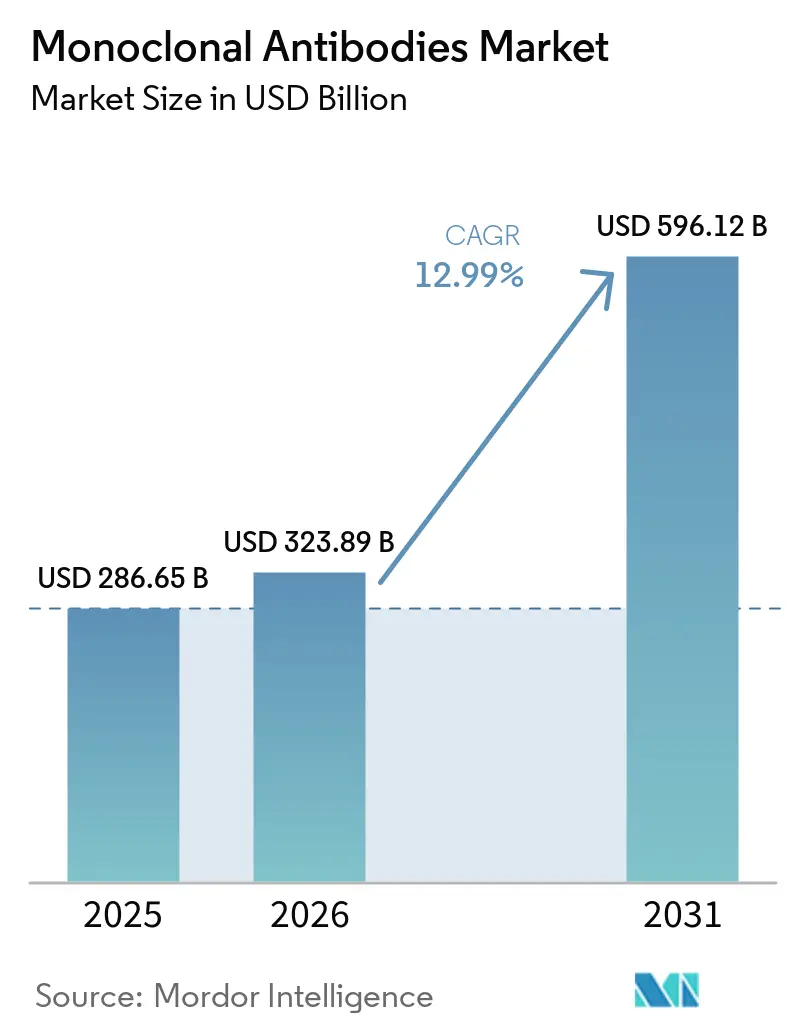
The Monoclonal Antibodies Market size was valued at USD 286.65 billion in 2025 and estimated to grow from USD 323.89 billion in 2026 to reach USD 596.12 billion by 2031, at a CAGR of 12.99% during the forecast period (2026-2031).
Growth reflects the transition of antibody therapeutics from niche biologics to first-line interventions across oncology, autoimmune disorders, and infectious-disease prevention. Catalysts include rapid-fire antibody-engineering platforms, faster regulatory reviews for breakthrough indications, and government pandemic-preparedness outlays that commit USD 79.5 billion to medical countermeasures through 2027. Contract development and manufacturing organizations (CDMOs) now anchor the supply base, with Samsung Biologics booking more than USD 3.3 billion in new contracts during 2024 and WuXi Biologics carrying a USD 20.6 billion backlog, underscoring structural demand. The geographic tilt toward Asia-Pacific capacity, expected to represent 45% of new volume additions by 2028, heightens supply-chain concentration risks while simultaneously lowering unit costs.
Key Report Takeaways
- By production method, in vitro systems accounted for 54.68% of the global monoclonal antibodies market share in 2025; this segment is projected to expand at a 13.95% CAGR through 2031.
- By source, human-derived antibodies led with a 59.02% revenue share in 2025, while humanized variants are poised for the fastest growth, with an 18.02% CAGR to 2031.
- By indication, oncology accounted for 49.35% of 2025 revenue, whereas autoimmune diseases are forecast to post the strongest 19.22% CAGR to 2031.
- By end user, hospitals captured 39.22% of demand in 2025; specialty and ambulatory centers represent the highest-growth channel, with a 15.98% CAGR toward 2031.
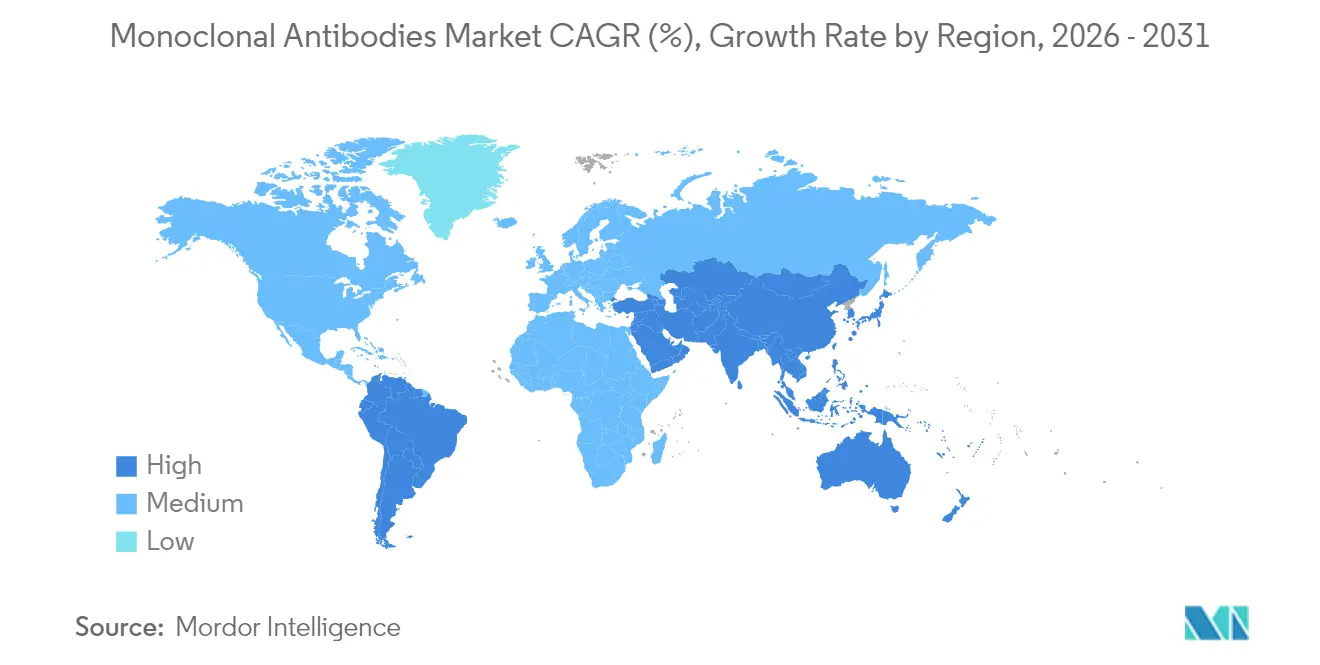
- By geography, North America captured 40.62% of the global monoclonal antibodies market share in 2025; Asia-Pacific region represents the highest growth at 13.11% CAGR toward 2031.
Note: Market size and forecast figures in this report are generated using Mordor Intelligence’s proprietary estimation framework, updated with the latest available data and insights as of 2026.
Market Trends and Insights
Drivers Impact Analysis of Monoclonal Antibodies Market*
| Driver | (~) % Impact on CAGR Forecast | Geographic Relevance | Impact Timeline |
|---|---|---|---|
| Rising Technological Advancements in Antibody‐Engineering Platforms | +2.8% | Global, with concentration in North America & Europe | Medium term (2-4 years) |
| Escalating Global Cancer & Chronic-Disease Incidence | +3.2% | Global, with highest impact in aging populations of North America, Europe, and Asia-Pacific | Long term (≥ 4 years) |
| Expanding Government & VC Funding for mAb R&D | +2.1% | North America & Europe primarily, expanding to Asia-Pacific | Short term (≤ 2 years) |
| AI-Driven De-Novo Antibody Design Accelerates Discovery Cycles | +1.9% | Global, led by North America and Europe | Medium term (2-4 years) |
| Demand For Highly Potent Single-Use ADC Bioreactors | +1.7% | Global, with manufacturing concentration in Asia-Pacific | Short term (≤ 2 years) |
| Pandemic-Preparedness Stockpiling Initiatives | +1.6% | North America, Europe, with emerging programs in Asia-Pacific | Short term (≤ 2 years) |
| Source: Mordor Intelligence | |||
Rising Technological Advancements in Antibody-Engineering Platforms
High-throughput microfluidics and single-B-cell screening have condensed discovery cycles from months to weeks, enabling developers to locate rare, high-affinity clones with precision. Samsung Biologics’ 2024 launch of the S-HiCon platform allows liquid formulations exceeding 200 mg/mL, resolving viscosity and stability barriers for subcutaneous delivery.[1] Site-specific conjugation techniques now dominate antibody-drug conjugate (ADC) pipelines, cutting batch variability and smoothing regulatory reviews; 14 bispecific antibodies already hold global approvals as of 2024. These scalable, standardized toolkits shift negotiating leverage to CDMOs that can amortize platform investments over multiple programs, tilting competitive advantage toward large-scale manufacturers.
Escalating Global Cancer & Chronic-Disease Incidence
Projected 77% growth in worldwide cancer cases by 2050 and surging autoimmune diagnoses keep therapeutic demand robust.[2] Checkpoint inhibitors illustrate convergence: mechanistic insights gained in oncology are migrating into autoimmune protocols, shrinking development timelines and enlarging patient pools. Monoclonal antibodies serve dual roles—as independent biologics and as precision payload carriers in ADCs—reinforcing their indispensability across disease clusters. Demographic aging in North America, Europe, and Asia-Pacific further raises prevalence, ensuring sustained therapy volumes.
Expanding Government & VC Funding for mAb R&D
U.S. government programs are directing major funding toward the development of next-generation COVID-19 antibodies, with broader public health initiatives also receiving long-term financial support.[3] Canada’s Health Emergency Readiness Canada initiative bolsters domestic capacity for pandemic countermeasures. Venture capital increasingly pools around platform plays; Samsung Life Science Fund II targets AI-enabled antibody discovery startups. Government de-risking frees private capital to underwrite later-stage trials, compressing the journey from benchtop to bedside.
AI-Driven De-Novo Antibody Design Accelerates Discovery Cycles
Machine-learning models now predict epitope binding and structural stability, trimming early discovery timelines by up to 70%. AbbVie’s USD 355 million alliance with BigHat Biosciences and Sanofi’s USD 1 billion collaboration with BioMap spotlight big-pharma appetite for computational biology. AI optimizes sequences for manufacturability, resistance to viral escape, and lowered immunogenicity, elevating the probability of clinical success. Democratized cloud-based platforms also equip smaller biotechs to compete at the ideation stage, reshaping traditional size-based moats.
Restraints Impact Analysis of Monoclonal Antibodies Market*
| Restraint | (~) % Impact on CAGR Forecast | Geographic Relevance | Impact Timeline |
|---|---|---|---|
| High Therapy & Manufacturing Costs | -2.9% | Global, with highest impact in price-sensitive emerging markets | Long term (≥ 4 years) |
| Patent Expiries & Biosimilar Pricing Pressure | -2.1% | North America & Europe primarily, expanding globally | Medium term (2-4 years) |
| Biomanufacturing-Capacity Crunch Vs. Cell-&-Gene Therapies | -1.8% | Global, with acute constraints in North America and Europe | Short term (≤ 2 years) |
| HTA Reimbursement Push-Back on Real-World Cost-Effectiveness | -1.7% | Europe, North America, with emerging pressure in Asia-Pacific | Medium term (2-4 years) |
| Source: Mordor Intelligence | |||
High Therapy & Manufacturing Costs
Median launch prices for specialty biologics reached USD 300,000 per course in 2024, straining payer budgets. Cost-effectiveness studies indicate eculizumab requires a 93% discount to meet QALY thresholds, underscoring affordability gaps. Complex ADC containment, extensive QC protocols, and Protein A resin expenses sustain high cost bases despite single-use bioreactor adoption. Although rituximab biosimilars generated annual savings of USD 208,553 in Chile, uptake lags in the United States, muting price-compression benefits.
Patent Expiries & Biosimilar Pricing Pressure
Blockbusters such as Stelara and Prolia/Xgeva are losing exclusivity, while Keytruda faces biosimilar entry risk by 2028. The adalimumab saga shows originators can retain 97% volume share via aggressive contracting even after 10 biosimilar launches. Oncology biosimilars encounter steeper regulatory and manufacturing hurdles, potentially capping discount depth versus simpler molecules. Nonetheless, pharmacy benefit managers are experimenting with value-based contracts that could accelerate switching once post-approval supply stabilizes.
*Our forecasts treat driver/restraint impacts as directional, not additive. The impact forecasts reflect baseline growth, mix effects, and variable interactions.
Monoclonal Antibodies Market Segment Analysis
By Production Method:
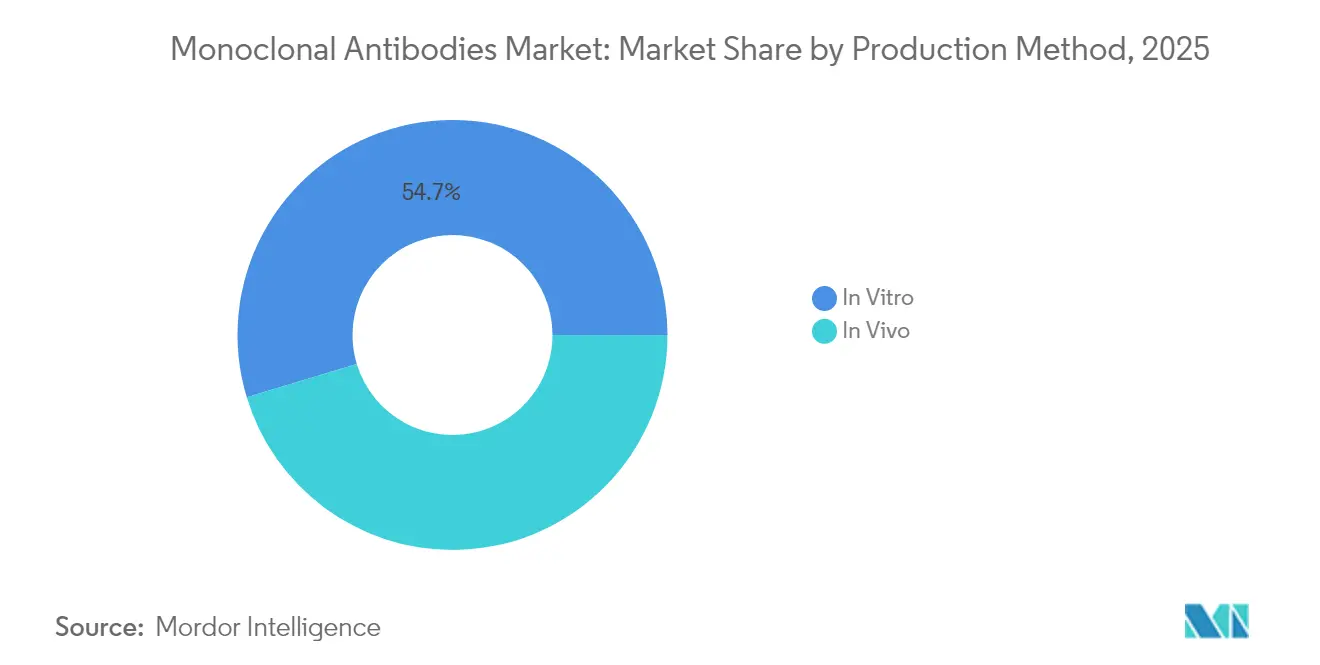
In Vitro Platforms Sustain Scalable LeadershipIn Vitro systems controlled 54.68% of the monoclonal antibodies market in 2025 and are set to advance at a 13.95% CAGR through 2031. This segment’s productivity edge underpins 2025 revenue dominance as Chinese hamster ovary cell lines push titers above 11.5 g/L, tripling fed-batch output. Continuous perfusion and multicolumn chromatography lower Protein A resin use by 40%, shaving raw-material costs while boosting recovery to 87%. The monoclonal antibodies market size for In Vitro platforms is forecast to widen in lockstep with CDMO capacity rollouts across South Korea and China.
Viral-vector or glycoengineered In Vivo methods now occupy niche applications requiring exotic post-translational patterns. As single-use benchtop systems proliferate, smaller biotech firms gain capital-light manufacturing access, reinforcing the monoclonal antibodies market’s outsourcing narrative. CDMOs integrating continuous upstream and downstream flows can pivot capacity between standard IgG and complex ADC runs without extensive retrofits, a flexibility premium that attracts pipeline-heavy sponsors.

By Source:
Humanized Engineering Drives Fastest UpswingHuman antibodies maintained 59.02% revenue share in 2025, yet humanized constructs are accelerating at an 18.02% CAGR on the strength of better immunogenicity profiles. Phage display, yeast display, and transgenic mouse platforms converge to produce quasi-germline sequences that evade anti-drug antibodies, critical for chronic dosing regimens. The monoclonal antibodies market share leadership remains with fully human assets, but the monoclonal antibodies market size attributable to humanized variants is projected to climb sharply alongside autoimmune pipeline expansions.
Computational epitope screening now flags immunogenic hot spots before IND filing, shortening iterative redesign cycles. Chimeric formats persist where speed outweighs tolerability, particularly in late-stage oncology trials. However, third-generation transgenic mice capable of producing diversified human heavy and light chains promise to close the gap, challenging humanized constructs for future mindshare.
By Indication:
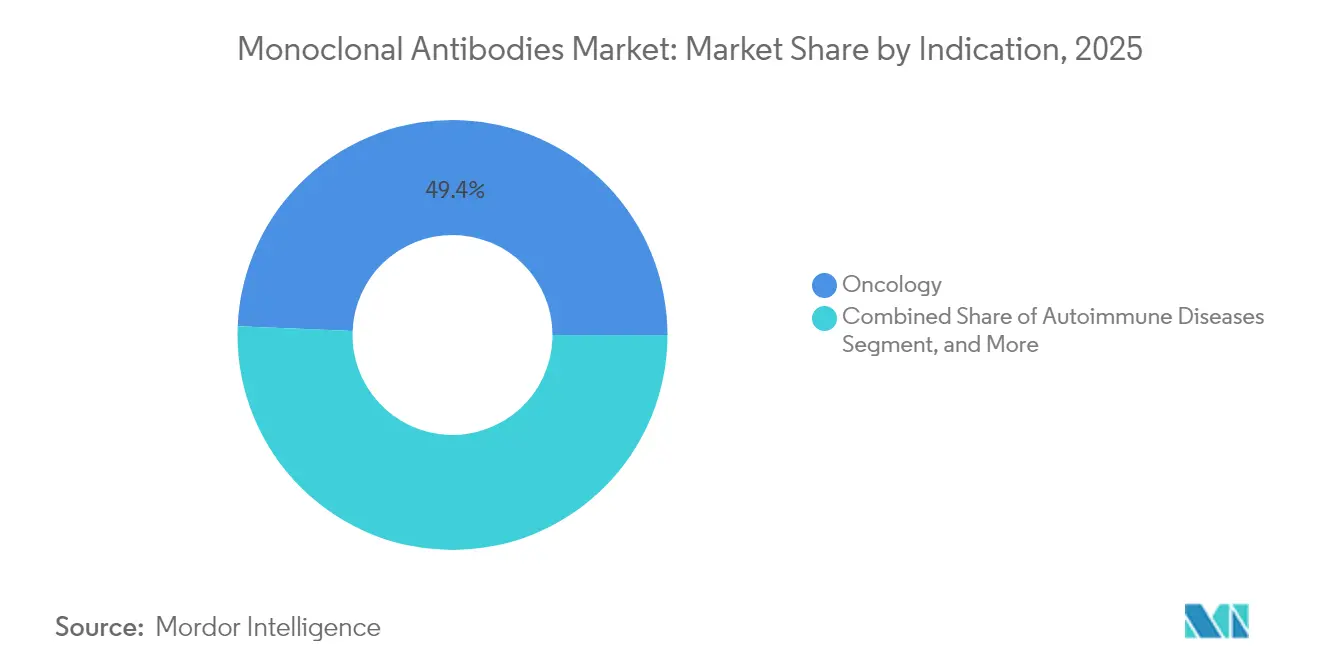
Autoimmune Diseases Become Next Growth FrontierOncology supplied 49.35% of 2025 revenue, yet autoimmune disorders are forecast to compound at 19.22% annually to 2031 as earlier diagnosis, biomarker stratification, and innovative B-cell depletion schemes widen eligible cohorts. Infectious-disease antibodies such as RSV-targeting nirsevimab and clesrovimab illustrate expanding prophylactic roles; nirsevimab cut RSV-related hospitalization by 90% in real-world assessments.
Within the cancer monoclonal antibodies market, ADCs and bispecifics refresh revenue streams as single-target IgG competitors confront biosimilar erosion. Cross-indication translational learning accelerates asset recycling: mechanisms initially successful in oncology migrate into rheumatoid arthritis and systemic lupus pipelines, compressing development chronologies and enriching return profiles.
By End User:
Specialty & Ambulatory Centers Capture Administration ShiftHospitals generated 39.22% of 2025 consumption, yet specialty centers are progressing at a 15.98% CAGR through 2031. Subcutaneous reformulations like Roche’s Tecentriq Hybrenza trim chair time to seven minutes, aligning with outpatient throughput imperatives. Phesgo’s European cost-minimization analyses report up to 80% savings versus IV infusions, strengthening payer support for migration. The monoclonal antibodies market size flowing through non-hospital channels therefore expands in tandem with high-concentration formulations and digital adherence tools.
Retail clinics and physician-office infusion suites benefit from biosimilar cost deflation, offering multi-source panels that raise scheduling flexibility. Remote-monitoring platforms deliver real-time adverse-event detection, allowing at-home administration in selected populations, a paradigm likely to amplify as payers pursue site-of-care optimization.
Geography Analysis
North America Monoclonal Antibodies Market
North America controlled 40.62% of 2025 revenue, underpinned by dense innovation hubs, generous insurance coverage, and a supportive regulatory highway for expedited designations. The region’s multi-year PHEMCE appropriation guarantees baseline demand for antibody countermeasures, while Canada’s Health Emergency Readiness program adds domestic surge capacity. Yet exclusivity cliffs for Stelara and Prolia/Xgeva foreshadow intensifying biosimilar jockeying, prompting a pivot toward value-based contracts and real-world evidence requirements. Health-technology assessment scrutiny already influences formulary adoption, nudging manufacturers toward differential pricing.
APAC Monoclonal Antibodies Market
Asia-Pacific is the fastest climber at a projected 13.11% CAGR. Capacity supremacy is decisive: Samsung Biologics will bring total volume to 784 kL by April 2025, and WuXi Biologics’ USD 20.6 billion backlog testifies to global sponsor reliance. Policymakers in China, South Korea, and Singapore bundle tax incentives with expedited GMP clearances, luring pipeline assets from Western biotech firms. However, overdependence on regional factories presents geopolitical and logistics fragility, spurring conversations about dual-sourcing and near-shoring strategies in North America and Europe.
EMEA and LATAM Monoclonal Antibodies Market
Europe remains an innovation heavyweight thanks to entrenched pharmaceutical clusters and sophisticated regulators. Biosimilar adoption rates outpace the United States, sharpening price competition but also validating pathway predictability. Subcutaneous delivery innovation resonates with the region’s cost-containment ethos; Roche’s Phesgo adoption data show 91% of surveyed patients preferring home administration, bolstering pay-for-performance schemes. Emerging markets in Latin America, the Middle East, and Africa contribute incremental volumes as national immunization and oncology programs mature, although reimbursement constraints cap near-term penetration.
Mordor Intelligence provides coverage of the monoclonal antibodies market across other key regional markets, including Europe, each with their regulatory frameworks and demand patterns.
Regulatory Landscape
In the United States, the FDA issued a December 2025 draft guidance, Monoclonal Antibodies: Streamlined Nonclinical Safety Studies, setting out how certain nonclinical programs can be streamlined using a weight-of-evidence approach. That framing is likely to affect development timelines and cost structures for both originators and biosimilars. In Europe, the European Commission implemented updated Variations Guidelines applicable from 15 January 2026, aligning with the revised Variations Regulation (EU 2024/1701) and increasing the emphasis on robust post-approval change strategies for mAb manufacturers.
Product-level CHMP actions in 2026 show both opportunities and risks in filings and lifecycle management, including a positive opinion for a Keytruda (pembrolizumab) variation (21 May 2026) and a CHMP recommendation to refuse marketing authorization for Yartemlea (narsoplimab) (25 June 2026). Internationally, WHO discussions at the 82nd Expert Committee on Biological Standardization (April 2026) support further convergence on biological quality standards and test modernization, which is relevant for global supply chains serving multiple regulators.
Competitive Landscape
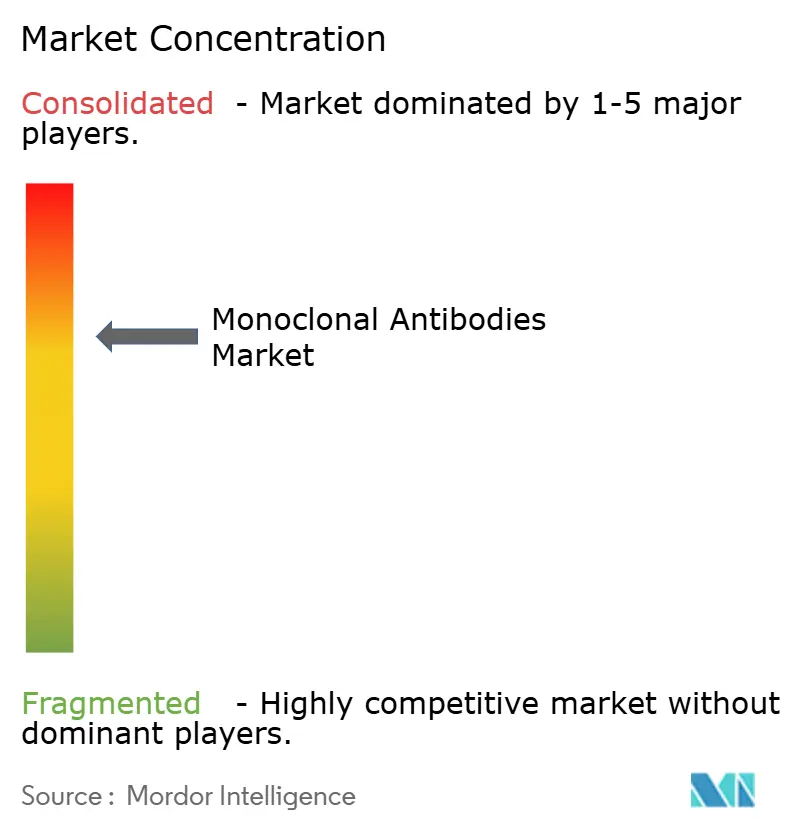
Competition in the monoclonal antibodies market is characterized by moderate consolidation: top players integrate discovery platforms, clinical portfolios, and industrial-scale manufacturing. Roche, AbbVie, and Johnson & Johnson continue to lead the monoclonal antibody market through strategic lifecycle management, exemplified by AbbVie’s transition from Humira to newer therapies, such as Skyrizi and Rinvoq. Patent cliffs inject volatility, compelling incumbents to invest in bispecifics, ADCs, and long-acting formulations that differentiate beyond mere target affinity.
CDMOs, such as Samsung Biologics, WuXi Biologics, and Lonza, supply more than 50% of outsourced capacity, granting them significant strategic leverage. Their willingness to co-invest in client pipelines accelerates asset timelines and spreads risk, converting them into quasi-strategic partners rather than transactional vendors. AI alliances redefine borders: AbbVie–BigHat and Sanofi–BioMap collaborations target computational design frameworks capable of generating drug-like antibodies at scale. The RSV space highlights emerging white space; Merck’s clesrovimab complements Sanofi/AstraZeneca’s nirsevimab, opening up multi-billion-dollar pediatric franchises.
Disruptors focus on multi-specific constructs, gene-encoded antibodies, and non-traditional delivery routes such as inhaled formulations. Larger firms counter with targeted acquisitions; Roche’s acquisition of Poseida Therapeutics for its cell-therapy expertise represents a defensive play to secure next-generation technologies. Market entry barriers remain high, given the scale economics of GMP biologics and the steep capital demands for process validation; yet, democratized AI design tools and modular single-use plants modestly lower the hurdles for venture-backed challengers.
Monoclonal Antibodies Industry Leaders
-
Eli Lilly and Company
-
Amgen Inc.
-
Novartis AG
-
Merck & Co., Inc.
-
F. Hoffmann-La Roche Ltd.
- *Disclaimer: Major Players sorted in no particular order
Monoclonal Antibodies Market Companies Covered in this Report
- Abbvie
- Amgen
- AstraZeneca
- BeiGene Ltd.
- Bristol-Myers Squibb
- Eli Lilly and Company
- Roche
- GlaxoSmithKline
- Johnson & Johnson
- Merck
- Novartis
- Pfizer
- Regeneron Pharmaceuticals
- Sanofi
- Seagen
- Samsung Bioepis Co. Ltd.
- Sinopharm Group Co. Ltd.
- Thermo Fisher Scientific
- Wuxi Biologics
- Zai Lab Ltd.
Market Opportunities and Future Outlook
Manufacturing localization and capacity buildouts are creating identifiable whitespace in global mAb supply, alongside a path for sponsors to de-risk sourcing outside traditional capacity clusters. In March 2026, Samsung Biologics completed the acquisition of GSK's manufacturing facility in Rockville, Maryland, adding 60,000 liters of drug substance capacity and establishing a US manufacturing presence. Celltrion also announced a 1.23 trillion won (about USD 820 million) investment to build two new plants in Songdo, Incheon, adding 180,000 liters, plus an expansion at its Branchburg, New Jersey site from 66,000 to 75,000 liters.
In April 2026, AGC Biologics commenced development of a new USD 350 million site in Yokohama, Japan, focused on mammalian cell culture. The project reinforces the shift toward regional redundancy and multi-asset biologics capacity that can support both branded mAbs and biosimilars.
Recent Industry Developments in Monoclonal Antibodies Market
- June 2026: Samsung Biologics completed the acquisition of GSK's Rockville, Maryland manufacturing facility, adding 60,000 liters of drug substance capacity and establishing a US manufacturing presence. The move expands global supply capacity and diversifies regional risk for monoclonal antibody production.
- June 2026: AGC Biologics commenced development of a new USD 350 million site in Yokohama, Japan, focused on mammalian cell culture. This project enhances regional redundancy and multi-asset capacity to serve branded mAbs and biosimilars.
- February 2026: EMA CHMP issued a positive opinion for clesrovimab for prevention of RSV lower respiratory tract disease in neonates and infants. This signals continued regulatory momentum for pediatric and infectious disease monoclonal antibodies.
Monoclonal Antibodies Market Report Scope and Research Methodology
Market Definition and Coverage
For this methodology, the market is defined as the annual revenue generated from therapeutic monoclonal antibody products used to prevent, manage, or treat human diseases across major care settings and geographies.
Scope exclusions: We exclude diagnostic antibody kits, antibody fragments, polyclonal preparations, and discovery stage service revenues.
Segments Covered in This Report
- By Production Method
- In Vitro
- In Vivo
- By Source
- Human
- Humanized
- Chimeric
- Murine
- By Indication
- Oncology
- Autoimmune Diseases
- Infectious Diseases
- Inflammatory Diseases
- Other Indications
- By End User
- Hospitals
- Academic Research Institutes
- Specialty & Ambulatory Centers
- Other End Users
- By Geography
- North America
- United States
- Canada
- Mexico
- Europe
- Germany
- United Kingdom
- France
- Italy
- Spain
- Rest of Europe
- Asia-Pacific
- China
- Japan
- India
- Australia
- South Korea
- Rest of Asia-Pacific
- Middle East & Africa
- GCC
- South Africa
- Rest of Middle East & Africa
- South America
- Brazil
- Argentina
- Rest of South America
- North America
Data Sources, Market Sizing, and Validation
Desk Research
Desk research starts by assembling the demand and supply picture from widely available healthcare and life sciences datasets, then aligning those inputs to how monoclonal antibody sales are typically reported. We reviewed public sources including the US FDA (approvals and biologics labeling), EMA public assessment reports, WHO and World Bank health indicators, and OECD health statistics to understand therapy uptake, payer pressure, and regional treatment access.
To keep assumptions grounded, we also used peer reviewed journal literature (for indication level treatment patterns), government health expenditure releases, and reputable press and company filings to track launch timing, loss of exclusivity events, and broad pricing direction. Where needed, paid subscriptions were used for company financials and intelligence, patent databases, and shipment level import export context, mainly to cross check timelines and fill gaps when public reporting lagged. These examples are not exhaustive, and we relied on additional public and paid sources for data collection, validation, and research clarification.
Primary Interviews and Surveys
Primary work was used to test the desk assumptions that can change totals, especially net price progression, biosimilar penetration, and indication mix shifts. Interviews covered manufacturers and distributors, hospital pharmacy and infusion center stakeholders, and clinical or access focused experts across major regions, so gaps in public reporting could be clarified. The inputs from these discussions were then used to refine adoption curves, adjust price corridors by therapy area, and sanity check regional splits before finalizing the model.
Distribution of primary research fieldwork respondents
| Company type | Respondent position | Region |
|---|---|---|
| Top tier: 35% | CXOs: 13% | APAC: 41% |
| Mid tier: 50% | Functional/Unit leaders: 29% | EMEA: 37% |
| Smaller Players: 15% | Managers: 58% | Americas: 22% |
Market-Sizing & Forecasting
Sizing begins with a top-down build where approved therapy pools and treated patient demand are reconstructed using epidemiology direction, therapy line placement, and regional access signals, then translated into value using blended net pricing logic. For practical modeling, inputs were anchored on variables such as recent biologics approvals and label expansions, biosimilar entry timing, typical dosing and duration patterns by indication, observable biologics price erosion after competition, and regional healthcare spending capacity.
Those totals were corroborated using selective bottom-up checks, such as revenue roll ups from a sample of public company disclosures and channel checks on how much volume shifts to biosimilars after key launches. When gaps appeared, for example limited country level disclosure, we applied conservative share splits that were validated through interviews and rechecked against independent demand signals.
For forecasting, scenario analysis was used because the biggest swings come from a small set of discrete events, including pipeline successes, reimbursement changes, and the speed of biosimilar substitution. Each scenario was tied back to interview based expectations for uptake and pricing, followed by a single consolidated forecast that reflects the most probable path.
Data Validation & Update Cycle
We run multiple checks before sign off so outputs stay consistent with real world signals. Model results are compared against independent indicators such as approval cadence, major loss of exclusivity timelines, and regional treatment access trends, and then anomalies are investigated and corrected when a single assumption drives an outlier.
A second analyst reviews the calculations, inputs, and logic flow, and re-contact is triggered when interview feedback conflicts with the desk view or when a material event changes pricing or access. Reports are refreshed annually, and interim updates are added when major approvals, biosimilar launches, or policy shifts materially change the trajectory. Before delivery, a final fresh pass is performed so clients receive the latest updated view.
Mordor Intelligence's Monoclonal Antibodies Market Size Compared With Other Published Estimates
Published market sizes for monoclonal antibodies can differ even when the topic sounds the same, because each estimate uses a different product boundary, pricing basis, and timing for currency conversion. We also see gaps when one study counts adjacent antibody formats or includes non-therapy revenues adjacent to drug sales.
By tracking net sales alignment to therapy only revenues, refreshing biosimilar penetration and price erosion assumptions each cycle, and then checking indication level adoption signals, Mordor Intelligence keeps the estimate tied to branded and biosimilar therapeutic monoclonal antibodies rather than broader antibody related activity.
Benchmark comparison
| Source | Market Size | Gaps in Research Methodology |
|---|---|---|
| Mordor Intelligence | USD 286.65 B (2025) | |
| Trade Journal A | USD 265.17 B (2024) | Uses an earlier base year and commonly applies list price or gross sales assumptions, which can understate biosimilar driven net price compression and shift the year-on-year comparison. |
| Industry Analysis B | USD 231.42 B (2024) | Often applies narrower inclusion rules around product types and may not fully reflect newer indication expansions and late stage biosimilar adoption, which reduces the counted revenue pool for the same market label. |
The spread across the table is mainly explained by timing and what gets counted as therapy revenue, and then by how net pricing is handled as biosimilars scale. When scope is kept focused on therapeutic monoclonal antibodies and assumptions are updated with real access and adoption checks, the resulting market size stays easier to reconcile and repeat from one update to the next.
Key Questions Answered in the Report
What is the current size of the global monoclonal antibodies market?
The market stood at USD 323.89 billion in 2026 and is forecast to climb to USD 596.12 billion by 2031.
Which therapeutic area contributes the largest share of monoclonal antibody revenues?
Oncology applications generated 49.35% of global revenue in 2025, making it the leading indication.
Which segment is projected to grow the fastest through 2031?
Autoimmune diseases are expected to post the strongest 19.22% CAGR, outpacing all other indications.
How quickly are humanized antibodies expanding?
Humanized variants are advancing at an 18.02% CAGR, the fastest rate among source categories.
Why are specialty and ambulatory centers gaining importance?
Subcutaneous formulations such as Tecentriq Hybrenza cut chair time to about seven minutes, enabling convenient outpatient or at-home administration and driving a 15.98% CAGR for these centers.