
| Study Period | 2017 - 2030 |
| Base Year For Estimation | 2024 |
| Forecast Data Period | 2025 - 2030 |
| Market Size (2025) | USD 1.14 Billion |
| Market Size (2030) | USD 1.44 Billion |
| CAGR (2025 - 2030) | 4.83 % |
| Market Concentration | Low |
Major Players*Disclaimer: Major Players sorted in no particular order |


Molluscicide Market Analysis
The Molluscicide Market size is estimated at 1.14 billion USD in 2025, and is expected to reach 1.44 billion USD by 2030, growing at a CAGR of 4.83% during the forecast period (2025-2030).
The molluscicide industry is experiencing significant transformation driven by evolving agricultural practices and pest control chemical strategies. Foliar application methods dominated the industry in 2022, accounting for 53.7% of total molluscicide usage, highlighting the sector's preference for direct plant protection approaches. The increasing adoption of conservation tillage and stubble retention practices has created more favorable conditions for mollusk proliferation, as these farming methods increase organic content and soil moisture in paddocks. This shift in agricultural practices has necessitated more sophisticated crop protection chemical solutions, particularly in broadacre cropping systems where traditional methods prove insufficient.
Technological advancements in molluscicide formulations and application methods are reshaping the industry landscape. Manufacturers are developing innovative wet-process technologies that enhance product weatherability, uniformity, and palatability. The integration of drone technology for molluscicide application represents a significant advancement, though proper calibration remains crucial for optimal results. In intensive farming regions, the severity of mollusk infestations has reached critical levels, with documented cases showing up to 12 snails per square meter in rice fields, with each snail capable of consuming up to 15 rice plants daily.
The industry is witnessing a notable shift toward environmentally conscious solutions and integrated pest management approaches. Iron phosphate-based formulations are gaining popularity as an eco-friendly alternative to traditional agricultural chemicals, particularly in regions with strict environmental regulations. These products are designed to be safe for non-target organisms while maintaining efficacy against mollusks, which can consume up to 40% of their body weight in vegetation daily. The development of granular bait formulations with anti-molding properties demonstrates the industry's focus on creating more sustainable and effective solutions.
Research and development initiatives are driving innovation in molluscicide formulations and application techniques. Scientists and agricultural institutes are conducting extensive field trials to evaluate new active ingredients and their effectiveness against various mollusk species. For instance, recent experiments in China's Hainan province have demonstrated the efficacy of combining 6% metaldehyde granules with 10% camellia seed cake powder for controlling snails in orchid cultivation. This research-driven approach is leading to more targeted and efficient molluscicide solutions, particularly important as the economic impacts of mollusk damage become more severe, with some regions reporting annual losses in the hundreds of thousands of dollars due to invasive species like the zebra mussel.
Global Molluscicide Market Trends
Increasing threat to crop production due to molluscicides is increasing the usage
- The global average consumption of molluscicides per hectare increased from 418.0 grams per hectare in 2017 to 425.5 grams per hectare in 2022. Asia-Pacific recorded the highest per-hectare consumption of molluscicides, with 152.69 grams per hectare in 2022. Golden apple snails are the major threat to rice production in Asia-Pacific countries as they cut the rice stem at the base, destroying the whole plant and leading to annual yield losses of up to 50%, especially in irrigated rice fields, according to the International Rice Research Institute.
- Europe is the second-largest per-hectare consumer, with 124.32 grams per hectare of molluscicides in 2022. South America is the third-largest per-hectare consumer of molluscicides, with 110.41 grams per hectare of land in 2022. The giant African snail (Achatina fulica) and the golden apple snail (Pomacea canaliculata) are invasive species known for their voracious appetite and ability to reproduce rapidly, posing a serious threat to various crops. The yield losses caused by these snails can be substantial, with crops like rice, corn, and vegetables being particularly vulnerable.
- North America consumed 37.2 grams of molluscicides per hectare of land, which is significantly less compared to other regions. However, Deroceras reticulatum is one of the most invasive slug species of maize and soybean in the United States. At later growth stages, corn and soybean defoliation by slugs can lead to delayed canopy development and subsequent lower yields. Such attacks call for the need for effective management, which includes the use of molluscicides.

Understand The Key Trends Shaping This Market
Download PDF
Effectiveness of the metaldehyde in controlling snails and slugs in various crops like field crops and horticultural crops may increase the price of it
- Molluscicides are essential in agriculture and horticulture for effectively controlling mollusks like snails and slugs, which can cause significant damage to crop and ornamental plants. These pesticides play a vital role in protecting plant health, preventing yield losses, and maintaining the aesthetic appeal of gardens and landscapes.
- Metaldehyde is a molluscicide belonging to the chemical class of aldehydes. It is widely used to control snails and slugs, which are common pests in agricultural and horticultural crops. It was priced at USD 52.5 thousand per metric ton in 2022. Metaldehyde effectively controls a variety of snail and slug species, including common garden snails, grey field slugs, and black field slugs.
- These mollusks can cause significant damage to a wide range of crops, including vegetables, fruits, ornamental plants, and field crops. The mode of action of metaldehyde as a molluscicide involves inducing hyperactivity and loss of coordination in snails and slugs. When ingested, metaldehyde disrupts their nervous systems, leading to increased movement and a loss of their ability to feed properly. This eventually results in the pests becoming dehydrated and succumbing to the effects of metaldehyde.
- Ferric phosphate is a molluscicide used to control snails and slugs in agricultural and horticultural settings. It is also known as iron phosphate and is a naturally occurring compound. It was priced at USD 52.0 thousand per metric ton in 2022.
- Ferric phosphate effectively controls a variety of snail and slug species, including common garden snails, grey field slugs, and black field slugs. These mollusks are common pests that can cause damage to crops, vegetables, fruits, ornamental plants, and various other cultivated plants.

Segment Analysis: Application Mode
Foliar Segment in Molluscicide Market
The foliar application segment dominates the global molluscicide market, accounting for approximately 54% of the market share in 2024. This segment's prominence is primarily driven by the increasing snail infestation, particularly during winter and rainy seasons, and the growing need to improve yields while preventing losses caused by snails and slugs. Foliar applications are particularly effective as they directly target mollusks that feed on plant leaves and stems, providing quick and efficient pest control. The segment is also experiencing the fastest growth trajectory, projected to grow at around a 5% CAGR from 2024 to 2029, driven by its proven effectiveness in controlling mollusk populations and the rising adoption of foliar-based molluscicide market applications across various crop types.
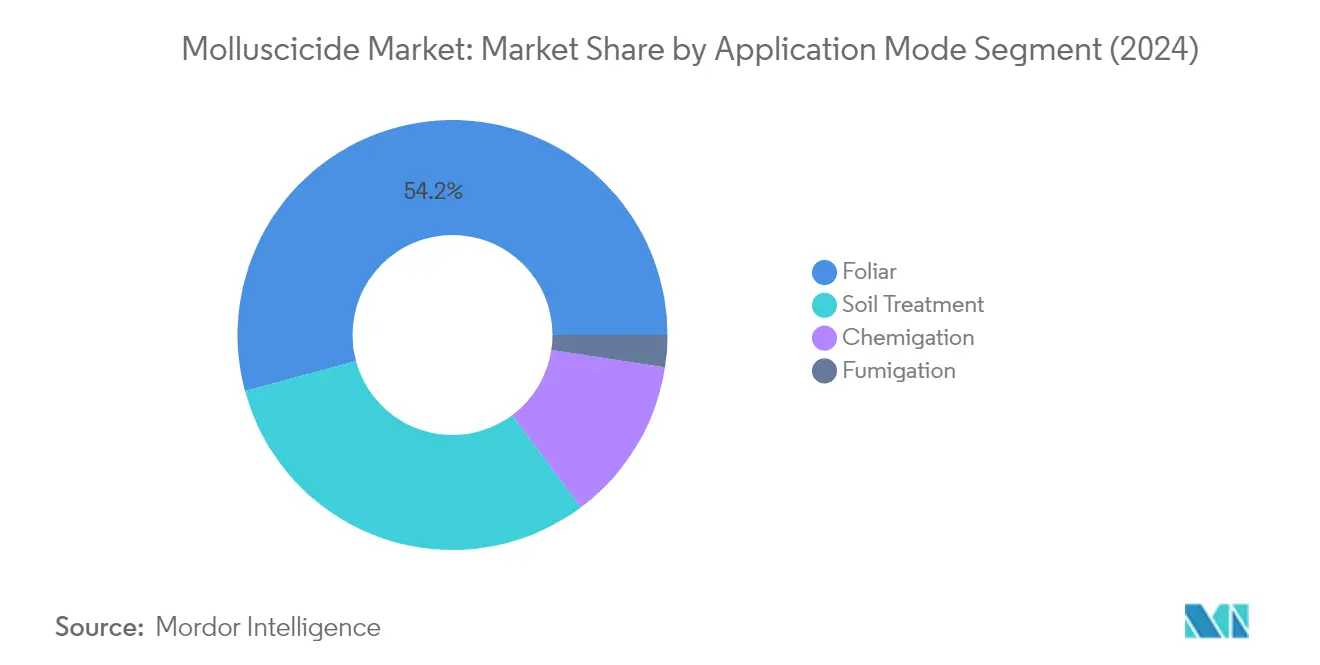
Remaining Segments in Application Mode
The other significant application modes in the molluscicide market include soil treatment, chemigation, and fumigation methods. Soil treatment represents the second-largest application method, offering targeted control of mollusks at the ground level where they primarily reside and cause damage to crops. Chemigation has gained traction due to the increasing adoption of drip irrigation systems and the growing trend of using chemicals through irrigation for effective snail and slug control. Fumigation, while representing a smaller share of the market, plays a crucial role in enclosed environments such as greenhouses and nurseries where mollusk infestations can be particularly challenging to manage using traditional methods.
Segment Analysis: Crop Type
Grains & Cereals Segment in Molluscicide Market
The grains and cereals segment dominates the global molluscicide market, commanding approximately 44% of the market share in 2024. This significant market position is primarily attributed to the extensive damage caused by snails and slugs to cereal crops, particularly during their early growth stages. These pests can cause substantial yield losses ranging from 50% to 90% when fields are heavily infested, leading to considerable economic losses for farmers. The segment's dominance is further strengthened by the effectiveness of synthetic agricultural pesticides in controlling mollusk populations in grain fields, particularly in protecting crops like wheat, rice, and other essential cereals that form the backbone of global food security.
Commercial Crops Segment in Molluscicide Market
The commercial crops segment is projected to exhibit the strongest growth in the molluscicide market during the forecast period 2024-2029, with an estimated CAGR of approximately 5%. This robust growth is driven by the increasing occurrence of snail infestations in high-value commercial crops such as sugarcane, rubber, coffee, tea, tobacco, and cotton. The segment's growth is particularly notable in regions where commercial crop cultivation is expanding, and farmers are increasingly adopting chemical control methods to protect their valuable crops from mollusk damage. The rising awareness about the economic implications of snail-related crop losses and the effectiveness of crop protection products in protecting commercial crops is expected to further accelerate the segment's growth.
Remaining Segments in Crop Type
The other significant segments in the molluscicide market include pulses & oilseeds, fruits & vegetables, and turf & ornamental applications. The pulses & oilseeds segment plays a crucial role in the market due to the vulnerability of crops like soybeans, canola, and various legumes to snail attacks. The fruits & vegetables segment is particularly important in regions with intensive horticultural production, where snails can cause significant aesthetic and commercial damage to produce. The turf & ornamental segment, while smaller, serves a specialized market focusing on protecting landscaping investments and ornamental plants from mollusk damage in both commercial and residential settings. These segments often utilize garden pesticides and plant protection chemicals to maintain crop integrity and aesthetic value.
Molluscicide Market Geography Segment Analysis
Molluscicide Market in Africa
The African molluscicide market faces unique challenges in agricultural pest control, particularly in managing snail and slug populations that affect crop production. The region's diverse climate zones and agricultural practices create varying demands for molluscicides across different farming systems. South Africa emerges as the largest market in the region, while other countries show growing adoption of these pest control solutions. The market is characterized by increasing awareness among farmers about the economic impact of mollusk damage on crops and the need for effective control measures. The agricultural sector's modernization and focus on improving crop yields are driving the adoption of advanced molluscicide products across the continent.
Molluscicide Market in Asia-Pacific
The Asia-Pacific molluscicide market demonstrates significant diversity in terms of application and adoption across various countries. The region faces substantial challenges from invasive mollusk species, particularly in rice-producing areas where golden apple snails pose a major threat to crop yields. Countries like China, Japan, and India have developed sophisticated pest management systems incorporating various molluscicides. The market is characterized by increasing awareness among farmers about the economic impact of mollusk damage and the adoption of integrated pest management approaches.
Molluscicide Market in China - Largest Market in Asia-Pacific
China dominates the Asia-Pacific molluscicide market with approximately 32% market share in 2024. The country's vast agricultural landscape and diverse crop production systems create substantial demand for molluscicide products. Chinese farmers face significant challenges from various mollusk species, including the Chinese slug, which affects over 500 types of plants. The country's agricultural sector has developed comprehensive pest management strategies, incorporating both traditional and modern molluscicide applications. The market is supported by strong research and development initiatives, focusing on developing more effective and environmentally friendly molluscicide solutions.
Molluscicide Market in Vietnam - Fastest Growing Market in Asia-Pacific
Vietnam represents the most dynamic growth market in the Asia-Pacific region, with an expected growth rate of approximately 7% during 2024-2029. The country's agricultural sector faces significant challenges from mollusk infestations, particularly in rice production areas. Vietnamese farmers are increasingly adopting modern pest control methods, including advanced molluscicide products, to protect their crops. The government's support for agricultural modernization and focus on improving crop yields has created a favorable environment for market growth. The country's agricultural research institutions are actively involved in developing effective molluscicide application strategies suited to local conditions.
Molluscicide Market in Europe
The European molluscicide market demonstrates advanced pest management practices and strict regulatory frameworks governing pesticide use. The region's diverse agricultural landscape, from Mediterranean to continental farming systems, creates varied demands for molluscicide products. Countries across Europe face different challenges from mollusk infestations, with particular concerns in areas with high rainfall and intensive agriculture. The market is characterized by a strong emphasis on sustainable farming practices and environmental protection, influencing the development and adoption of molluscicide products.
Molluscicide Market in Russia - Largest and Fastest Growing Market in Europe
Russia stands out as both the largest and fastest-growing market in Europe, with approximately 15% market share in 2024 and an expected growth rate of around 8% during 2024-2029. The country's vast agricultural lands and diverse crop production systems create substantial demand for molluscicide products. Russian farmers face significant challenges from various mollusk species, particularly in grain and cereal production. The agricultural sector has developed comprehensive pest management strategies, incorporating both traditional and modern molluscicide applications. The market is supported by increasing modernization of farming practices and growing awareness about crop protection methods.
Molluscicide Market in North America
The North American molluscicide market is characterized by advanced agricultural practices and sophisticated pest management systems. The region's diverse climate zones and farming systems create varied demands for molluscicide products across different agricultural sectors. The market benefits from strong research and development infrastructure, leading to continuous improvements in product formulations and application methods. Countries in the region face different challenges from mollusk infestations, with particular concerns in areas with intensive agriculture and high-value crop production.
Molluscicide Market in United States - Largest Market in North America
The United States dominates the North American molluscicide market with approximately 57% market share in 2024. The country's diverse agricultural landscape and intensive farming practices create substantial demand for molluscicide products. American farmers face significant challenges from various mollusk species, particularly in grain, cereal, and vegetable production. The agricultural sector has developed sophisticated pest management strategies, incorporating advanced molluscicide applications and integrated pest management approaches. The market is supported by strong research institutions and extensive agricultural extension services.
Molluscicide Market in Mexico - Fastest Growing Market in North America
Mexico emerges as the fastest-growing market in North America, with an expected growth rate of approximately 3% during 2024-2029. The country's agricultural sector faces unique challenges from mollusk infestations, particularly in high-value crop production areas. Mexican farmers are increasingly adopting modern pest control methods, including advanced molluscicide products, to protect their crops. The market benefits from growing awareness about crop protection and increasing modernization of farming practices. The country's agricultural research institutions actively participate in developing effective molluscicide application strategies suited to local conditions.
Molluscicide Market in South America
The South American molluscicide market demonstrates growing sophistication in pest management practices across various agricultural systems. The region faces significant challenges from invasive mollusk species, particularly the giant African snail and golden apple snail, which affect various crops including rice, corn, and vegetables. Brazil emerges as both the largest and fastest-growing market in the region, driven by its extensive agricultural operations and increasing adoption of modern pest control methods. The market is characterized by growing awareness among farmers about the economic impact of mollusk damage and the need for effective control measures. The agricultural sector's modernization and focus on improving crop yields are driving the adoption of advanced molluscicide products across the continent.
Get Analysis on Important Geographic Markets
Download PDF
Molluscicide Industry Overview
Top Companies in Molluscicide Market
The global molluscicide market is characterized by companies focusing on strategic expansion and product innovation to strengthen their market positions. Key players are investing significantly in research and development to create new formulations and enhance existing product effectiveness against resistant snail and slug populations. Companies are expanding their geographical presence through strategic acquisitions and partnerships, particularly in emerging agricultural markets. Operational agility is demonstrated through the development of integrated distribution networks and direct engagement with farmers via technical training and support services. Manufacturing capabilities are being enhanced through the establishment of new facilities and the upgrade of existing ones to meet growing demand and maintain quality standards. Product innovation is centered around developing environmentally sustainable solutions and improving application methods for better efficacy.
Moderate Fragmentation with Strong Regional Players
The molluscicides industry exhibits moderate fragmentation with a mix of global agrochemical conglomerates and specialized regional players. Large multinational companies leverage their extensive research capabilities and established distribution networks to maintain market leadership, while regional players compete through local market knowledge and specialized product offerings. The market structure is characterized by the presence of both integrated agricultural solution providers and specialized crop protection companies, with the former having advantages in terms of broader product portfolios and cross-selling opportunities. Market consolidation is primarily driven by larger companies acquiring regional players to expand their geographical footprint and access new customer bases.
Merger and acquisition activities in the market are focused on strengthening product portfolios and gaining access to new technologies and distribution channels. Global players are particularly interested in acquiring companies with a strong presence in emerging agricultural markets and those with innovative formulation technologies. The competitive dynamics are influenced by the need to maintain strong relationships with distributors and farmers, leading to increased investment in technical support and farmer education programs. Companies are also forming strategic alliances with research institutions and agricultural organizations to enhance their innovation capabilities and market understanding.
Innovation and Distribution Key to Growth
Success in the molluscicide market increasingly depends on companies' ability to develop effective and environmentally sustainable solutions while building strong distribution networks. Incumbents need to focus on continuous product innovation, particularly in developing formulations that can combat resistant pest populations while meeting stringent environmental regulations. Companies must invest in digital technologies for precision agriculture and integrated pest management solutions to maintain their competitive edge. Building strong relationships with agricultural communities through technical support and education programs is becoming crucial for market success. The ability to provide comprehensive crop protection solutions rather than standalone products is also emerging as a key differentiator.
For contenders looking to gain market share, focusing on niche market segments and developing specialized solutions for specific crop types or regional requirements presents significant opportunities. Success factors include building efficient supply chains, establishing a strong local presence through partnerships, and investing in research and development for innovative formulations. Companies need to consider the increasing emphasis on sustainable agriculture and organic farming practices while developing their product strategies. The regulatory landscape, particularly regarding environmental protection and food safety, will continue to shape competitive strategies, making compliance capabilities and sustainable product development crucial for long-term success. Market players must also address the growing demand for integrated pest management solutions and bio-based alternatives to traditional chemical molluscicides.
Molluscicide Market Leaders
-
American Vanguard Corporation
-
Arxada
-
Nufarm Ltd
-
PI Industries
-
UPL Limited
- *Disclaimer: Major Players sorted in no particular order

Need More Details on Market Players and Competiters?
Download PDF
Molluscicide Market News
- November 2022: Certis Belchim BV acquired the assets of Henry Manufacturing Limited in New Zealand. This includes its portfolio and pipeline of potassium fatty-acid salts, which have various applications in crop protection.
- March 2022: A new company called Certis Belchim BV was formed by Mitsui & Co. Ltd by merging its recently acquired Belchim Crop Protection and its European subsidiary Certis Europe. This was done in accordance with the terms of a definitive agreement.
- June 2021: Belchim Crop Protection was fully acquired by Mitsui & Co. Ltd after purchasing the remaining 32% of shares owned by Belchim Management NV/SA. Mitsui now holds a 62% stake in Belchim Crop Protection alongside ISK and Mitsui Chemicals Agro. This acquisition allows Mitsui to focus on establishing a sustainable crop protection company in Europe.
Free With This Report
Along with the report, We also offer a comprehensive and exhaustive data pack with 50+ graphs on insecticide, fungicides, and herbicides consumption per hectare and the average price of active ingredients used in insecticides, fungicides, herbicides, nematicides, and molluscicides. The data pack includes Globe, North America, Europe, Asia-Pacific, South America, and Africa.


Molluscicide Market Report - Table of Contents
1. EXECUTIVE SUMMARY & KEY FINDINGS
2. REPORT OFFERS
3. INTRODUCTION
- 3.1 Study Assumptions & Market Definition
- 3.2 Scope of the Study
- 3.3 Research Methodology
4. KEY INDUSTRY TRENDS
- 4.1 Consumption Of Pesticide Per Hectare
- 4.2 Pricing Analysis For Active Ingredients
-
4.3 Regulatory Framework
- 4.3.1 Australia
- 4.3.2 China
- 4.3.3 France
- 4.3.4 Germany
- 4.3.5 India
- 4.3.6 Indonesia
- 4.3.7 Italy
- 4.3.8 Japan
- 4.3.9 Myanmar
- 4.3.10 Netherlands
- 4.3.11 Pakistan
- 4.3.12 Philippines
- 4.3.13 Russia
- 4.3.14 Spain
- 4.3.15 Thailand
- 4.3.16 Ukraine
- 4.3.17 United Kingdom
- 4.3.18 Vietnam
- 4.4 Value Chain & Distribution Channel Analysis
5. MARKET SEGMENTATION (includes market size in Value in USD and Volume, Forecasts up to 2030 and analysis of growth prospects)
-
5.1 Application Mode
- 5.1.1 Chemigation
- 5.1.2 Foliar
- 5.1.3 Fumigation
- 5.1.4 Soil Treatment
-
5.2 Crop Type
- 5.2.1 Commercial Crops
- 5.2.2 Fruits & Vegetables
- 5.2.3 Grains & Cereals
- 5.2.4 Pulses & Oilseeds
- 5.2.5 Turf & Ornamental
-
5.3 Region
- 5.3.1 Africa
- 5.3.1.1 By Country
- 5.3.1.1.1 South Africa
- 5.3.1.1.2 Rest of Africa
- 5.3.2 Asia-Pacific
- 5.3.2.1 By Country
- 5.3.2.1.1 Australia
- 5.3.2.1.2 China
- 5.3.2.1.3 India
- 5.3.2.1.4 Indonesia
- 5.3.2.1.5 Japan
- 5.3.2.1.6 Myanmar
- 5.3.2.1.7 Pakistan
- 5.3.2.1.8 Philippines
- 5.3.2.1.9 Thailand
- 5.3.2.1.10 Vietnam
- 5.3.2.1.11 Rest of Asia-Pacific
- 5.3.3 Europe
- 5.3.3.1 By Country
- 5.3.3.1.1 France
- 5.3.3.1.2 Germany
- 5.3.3.1.3 Italy
- 5.3.3.1.4 Netherlands
- 5.3.3.1.5 Russia
- 5.3.3.1.6 Spain
- 5.3.3.1.7 Ukraine
- 5.3.3.1.8 United Kingdom
- 5.3.3.1.9 Rest of Europe
- 5.3.4 North America
- 5.3.4.1 By Country
- 5.3.4.1.1 Canada
- 5.3.4.1.2 Mexico
- 5.3.4.1.3 United States
- 5.3.4.1.4 Rest of North America
- 5.3.5 South America
- 5.3.5.1 By Country
- 5.3.5.1.1 Argentina
- 5.3.5.1.2 Brazil
- 5.3.5.1.3 Chile
- 5.3.5.1.4 Rest of South America
6. COMPETITIVE LANDSCAPE
- 6.1 Key Strategic Moves
- 6.2 Market Share Analysis
- 6.3 Company Landscape
-
6.4 Company Profiles (includes Global level Overview, Market level overview, Core Business Segments, Financials, Headcount, Key Information, Market Rank, Market Share, Products and Services, and analysis of Recent Developments)
- 6.4.1 American Vanguard Corporation
- 6.4.2 Arxada
- 6.4.3 Liphatech Inc.
- 6.4.4 Mitsui & Co. Ltd (Certis Belchim)
- 6.4.5 Nufarm Ltd
- 6.4.6 PI Industries
- 6.4.7 UPL Limited
- 6.4.8 W. Neudorff GmbH KG
7. KEY STRATEGIC QUESTIONS FOR CROP PROTECTION CHEMICALS CEOS
8. APPENDIX
-
8.1 Global Overview
- 8.1.1 Overview
- 8.1.2 Porter’s Five Forces Framework
- 8.1.3 Global Value Chain Analysis
- 8.1.4 Market Dynamics (DROs)
- 8.2 Sources & References
- 8.3 List of Tables & Figures
- 8.4 Primary Insights
- 8.5 Data Pack
- 8.6 Glossary of Terms
You Can Purchase Parts Of This Report. Check Out Prices For Specific Sections
Get Price Break-up Now
List of Tables & Figures
- Figure 1:
- MOLLUSCICIDE CONSUMPTION PER HECTARE, GRAMS, GLOBAL, 2017 - 2022
- Figure 2:
- ACTIVE INGREDIENT PRICE PER METRIC TON, USD, GLOBAL, 2017 - 2022
- Figure 3:
- MOLLUSCICIDE VOLUME METRIC TON, GLOBAL, 2017 - 2029
- Figure 4:
- MOLLUSCICIDE VALUE USD, GLOBAL, 2017 - 2029
- Figure 5:
- MOLLUSCICIDE MARKET BY APPLICATION MODE, METRIC TON, GLOBAL, 2017 - 2029
- Figure 6:
- MOLLUSCICIDE MARKET BY APPLICATION MODE, USD, GLOBAL, 2017 - 2029
- Figure 7:
- VALUE SHARE OF MOLLUSCICIDE BY APPLICATION MODE, %, GLOBAL, 2017 VS 2023 VS 2029
- Figure 8:
- VOLUME SHARE OF MOLLUSCICIDE BY APPLICATION MODE, %, GLOBAL, 2017 VS 2023 VS 2029
- Figure 9:
- CROP PROTECTION CHEMICALS APPLIED THROUGH CHEMIGATION, METRIC TON, GLOBAL, 2017 - 2029
- Figure 10:
- CROP PROTECTION CHEMICALS APPLIED THROUGH CHEMIGATION, USD, GLOBAL, 2017 - 2029
- Figure 11:
- VALUE SHARE OF CHEMIGATION BY CROP TYPE, %, GLOBAL, 2022 VS 2029
- Figure 12:
- CROP PROTECTION CHEMICALS APPLIED THROUGH FOLIAR, METRIC TON, GLOBAL, 2017 - 2029
- Figure 13:
- CROP PROTECTION CHEMICALS APPLIED THROUGH FOLIAR, USD, GLOBAL, 2017 - 2029
- Figure 14:
- VALUE SHARE OF FOLIAR BY CROP TYPE, %, GLOBAL, 2022 VS 2029
- Figure 15:
- CROP PROTECTION CHEMICALS APPLIED THROUGH FUMIGATION, METRIC TON, GLOBAL, 2017 - 2029
- Figure 16:
- CROP PROTECTION CHEMICALS APPLIED THROUGH FUMIGATION, USD, GLOBAL, 2017 - 2029
- Figure 17:
- VALUE SHARE OF FUMIGATION BY CROP TYPE, %, GLOBAL, 2022 VS 2029
- Figure 18:
- CROP PROTECTION CHEMICALS APPLIED THROUGH SOIL TREATMENT, METRIC TON, GLOBAL, 2017 - 2029
- Figure 19:
- CROP PROTECTION CHEMICALS APPLIED THROUGH SOIL TREATMENT, USD, GLOBAL, 2017 - 2029
- Figure 20:
- VALUE SHARE OF SOIL TREATMENT BY CROP TYPE, %, GLOBAL, 2022 VS 2029
- Figure 21:
- MOLLUSCICIDE MARKET BY CROP TYPE, METRIC TON, GLOBAL, 2017 - 2029
- Figure 22:
- MOLLUSCICIDE MARKET BY CROP TYPE, USD, GLOBAL, 2017 - 2029
- Figure 23:
- VALUE SHARE OF MOLLUSCICIDE BY CROP TYPE, %, GLOBAL, 2017 VS 2023 VS 2029
- Figure 24:
- VOLUME SHARE OF MOLLUSCICIDE BY CROP TYPE, %, GLOBAL, 2017 VS 2023 VS 2029
- Figure 25:
- MOLLUSCICIDE CONSUMED BY COMMERCIAL CROPS, METRIC TON, GLOBAL, 2017 - 2029
- Figure 26:
- MOLLUSCICIDE CONSUMED BY COMMERCIAL CROPS, USD, GLOBAL, 2017 - 2029
- Figure 27:
- VALUE SHARE OF COMMERCIAL CROPS BY APPLICATION MODE, %, GLOBAL, 2022 VS 2029
- Figure 28:
- MOLLUSCICIDE CONSUMED BY FRUITS & VEGETABLES, METRIC TON, GLOBAL, 2017 - 2029
- Figure 29:
- MOLLUSCICIDE CONSUMED BY FRUITS & VEGETABLES, USD, GLOBAL, 2017 - 2029
- Figure 30:
- VALUE SHARE OF FRUITS & VEGETABLES BY APPLICATION MODE, %, GLOBAL, 2022 VS 2029
- Figure 31:
- MOLLUSCICIDE CONSUMED BY GRAINS & CEREALS, METRIC TON, GLOBAL, 2017 - 2029
- Figure 32:
- MOLLUSCICIDE CONSUMED BY GRAINS & CEREALS, USD, GLOBAL, 2017 - 2029
- Figure 33:
- VALUE SHARE OF GRAINS & CEREALS BY APPLICATION MODE, %, GLOBAL, 2022 VS 2029
- Figure 34:
- MOLLUSCICIDE CONSUMED BY PULSES & OILSEEDS, METRIC TON, GLOBAL, 2017 - 2029
- Figure 35:
- MOLLUSCICIDE CONSUMED BY PULSES & OILSEEDS, USD, GLOBAL, 2017 - 2029
- Figure 36:
- VALUE SHARE OF PULSES & OILSEEDS BY APPLICATION MODE, %, GLOBAL, 2022 VS 2029
- Figure 37:
- MOLLUSCICIDE CONSUMED BY TURF & ORNAMENTAL, METRIC TON, GLOBAL, 2017 - 2029
- Figure 38:
- MOLLUSCICIDE CONSUMED BY TURF & ORNAMENTAL, USD, GLOBAL, 2017 - 2029
- Figure 39:
- VALUE SHARE OF TURF & ORNAMENTAL BY APPLICATION MODE, %, GLOBAL, 2022 VS 2029
- Figure 40:
- MOLLUSCICIDE MARKET BY REGION, METRIC TON, GLOBAL, 2017 - 2029
- Figure 41:
- MOLLUSCICIDE MARKET BY REGION, USD, GLOBAL, 2017 - 2029
- Figure 42:
- VALUE SHARE OF MOLLUSCICIDE BY REGION, %, GLOBAL, 2017 VS 2023 VS 2029
- Figure 43:
- VOLUME SHARE OF MOLLUSCICIDE BY REGION, %, GLOBAL, 2017 VS 2023 VS 2029
- Figure 44:
- MOLLUSCICIDE MARKET BY COUNTRY, METRIC TON, GLOBAL, 2017 - 2029
- Figure 45:
- MOLLUSCICIDE MARKET BY COUNTRY, USD, GLOBAL, 2017 - 2029
- Figure 46:
- VALUE SHARE OF MOLLUSCICIDE BY COUNTRY, %, GLOBAL, 2017 VS 2023 VS 2029
- Figure 47:
- VOLUME SHARE OF MOLLUSCICIDE BY COUNTRY, %, GLOBAL, 2017 VS 2023 VS 2029
- Figure 48:
- MOLLUSCICIDE CONSUMED BY SOUTH AFRICA, METRIC TON, GLOBAL, 2017 - 2029
- Figure 49:
- MOLLUSCICIDE CONSUMED BY SOUTH AFRICA, USD, GLOBAL, 2017 - 2029
- Figure 50:
- VALUE SHARE OF SOUTH AFRICA BY CROP TYPE, %, GLOBAL, 2022 VS 2029
- Figure 51:
- MOLLUSCICIDE CONSUMED BY REST OF AFRICA, METRIC TON, GLOBAL, 2017 - 2029
- Figure 52:
- MOLLUSCICIDE CONSUMED BY REST OF AFRICA, USD, GLOBAL, 2017 - 2029
- Figure 53:
- VALUE SHARE OF REST OF AFRICA BY CROP TYPE, %, GLOBAL, 2022 VS 2029
- Figure 54:
- MOLLUSCICIDE MARKET BY COUNTRY, METRIC TON, GLOBAL, 2017 - 2029
- Figure 55:
- MOLLUSCICIDE MARKET BY COUNTRY, USD, GLOBAL, 2017 - 2029
- Figure 56:
- VALUE SHARE OF MOLLUSCICIDE BY COUNTRY, %, GLOBAL, 2017 VS 2023 VS 2029
- Figure 57:
- VOLUME SHARE OF MOLLUSCICIDE BY COUNTRY, %, GLOBAL, 2017 VS 2023 VS 2029
- Figure 58:
- MOLLUSCICIDE CONSUMED BY AUSTRALIA, METRIC TON, GLOBAL, 2017 - 2029
- Figure 59:
- MOLLUSCICIDE CONSUMED BY AUSTRALIA, USD, GLOBAL, 2017 - 2029
- Figure 60:
- VALUE SHARE OF AUSTRALIA BY CROP TYPE, %, GLOBAL, 2022 VS 2029
- Figure 61:
- MOLLUSCICIDE CONSUMED BY CHINA, METRIC TON, GLOBAL, 2017 - 2029
- Figure 62:
- MOLLUSCICIDE CONSUMED BY CHINA, USD, GLOBAL, 2017 - 2029
- Figure 63:
- VALUE SHARE OF CHINA BY CROP TYPE, %, GLOBAL, 2022 VS 2029
- Figure 64:
- MOLLUSCICIDE CONSUMED BY INDIA, METRIC TON, GLOBAL, 2017 - 2029
- Figure 65:
- MOLLUSCICIDE CONSUMED BY INDIA, USD, GLOBAL, 2017 - 2029
- Figure 66:
- VALUE SHARE OF INDIA BY CROP TYPE, %, GLOBAL, 2022 VS 2029
- Figure 67:
- MOLLUSCICIDE CONSUMED BY INDONESIA, METRIC TON, GLOBAL, 2017 - 2029
- Figure 68:
- MOLLUSCICIDE CONSUMED BY INDONESIA, USD, GLOBAL, 2017 - 2029
- Figure 69:
- VALUE SHARE OF INDONESIA BY CROP TYPE, %, GLOBAL, 2022 VS 2029
- Figure 70:
- MOLLUSCICIDE CONSUMED BY JAPAN, METRIC TON, GLOBAL, 2017 - 2029
- Figure 71:
- MOLLUSCICIDE CONSUMED BY JAPAN, USD, GLOBAL, 2017 - 2029
- Figure 72:
- VALUE SHARE OF JAPAN BY CROP TYPE, %, GLOBAL, 2022 VS 2029
- Figure 73:
- MOLLUSCICIDE CONSUMED BY MYANMAR, METRIC TON, GLOBAL, 2017 - 2029
- Figure 74:
- MOLLUSCICIDE CONSUMED BY MYANMAR, USD, GLOBAL, 2017 - 2029
- Figure 75:
- VALUE SHARE OF MYANMAR BY CROP TYPE, %, GLOBAL, 2022 VS 2029
- Figure 76:
- MOLLUSCICIDE CONSUMED BY PAKISTAN, METRIC TON, GLOBAL, 2017 - 2029
- Figure 77:
- MOLLUSCICIDE CONSUMED BY PAKISTAN, USD, GLOBAL, 2017 - 2029
- Figure 78:
- VALUE SHARE OF PAKISTAN BY CROP TYPE, %, GLOBAL, 2022 VS 2029
- Figure 79:
- MOLLUSCICIDE CONSUMED BY PHILIPPINES, METRIC TON, GLOBAL, 2017 - 2029
- Figure 80:
- MOLLUSCICIDE CONSUMED BY PHILIPPINES, USD, GLOBAL, 2017 - 2029
- Figure 81:
- VALUE SHARE OF PHILIPPINES BY CROP TYPE, %, GLOBAL, 2022 VS 2029
- Figure 82:
- MOLLUSCICIDE CONSUMED BY THAILAND, METRIC TON, GLOBAL, 2017 - 2029
- Figure 83:
- MOLLUSCICIDE CONSUMED BY THAILAND, USD, GLOBAL, 2017 - 2029
- Figure 84:
- VALUE SHARE OF THAILAND BY CROP TYPE, %, GLOBAL, 2022 VS 2029
- Figure 85:
- MOLLUSCICIDE CONSUMED BY VIETNAM, METRIC TON, GLOBAL, 2017 - 2029
- Figure 86:
- MOLLUSCICIDE CONSUMED BY VIETNAM, USD, GLOBAL, 2017 - 2029
- Figure 87:
- VALUE SHARE OF VIETNAM BY CROP TYPE, %, GLOBAL, 2022 VS 2029
- Figure 88:
- MOLLUSCICIDE CONSUMED BY REST OF ASIA-PACIFIC, METRIC TON, GLOBAL, 2017 - 2029
- Figure 89:
- MOLLUSCICIDE CONSUMED BY REST OF ASIA-PACIFIC, USD, GLOBAL, 2017 - 2029
- Figure 90:
- VALUE SHARE OF REST OF ASIA-PACIFIC BY CROP TYPE, %, GLOBAL, 2022 VS 2029
- Figure 91:
- MOLLUSCICIDE MARKET BY COUNTRY, METRIC TON, GLOBAL, 2017 - 2029
- Figure 92:
- MOLLUSCICIDE MARKET BY COUNTRY, USD, GLOBAL, 2017 - 2029
- Figure 93:
- VALUE SHARE OF MOLLUSCICIDE BY COUNTRY, %, GLOBAL, 2017 VS 2023 VS 2029
- Figure 94:
- VOLUME SHARE OF MOLLUSCICIDE BY COUNTRY, %, GLOBAL, 2017 VS 2023 VS 2029
- Figure 95:
- MOLLUSCICIDE CONSUMED BY FRANCE, METRIC TON, GLOBAL, 2017 - 2029
- Figure 96:
- MOLLUSCICIDE CONSUMED BY FRANCE, USD, GLOBAL, 2017 - 2029
- Figure 97:
- VALUE SHARE OF FRANCE BY CROP TYPE, %, GLOBAL, 2022 VS 2029
- Figure 98:
- MOLLUSCICIDE CONSUMED BY GERMANY, METRIC TON, GLOBAL, 2017 - 2029
- Figure 99:
- MOLLUSCICIDE CONSUMED BY GERMANY, USD, GLOBAL, 2017 - 2029
- Figure 100:
- VALUE SHARE OF GERMANY BY CROP TYPE, %, GLOBAL, 2022 VS 2029
- Figure 101:
- MOLLUSCICIDE CONSUMED BY ITALY, METRIC TON, GLOBAL, 2017 - 2029
- Figure 102:
- MOLLUSCICIDE CONSUMED BY ITALY, USD, GLOBAL, 2017 - 2029
- Figure 103:
- VALUE SHARE OF ITALY BY CROP TYPE, %, GLOBAL, 2022 VS 2029
- Figure 104:
- MOLLUSCICIDE CONSUMED BY NETHERLANDS, METRIC TON, GLOBAL, 2017 - 2029
- Figure 105:
- MOLLUSCICIDE CONSUMED BY NETHERLANDS, USD, GLOBAL, 2017 - 2029
- Figure 106:
- VALUE SHARE OF NETHERLANDS BY CROP TYPE, %, GLOBAL, 2022 VS 2029
- Figure 107:
- MOLLUSCICIDE CONSUMED BY RUSSIA, METRIC TON, GLOBAL, 2017 - 2029
- Figure 108:
- MOLLUSCICIDE CONSUMED BY RUSSIA, USD, GLOBAL, 2017 - 2029
- Figure 109:
- VALUE SHARE OF RUSSIA BY CROP TYPE, %, GLOBAL, 2022 VS 2029
- Figure 110:
- MOLLUSCICIDE CONSUMED BY SPAIN, METRIC TON, GLOBAL, 2017 - 2029
- Figure 111:
- MOLLUSCICIDE CONSUMED BY SPAIN, USD, GLOBAL, 2017 - 2029
- Figure 112:
- VALUE SHARE OF SPAIN BY CROP TYPE, %, GLOBAL, 2022 VS 2029
- Figure 113:
- MOLLUSCICIDE CONSUMED BY UKRAINE, METRIC TON, GLOBAL, 2017 - 2029
- Figure 114:
- MOLLUSCICIDE CONSUMED BY UKRAINE, USD, GLOBAL, 2017 - 2029
- Figure 115:
- VALUE SHARE OF UKRAINE BY CROP TYPE, %, GLOBAL, 2022 VS 2029
- Figure 116:
- MOLLUSCICIDE CONSUMED BY UNITED KINGDOM, METRIC TON, GLOBAL, 2017 - 2029
- Figure 117:
- MOLLUSCICIDE CONSUMED BY UNITED KINGDOM, USD, GLOBAL, 2017 - 2029
- Figure 118:
- VALUE SHARE OF UNITED KINGDOM BY CROP TYPE, %, GLOBAL, 2022 VS 2029
- Figure 119:
- MOLLUSCICIDE CONSUMED BY REST OF EUROPE, METRIC TON, GLOBAL, 2017 - 2029
- Figure 120:
- MOLLUSCICIDE CONSUMED BY REST OF EUROPE, USD, GLOBAL, 2017 - 2029
- Figure 121:
- VALUE SHARE OF REST OF EUROPE BY CROP TYPE, %, GLOBAL, 2022 VS 2029
- Figure 122:
- MOLLUSCICIDE MARKET BY COUNTRY, METRIC TON, GLOBAL, 2017 - 2029
- Figure 123:
- MOLLUSCICIDE MARKET BY COUNTRY, USD, GLOBAL, 2017 - 2029
- Figure 124:
- VALUE SHARE OF MOLLUSCICIDE BY COUNTRY, %, GLOBAL, 2017 VS 2023 VS 2029
- Figure 125:
- VOLUME SHARE OF MOLLUSCICIDE BY COUNTRY, %, GLOBAL, 2017 VS 2023 VS 2029
- Figure 126:
- MOLLUSCICIDE CONSUMED BY CANADA, METRIC TON, GLOBAL, 2017 - 2029
- Figure 127:
- MOLLUSCICIDE CONSUMED BY CANADA, USD, GLOBAL, 2017 - 2029
- Figure 128:
- VALUE SHARE OF CANADA BY CROP TYPE, %, GLOBAL, 2022 VS 2029
- Figure 129:
- MOLLUSCICIDE CONSUMED BY MEXICO, METRIC TON, GLOBAL, 2017 - 2029
- Figure 130:
- MOLLUSCICIDE CONSUMED BY MEXICO, USD, GLOBAL, 2017 - 2029
- Figure 131:
- VALUE SHARE OF MEXICO BY CROP TYPE, %, GLOBAL, 2022 VS 2029
- Figure 132:
- MOLLUSCICIDE CONSUMED BY UNITED STATES, METRIC TON, GLOBAL, 2017 - 2029
- Figure 133:
- MOLLUSCICIDE CONSUMED BY UNITED STATES, USD, GLOBAL, 2017 - 2029
- Figure 134:
- VALUE SHARE OF UNITED STATES BY CROP TYPE, %, GLOBAL, 2022 VS 2029
- Figure 135:
- MOLLUSCICIDE CONSUMED BY REST OF NORTH AMERICA, METRIC TON, GLOBAL, 2017 - 2029
- Figure 136:
- MOLLUSCICIDE CONSUMED BY REST OF NORTH AMERICA, USD, GLOBAL, 2017 - 2029
- Figure 137:
- VALUE SHARE OF REST OF NORTH AMERICA BY CROP TYPE, %, GLOBAL, 2022 VS 2029
- Figure 138:
- MOLLUSCICIDE MARKET BY COUNTRY, METRIC TON, GLOBAL, 2017 - 2029
- Figure 139:
- MOLLUSCICIDE MARKET BY COUNTRY, USD, GLOBAL, 2017 - 2029
- Figure 140:
- VALUE SHARE OF MOLLUSCICIDE BY COUNTRY, %, GLOBAL, 2017 VS 2023 VS 2029
- Figure 141:
- VOLUME SHARE OF MOLLUSCICIDE BY COUNTRY, %, GLOBAL, 2017 VS 2023 VS 2029
- Figure 142:
- MOLLUSCICIDE CONSUMED BY ARGENTINA, METRIC TON, GLOBAL, 2017 - 2029
- Figure 143:
- MOLLUSCICIDE CONSUMED BY ARGENTINA, USD, GLOBAL, 2017 - 2029
- Figure 144:
- VALUE SHARE OF ARGENTINA BY CROP TYPE, %, GLOBAL, 2022 VS 2029
- Figure 145:
- MOLLUSCICIDE CONSUMED BY BRAZIL, METRIC TON, GLOBAL, 2017 - 2029
- Figure 146:
- MOLLUSCICIDE CONSUMED BY BRAZIL, USD, GLOBAL, 2017 - 2029
- Figure 147:
- VALUE SHARE OF BRAZIL BY CROP TYPE, %, GLOBAL, 2022 VS 2029
- Figure 148:
- MOLLUSCICIDE CONSUMED BY CHILE, METRIC TON, GLOBAL, 2017 - 2029
- Figure 149:
- MOLLUSCICIDE CONSUMED BY CHILE, USD, GLOBAL, 2017 - 2029
- Figure 150:
- VALUE SHARE OF CHILE BY CROP TYPE, %, GLOBAL, 2022 VS 2029
- Figure 151:
- MOLLUSCICIDE CONSUMED BY REST OF SOUTH AMERICA, METRIC TON, GLOBAL, 2017 - 2029
- Figure 152:
- MOLLUSCICIDE CONSUMED BY REST OF SOUTH AMERICA, USD, GLOBAL, 2017 - 2029
- Figure 153:
- VALUE SHARE OF REST OF SOUTH AMERICA BY CROP TYPE, %, GLOBAL, 2022 VS 2029
- Figure 154:
- MOST ACTIVE COMPANIES BY NUMBER OF STRATEGIC MOVES, GLOBAL, 2017-2022
- Figure 155:
- MOST ACTIVE COMPANIES BY NUMBER OF STRATEGIC MOVES, GLOBAL, 2017-2022
- Figure 156:
- MARKET SHARE OF MAJOR PLAYERS, %, GLOBAL
Molluscicide Industry Segmentation
Chemigation, Foliar, Fumigation, Soil Treatment are covered as segments by Application Mode. Commercial Crops, Fruits & Vegetables, Grains & Cereals, Pulses & Oilseeds, Turf & Ornamental are covered as segments by Crop Type. Africa, Asia-Pacific, Europe, North America, South America are covered as segments by Region.| Application Mode | Chemigation | |||
| Foliar | ||||
| Fumigation | ||||
| Soil Treatment | ||||
| Crop Type | Commercial Crops | |||
| Fruits & Vegetables | ||||
| Grains & Cereals | ||||
| Pulses & Oilseeds | ||||
| Turf & Ornamental | ||||
| Region | Africa | By Country | South Africa | |
| Rest of Africa | ||||
| Asia-Pacific | By Country | Australia | ||
| China | ||||
| India | ||||
| Indonesia | ||||
| Japan | ||||
| Myanmar | ||||
| Pakistan | ||||
| Philippines | ||||
| Thailand | ||||
| Vietnam | ||||
| Rest of Asia-Pacific | ||||
| Europe | By Country | France | ||
| Germany | ||||
| Italy | ||||
| Netherlands | ||||
| Russia | ||||
| Spain | ||||
| Ukraine | ||||
| United Kingdom | ||||
| Rest of Europe | ||||
| North America | By Country | Canada | ||
| Mexico | ||||
| United States | ||||
| Rest of North America | ||||
| South America | By Country | Argentina | ||
| Brazil | ||||
| Chile | ||||
| Rest of South America | ||||
Need A Different Region or Segment?
Customize Now
Market Definition
- Function - Molluscicides are chemicals used to control or prevent mollusks from damaging the crop and prevent yield loss.
- Application Mode - Foliar, Seed Treatment, Soil Treatment, Chemigation, and Fumigation are the different type of application modes through which crop protection chemicals are applied to the crops.
- Crop Type - This represents the consumption of crop protection chemicals by Cereals, Pulses, Oilseeds, Fruits, Vegetables, Turf, and Ornamental crops.
| Keyword | Definition |
|---|---|
| IWM | Integrated weed management (IWM) is an approach to incorporate multiple weed control techniques throughout the growing season to give producers the best opportunity to control problematic weeds. |
| Host | Hosts are the plants that form relationships with beneficial microorganisms and help them colonize. |
| Pathogen | A disease-causing organism. |
| Herbigation | Herbigation is an effective method of applying herbicides through irrigation systems. |
| Maximum residue levels (MRL) | Maximum Residue Limit (MRL) is the maximum allowed limit of pesticide residue in food or feed obtained from plants and animals. |
| IoT | The Internet of Things (IoT) is a network of interconnected devices that connect and exchange data with other IoT devices and the cloud. |
| Herbicide-tolerant varieties (HTVs) | Herbicide-tolerant varieties are plant species that have been genetically engineered to be resistant to herbicides used on crops. |
| Chemigation | Chemigation is a method of applying pesticides to crops through an irrigation system. |
| Crop Protection | Crop protection is a method of protecting crop yields from different pests, including insects, weeds, plant diseases, and others that cause damage to agricultural crops. |
| Seed Treatment | Seed treatment helps to disinfect seeds or seedlings from seed-borne or soil-borne pests. Crop protection chemicals, such as fungicides, insecticides, or nematicides, are commonly used for seed treatment. |
| Fumigation | Fumigation is the application of crop protection chemicals in gaseous form to control pests. |
| Bait | A bait is a food or other material used to lure a pest and kill it through various methods, including poisoning. |
| Contact Fungicide | Contact pesticides prevent crop contamination and combat fungal pathogens. They act on pests (fungi) only when they come in contact with the pests. |
| Systemic Fungicide | A systemic fungicide is a compound taken up by a plant and then translocated within the plant, thus protecting the plant from attack by pathogens. |
| Mass Drug Administration (MDA) | Mass drug administration is the strategy to control or eliminate many neglected tropical diseases. |
| Mollusks | Mollusks are pests that feed on crops, causing crop damage and yield loss. Mollusks include octopi, squid, snails, and slugs. |
| Pre-emergence Herbicide | Preemergence herbicides are a form of chemical weed control that prevents germinated weed seedlings from becoming established. |
| Post-emergence Herbicide | Postemergence herbicides are applied to the agricultural field to control weeds after emergence (germination) of seeds or seedlings. |
| Active Ingredients | Active ingredients are the chemicals in pesticide products that kill, control, or repel pests. |
| United States Department of Agriculture (USDA) | The Department of Agriculture provides leadership on food, agriculture, natural resources, and related issues. |
| Weed Science Society of America (WSSA) | The WSSA, a non-profit professional society, promotes research, education, and extension outreach activities related to weeds. |
| Suspension concentrate | Suspension concentrate (SC) is one of the formulations of crop protection chemicals with solid active ingredients dispersed in water. |
| Wettable powder | A wettable powder (WP) is a powder formulation that forms a suspension when mixed with water prior to spraying. |
| Emulsifiable concentrate | Emulsifiable concentrate (EC) is a concentrated liquid formulation of pesticide that needs to be diluted with water to create a spray solution. |
| Plant-parasitic nematodes | Parasitic Nematodes feed on the roots of crops, causing damage to the roots. These damages allow for easy plant infestation by soil-borne pathogens, which results in crop or yield loss. |
| Australian Weeds Strategy (AWS) | The Australian Weeds Strategy, owned by the Environment and Invasives Committee, provides national guidance on weed management. |
| Weed Science Society of Japan (WSSJ) | WSSJ aims to contribute to the prevention of weed damage and the utilization of weed value by providing the chance for research presentation and information exchange. |
Need More Details on Market Definition?
Ask a Question
Research Methodology
Mordor Intelligence follows a four-step methodology in all our reports.
- Step-1: Identify Key Variables: In order to build a robust forecasting methodology, the variables and factors identified in Step-1 are tested against available historical market numbers. Through an iterative process, the variables required for market forecast are set and the model is built on the basis of these variables.
- Step-2: Build a Market Model: Market-size estimations for the forecast years are in nominal terms. Inflation is not a part of the pricing, and the average selling price (ASP) is kept constant throughout the forecast period.
- Step-3: Validate and Finalize: In this important step, all market numbers, variables and analyst calls are validated through an extensive network of primary research experts from the market studied. The respondents are selected across levels and functions to generate a holistic picture of the market studied.
- Step-4: Research Outputs: Syndicated Reports, Custom Consulting Assignments, Databases & Subscription Platforms

Get More Details On Research Methodology
Download PDF


