Market Overview
| Study Period | 2017 - 2030 |
|---|---|
| Market Size (2025) | USD 1.10 Billion |
| Market Size (2030) | USD 1.40 Billion |
| Growth Rate (2025 - 2030) | 4.97% CAGR |
| Fastest Growing Market | South America |
| Largest Market | South America |
| Market Concentration | Low |
Major Players
*Disclaimer: Major Players sorted in no particular order Image © Mordor Intelligence. Reuse requires attribution under CC BY 4.0. |
|

Molluscicides Market Analysis by Mordor Intelligence
The global molluscicides market size reaches USD 1.1 billion in 2025 and is forecast to climb to USD 1.4 billion by 2030 at a 4.97% compound annual growth rate (CAGR). Climate-related spikes in slug and snail outbreaks, the phase-out of high-toxicity ingredients, and wider use of precision agriculture tools underpin growth in the molluscicide market. Growers of rice, specialty fruits, and greenhouse vegetables increasingly rely on gastropod control products to safeguard profit margins, and regulators in North America and Europe continue to fast-track low-risk active ingredients such as iron phosphate and sodium ferric ethylenediaminetetraacetate. South America leads volume demand on the back of invasive Pomacea species in rice fields, while Asia-Pacific accelerates adoption as controlled-environment horticulture gains ground. Although iron-based baits capture share from legacy metaldehyde products, biological nematode and botanical solutions are also winning acreage as part of integrated pest management programs. Fragmented supplier bases, heterogeneous compliance rules, and the steady entry of biological innovators keep competitive dynamics intense in the molluscicide market.
Key Report Takeaways
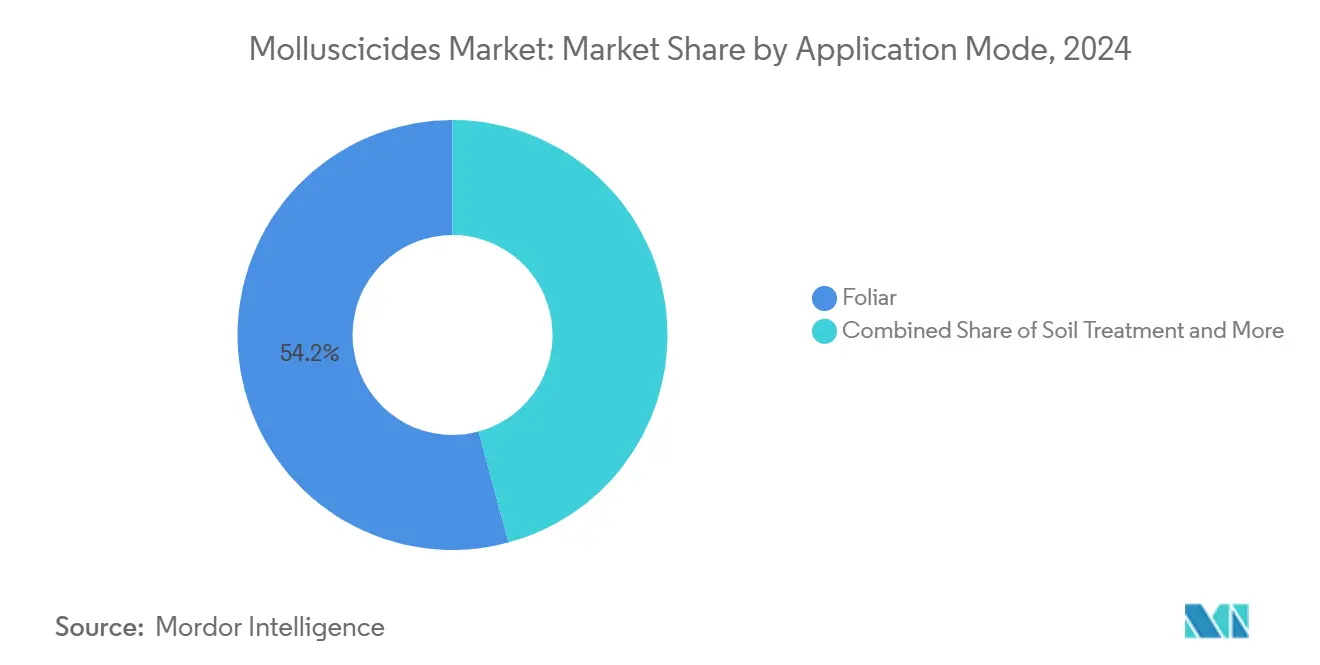
- By application mode, foliar sprays held 54.2% of the molluscicides market share in 2024 and are projected to expand at a 5.1% CAGR through 2030.
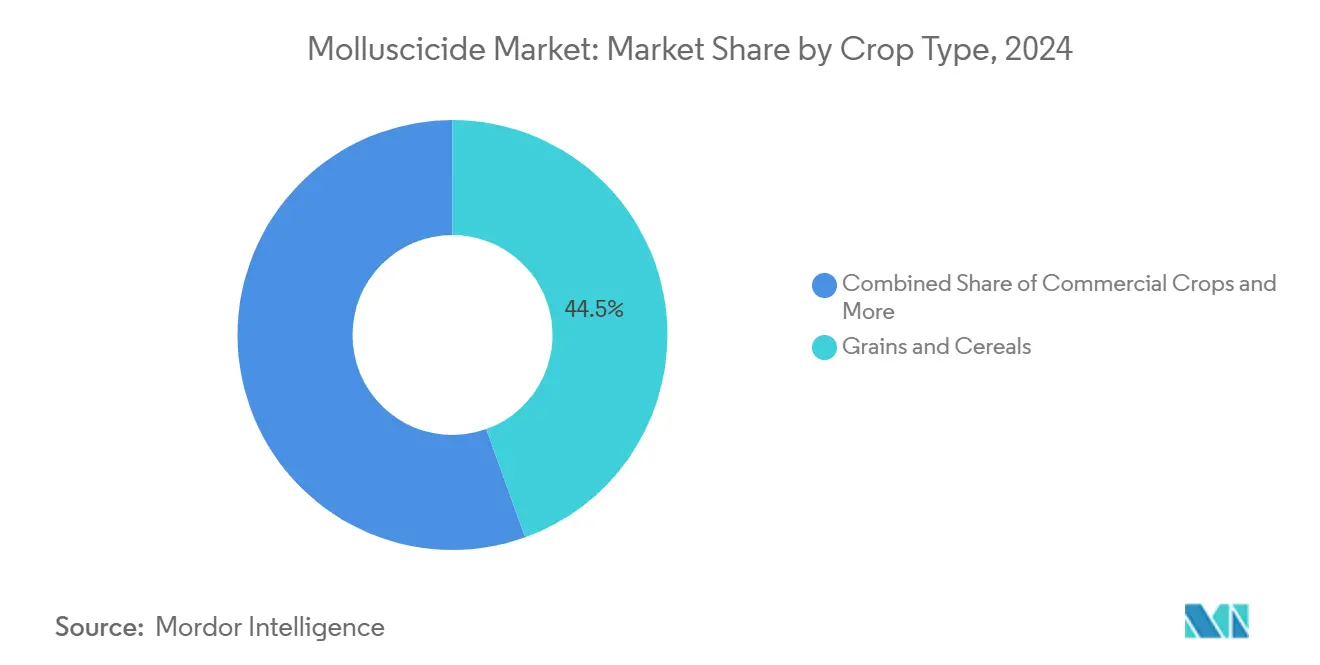
- By crop type, grains and cereals captured a 44.5% share of the molluscicides market size in 2024, while commercial crops are poised for the fastest 5.5% CAGR to 2030.
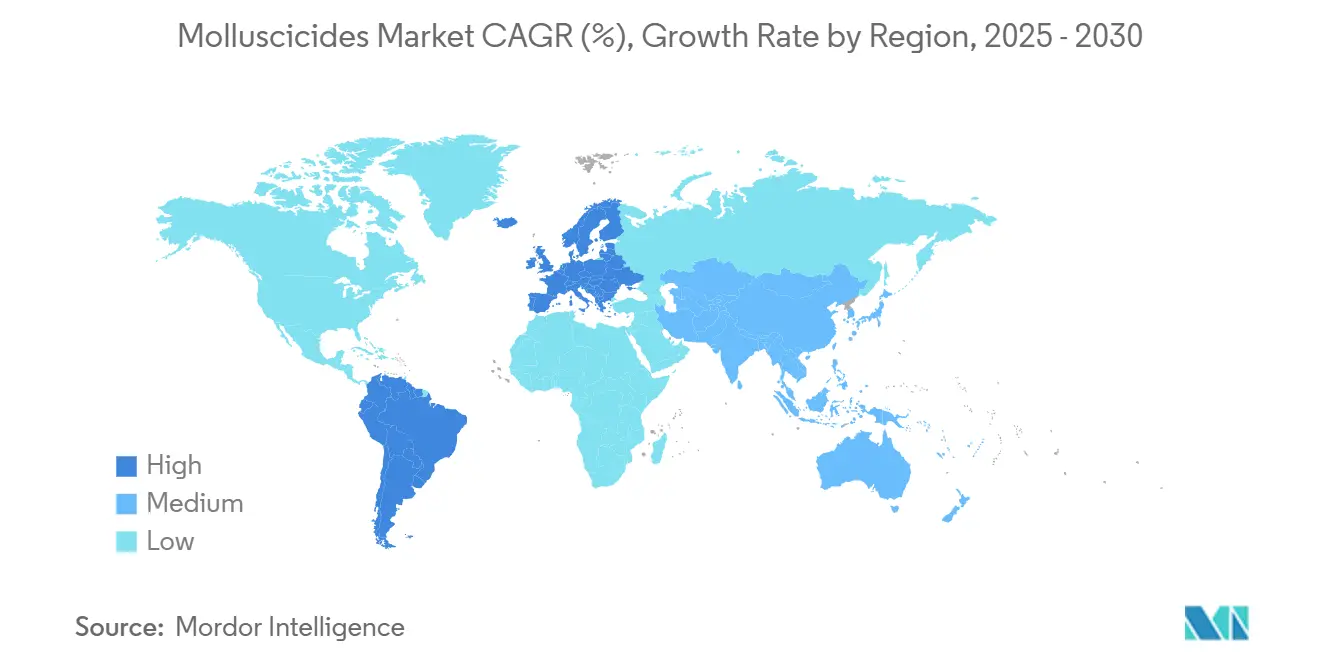
- By geography, South America commanded 36.5% of the molluscicides market in 2024, with the region is advancing at a 6.1% CAGR through 2030.
Global Molluscicides Market Trends and Insights
Drivers Impact Analysis
| Driver | (~) % Impact on CAGR Forecast | Geographic Relevance | Impact Timeline |
|---|---|---|---|
| Growing demand for high-value horticulture crops | +0.8% | Global, concentrated in North America and Europe | Medium term (2-4 years) |
| Rising adoption of integrated pest management programs | +0.7% | Global, led by developed markets | Long term (≥ 4 years) |
| Climate-change-driven spike in slug and snail outbreaks | +0.9% | Global, especially temperate zones | Short term (≤ 2 years) |
| Regulatory approvals of newer low-toxicity actives | +0.6% | Primarily North America and Europe | Medium term (2-4 years) |
| Expansion of protected cultivation acreage | +0.5% | Asia-Pacific core, spillover to Middle East and Africa | Long term (≥ 4 years) |
| Precision-ag technology enabling site-specific baiting | +0.4% | North America and Europe | Long term (≥ 4 years) |
| Source: Mordor Intelligence | |||
Growing Demand for High-Value Horticulture Crops
The rapid rise of greenhouse tomatoes, peppers, cucumbers, and herbs pushes up the molluscicides market as growers protect crops that command premium shelf prices. Globally, protected cultivation areas expanded 15% in 2024, creating moist microclimates that accelerate gastropod reproduction. Organic Materials Review Institute (OMRI)-listed iron phosphate fits certification rules, and vertical farms use precision sprayers that meter bait only where sensors detect slug trails. Higher margins justify multiple in-season applications, and cloud-based dashboards let managers calculate per-square-foot savings from stronger efficacy and reduced crop blemishes.[1]Source: Renae Moran, “Protected Cultivation Area Trends,” Michigan State University Extension, canr.msu.edu
Climate-Change-Driven Spike in Slug and Snail Outbreaks
Warmer winters and wetter summers lengthen gastropod breeding cycles, with 2024 field surveys in temperate regions recording 20-30% higher slug populations versus the five-year average. Golden apple snail incursions have reached the southern United States and parts of Mediterranean Europe, threatening rice and leafy greens. Waterlogged soils stress seedlings, and damaged leaf tissue invites secondary fungal infections. Growers, therefore, escalate gastropod control, pushing demand for weather-resistant iron phosphate granules that remain attractive after rainfall.
Rising Adoption of Integrated Pest Management Programs
Land-grant universities report a 40% jump in commercial grower enrollment in integrated pest management (IPM) courses during 2024. IPM frameworks deploy weather stations, pheromone traps, and pest threshold models, permitting site-specific molluscicide programs rather than calendar spraying. Lower active-ingredient load aligns with public pressure to reduce pesticide footprints, and drones equipped with optical sensors now toggle bait release only on slug hotspots. Environmental Protection Agency (EPA) field trials show that IPM-led programs cut total active ingredient usage by 25% while preserving crop yields.[2]Source: Paul Jepson, “Integrated Pest Management Adoption Metrics,” Oregon State University Extension, extension.oregonstate.edu
Regulatory Approvals of Newer Low-Toxicity Actives
The Environmental Protection Agency (EPA) classified iron phosphate and sodium ferric ethylenediaminetetraacetate as reduced-risk under its expedited review pathway, while the European Food Safety Authority (EFSA) extended iron phosphate approval to 2030. These regulatory wins allow manufacturers to rationalize production lines away from phased-out metaldehyde. Start-ups also pursue plant-derived compounds that satisfy zero-maximum-residue benchmarks. Harmonized residue limits ease export hurdles, encouraging multinational agrochemical firms to launch identical labels in several continents with minimal formulation changes.[3]Source: Environmental Protection Agency, “Pesticide Registration,” EPA, epa.gov
Restraints Impact Analysis
| Restraint | (~) % Impact on CAGR Forecast | Geographic Relevance | Impact Timeline |
|---|---|---|---|
| Metaldehyde bans and tightening residue limits | -0.7% | Europe and North America | Short term (≤ 2 years) |
| Availability of cost-effective biological and cultural controls | -0.5% | Global | Medium term (2-4 years) |
| Raw-material price volatility for iron-based formulations | -0.4% | Global | Short term (≤ 2 years) |
| Breeding of mollusk-resistant crop cultivars | -0.3% | Global, gradual adoption | Long term (≥ 4 years) |
| Source: Mordor Intelligence | |||
Metaldehyde Bans and Tightening Residue Limits
The United Kingdom removed metaldehyde registrations in 2022, eliminating roughly 15% of European demand for the active ingredient. EFSA confirmed that renewal will cease in 2026, prompting rapid stock depletion and forcing growers to pivot to iron phosphate. Municipal water boards increasingly detect metaldehyde exceedances that breach drinking-water standards, leading to stricter distribution license conditions. Manufacturers, therefore, retire metaldehyde packaging lines or retrofit them for ferric baits, incurring capital expenditure and short-term supply bottlenecks.
Availability of Cost-Effective Biological and Cultural Controls
Entomopathogenic nematodes such as Phasmarhabditis hermaphrodita kill slugs within seven days, and botanical extracts from Chimonanthus species reach 90% mortality in laboratory assays. These options cost 30-40% less per hectare than synthetic granules in small-plot systems, which encourages organic and low-input growers to shift purchases. Copper tape, diatomaceous earth, and raised-bed design further lower gastropod pressure in market gardens, trimming addressable demand for chemical solutions.
Segment Analysis
By Application Mode: Foliar Applications Lead Precision Delivery
Foliar spraying generated the largest revenue slice in 2024, reflecting 54.2% of the molluscicides market and underpinned by broad compatibility with air-blast sprayers, drones, and tractor-mounted booms. This delivery route posts a 5.1% forecast CAGR due to GPS-guided systems that overlay slug population heat maps on variable-rate prescriptions. Precision modules save 15% active ingredient per hectare and reduce collateral effects on earthworms, an ecosystem metric increasingly tracked by certification auditors. Soil treatments follow in volume among high-value horticulture, where pre-plant drenches prevent seedling girdling. Chemigation gains in greenhouse peppers and cucumbers, leveraging drip lines for uniform distribution. Fumigation remains a niche, quick-knockdown choice in ornamentals and mushroom houses.
Grower preference for foliar products stems from their rapid visible impact, which aids scouting decisions for subsequent thresholds. Adoption of corrosion-resistant nozzles further prevents clogging from iron granule dust, minimizing downtime. Manufacturers respond by formulating wetter-stable pellets with food-grade binders, extending field persistence even in monsoon-prone banana plantations. As drones scale beyond pilot projects, remote operators schedule sunset flights when slugs emerge, concentrating bait along row edges and reducing application to less than one-tenth of canopy area, a model that sustains profitability in the molluscicides market.
Note: Segment shares of all individual segments available upon report purchase
Get Detailed Market Forecasts at the Most Granular Levels
Download PDF
By Crop Type: Commercial Crops Drive Innovation
Grains and cereals accounted for 44.5% of the molluscicides market size in 2024, driven by large rice acreages where golden apple snail infestations can wipe out seedling stands in just three nights. Commercial crops post the quickest 5.5% CAGR as strawberries, lettuce, and cut flowers fetch high retail premiums that warrant rigorous pest exclusion. Indoor lettuce farms specify zero tolerance thresholds for slugs, prompting weekly baiting that commands double the cost per acre compared to field grains. Fruits and vegetables attract steady adoption, driven by export phytosanitary standards that penalize leaf damage.
The spending power of commercial horticulture inspires research into slow-release microgranules that resist breakdown under continuous irrigation. Patent filings for encapsulated ferric derivatives show reduced plant contact discoloration, unlocking use in hydroponic channels. Meanwhile, pulses and oilseeds edge into the spotlight as plant-based protein processors demand spotless chickpea and lentil kernels for ready-to-eat meals. With climate stress pushing slug migration into dryland bean fields, acreage protected by iron-based products inches upward, ensuring a diverse and resilient client base for the molluscicides market.
Get Detailed Market Forecasts at the Most Granular Levels
Download PDF
Geography Analysis
South America captured 36.5% share of the molluscicides market in 2024 and tops the regional growth chart with a 6.1% CAGR through 2030. Argentine and Brazilian rice fields suffer yield losses above 20% when invasive Pomacea canaliculata escapes flooded irrigation blocks. Local agronomists recommend dual in-season baiting, and governments support cost-sharing programs, allowing adoption even among smallholders. Chilean berry exporters also invest in protected-cultivation tunnels, where iron phosphate meets the strict residue ceilings demanded by the United States' chain grocers.
Asia-Pacific follows as a high-potential zone. China, India, and Vietnam collectively account for more than half of the global paddy area, and field demonstrations financed by extension agencies have revealed that two properly timed applications can reduce juvenile snail densities by 80%. Japanese greenhouse strawberry acreage increases by 6% annually, and producers favor sodium ferric ethylenediaminetetraacetate due to its minimal mammalian toxicity rating. Protected farms in South Korea trial robotic pellet dispensers synced with night-vision cameras that trigger after spotting reflective slug mucus trails.
North America remains a mature but technology-rich market. California artichoke and leafy-green growers deploy drone spot treatments and are early adopters of biological nematode sachets. The United States Environmental Protection Agency maintains streamlined registrations for reduced-risk actives, protecting product pipelines. Europe experiences flat volume after metaldehyde rescindment, yet demand stabilizes as iron phosphate granules achieve parity in cost-per-slug-kill metrics. Middle East and African demand climbs from a low base as Gulf hydroponic farms protect lettuce racks from imported snail eggs hitchhiking on rockwool cubes, and Kenyan cut-flower estates expand slug monitoring in rain-fed valleys.
Get Analysis on Important Geographic Markets
Download PDF
Competitive Landscape
The molluscicides market is highly fragmented, with the five largest manufacturers holding a minor combined revenue share. Bayer, BASF, Syngenta, American Vanguard, and UPL focus on iron phosphate and biological diversification while pruning metaldehyde portfolios to comply with new residue thresholds. Regional specialists, such as Certis and Arxada, cultivate dealer intimacy and can tailor label language to local languages more quickly than their global peers, thereby bolstering brand loyalty among smallholders.
Start-ups funded by venture capital are pursuing fermentation-derived actives and microencapsulation methods to extend residual activity in humid tropical regions. Strategic moves revolve around distribution expansion and digital integration. UPL acquired PT Excel Crop Care Indonesia in October 2024, adding 1,200 district-level retail nodes and immediate access to rice-heavy islands. American Vanguard secured United States Environmental Protection Agency registration for a weather-proof iron phosphate in June 2024, citing a 30% higher rain-fast score that supports adoption in monsoon-exposed sugarcane.
Nufarm struck fermentation alliances to shorten biological development timelines, and PI Industries launched an Internet of Things sensor suite that automates bait release only when humidity and temperature lines cross slug emergence thresholds. Patent search trends reveal a surge in filings for biodegradable carrier matrices and multi-mode botanical blends, highlighting continuous innovation pressure across the molluscicide market.
Molluscicides Industry Leaders
-
American Vanguard Corporation
-
Arxada
-
Nufarm Ltd
-
PI Industries
-
UPL Limited
- *Disclaimer: Major Players sorted in no particular order

Need More Details on Market Players and Competitors?
Download PDF
Recent Industry Developments
- May 2025: De Sangosse has introduced IRONMAX PRO, a molluscicide containing 3% ferric phosphate IP max, formulated for effective and long-lasting control of slugs and snails. The product features a patented Colzactive attractant, which increases bait attractiveness and consumption, disrupting pest metabolism through iron overload. Certified for use in organic agriculture, it is approved in Portugal for most crops, excluding potatoes and citrus, with a maximum of four applications per year.
- April 2025: Feralla, a newly developed active ingredient for mollusc control, has been approved by the EU for use in crop protection. It introduces a unique mode of action against slugs and snails, supporting sustainable agriculture across Europe.
- August 2024: Cellora announced that its new molluscicide has been chosen for trials by the Australian grain industry due to its potential for sustainable control of slugs and snails. The product is designed to perform effectively under high-pressure pest conditions while supporting regenerative agriculture objectives. This selection underscores the increasing demand for innovative and environmentally friendly pest control solutions.
Global Molluscicides Market Report Scope
Chemigation, Foliar, Fumigation, Soil Treatment are covered as segments by Application Mode. Commercial Crops, Fruits & Vegetables, Grains & Cereals, Pulses & Oilseeds, Turf & Ornamental are covered as segments by Crop Type. Africa, Asia-Pacific, Europe, North America, South America are covered as segments by Region.
Application Mode
| Chemigation |
| Foliar |
| Fumigation |
| Soil Treatment |
Crop Type
| Commercial Crops |
| Fruits and Vegetables |
| Grains and Cereals |
| Pulses and Oilseeds |
| Turf and Ornamental |
Geography
| Africa | By Country | South Africa |
| Rest of Africa | ||
| Asia-Pacific | By Country | Australia |
| China | ||
| India | ||
| Indonesia | ||
| Japan | ||
| Myanmar | ||
| Pakistan | ||
| Philippines | ||
| Thailand | ||
| Vietnam | ||
| Rest of Asia-Pacific | ||
| Europe | By Country | France |
| Germany | ||
| Italy | ||
| Netherlands | ||
| Russia | ||
| Spain | ||
| Ukraine | ||
| United Kingdom | ||
| Rest of Europe | ||
| North America | By Country | Canada |
| Mexico | ||
| United States | ||
| Rest of North America | ||
| South America | By Country | Argentina |
| Brazil | ||
| Chile | ||
| Rest of South America |
| Application Mode | Chemigation | ||
| Foliar | |||
| Fumigation | |||
| Soil Treatment | |||
| Crop Type | Commercial Crops | ||
| Fruits and Vegetables | |||
| Grains and Cereals | |||
| Pulses and Oilseeds | |||
| Turf and Ornamental | |||
| Geography | Africa | By Country | South Africa |
| Rest of Africa | |||
| Asia-Pacific | By Country | Australia | |
| China | |||
| India | |||
| Indonesia | |||
| Japan | |||
| Myanmar | |||
| Pakistan | |||
| Philippines | |||
| Thailand | |||
| Vietnam | |||
| Rest of Asia-Pacific | |||
| Europe | By Country | France | |
| Germany | |||
| Italy | |||
| Netherlands | |||
| Russia | |||
| Spain | |||
| Ukraine | |||
| United Kingdom | |||
| Rest of Europe | |||
| North America | By Country | Canada | |
| Mexico | |||
| United States | |||
| Rest of North America | |||
| South America | By Country | Argentina | |
| Brazil | |||
| Chile | |||
| Rest of South America | |||
Need A Different Region or Segment?
Customize Now
Market Definition
- Function - Molluscicides are chemicals used to control or prevent mollusks from damaging the crop and prevent yield loss.
- Application Mode - Foliar, Seed Treatment, Soil Treatment, Chemigation, and Fumigation are the different type of application modes through which crop protection chemicals are applied to the crops.
- Crop Type - This represents the consumption of crop protection chemicals by Cereals, Pulses, Oilseeds, Fruits, Vegetables, Turf, and Ornamental crops.
| Keyword | Definition |
|---|---|
| IWM | Integrated weed management (IWM) is an approach to incorporate multiple weed control techniques throughout the growing season to give producers the best opportunity to control problematic weeds. |
| Host | Hosts are the plants that form relationships with beneficial microorganisms and help them colonize. |
| Pathogen | A disease-causing organism. |
| Herbigation | Herbigation is an effective method of applying herbicides through irrigation systems. |
| Maximum residue levels (MRL) | Maximum Residue Limit (MRL) is the maximum allowed limit of pesticide residue in food or feed obtained from plants and animals. |
| IoT | The Internet of Things (IoT) is a network of interconnected devices that connect and exchange data with other IoT devices and the cloud. |
| Herbicide-tolerant varieties (HTVs) | Herbicide-tolerant varieties are plant species that have been genetically engineered to be resistant to herbicides used on crops. |
| Chemigation | Chemigation is a method of applying pesticides to crops through an irrigation system. |
| Crop Protection | Crop protection is a method of protecting crop yields from different pests, including insects, weeds, plant diseases, and others that cause damage to agricultural crops. |
| Seed Treatment | Seed treatment helps to disinfect seeds or seedlings from seed-borne or soil-borne pests. Crop protection chemicals, such as fungicides, insecticides, or nematicides, are commonly used for seed treatment. |
| Fumigation | Fumigation is the application of crop protection chemicals in gaseous form to control pests. |
| Bait | A bait is a food or other material used to lure a pest and kill it through various methods, including poisoning. |
| Contact Fungicide | Contact pesticides prevent crop contamination and combat fungal pathogens. They act on pests (fungi) only when they come in contact with the pests. |
| Systemic Fungicide | A systemic fungicide is a compound taken up by a plant and then translocated within the plant, thus protecting the plant from attack by pathogens. |
| Mass Drug Administration (MDA) | Mass drug administration is the strategy to control or eliminate many neglected tropical diseases. |
| Mollusks | Mollusks are pests that feed on crops, causing crop damage and yield loss. Mollusks include octopi, squid, snails, and slugs. |
| Pre-emergence Herbicide | Preemergence herbicides are a form of chemical weed control that prevents germinated weed seedlings from becoming established. |
| Post-emergence Herbicide | Postemergence herbicides are applied to the agricultural field to control weeds after emergence (germination) of seeds or seedlings. |
| Active Ingredients | Active ingredients are the chemicals in pesticide products that kill, control, or repel pests. |
| United States Department of Agriculture (USDA) | The Department of Agriculture provides leadership on food, agriculture, natural resources, and related issues. |
| Weed Science Society of America (WSSA) | The WSSA, a non-profit professional society, promotes research, education, and extension outreach activities related to weeds. |
| Suspension concentrate | Suspension concentrate (SC) is one of the formulations of crop protection chemicals with solid active ingredients dispersed in water. |
| Wettable powder | A wettable powder (WP) is a powder formulation that forms a suspension when mixed with water prior to spraying. |
| Emulsifiable concentrate | Emulsifiable concentrate (EC) is a concentrated liquid formulation of pesticide that needs to be diluted with water to create a spray solution. |
| Plant-parasitic nematodes | Parasitic Nematodes feed on the roots of crops, causing damage to the roots. These damages allow for easy plant infestation by soil-borne pathogens, which results in crop or yield loss. |
| Australian Weeds Strategy (AWS) | The Australian Weeds Strategy, owned by the Environment and Invasives Committee, provides national guidance on weed management. |
| Weed Science Society of Japan (WSSJ) | WSSJ aims to contribute to the prevention of weed damage and the utilization of weed value by providing the chance for research presentation and information exchange. |
Need More Details on Market Definition?
Ask a Question
Research Methodology
Mordor Intelligence follows a four-step methodology in all our reports.
- Step-1: Identify Key Variables: In order to build a robust forecasting methodology, the variables and factors identified in Step-1 are tested against available historical market numbers. Through an iterative process, the variables required for market forecast are set and the model is built on the basis of these variables.
- Step-2: Build a Market Model: Market-size estimations for the forecast years are in nominal terms. Inflation is not a part of the pricing, and the average selling price (ASP) is kept constant throughout the forecast period.
- Step-3: Validate and Finalize: In this important step, all market numbers, variables and analyst calls are validated through an extensive network of primary research experts from the market studied. The respondents are selected across levels and functions to generate a holistic picture of the market studied.
- Step-4: Research Outputs: Syndicated Reports, Custom Consulting Assignments, Databases & Subscription Platforms

Get More Details On Research Methodology
Download PDF


