
Model-based Enterprise Market Size and Share
Market Overview
| Study Period | 2020 - 2031 |
|---|---|
| Market Size (2026) | USD 29.94 Billion |
| Market Size (2031) | USD 60.38 Billion |
| Growth Rate (2026 - 2031) | 15.06 % |
| Fastest Growing Market | Asia Pacific |
| Largest Market | North America |
| Market Concentration | Medium |
Major Players *Disclaimer: Major Players sorted in no particular order Image © Mordor Intelligence. Reuse requires attribution under CC BY 4.0. | |
Model-based Enterprise Market Analysis by Mordor Intelligence
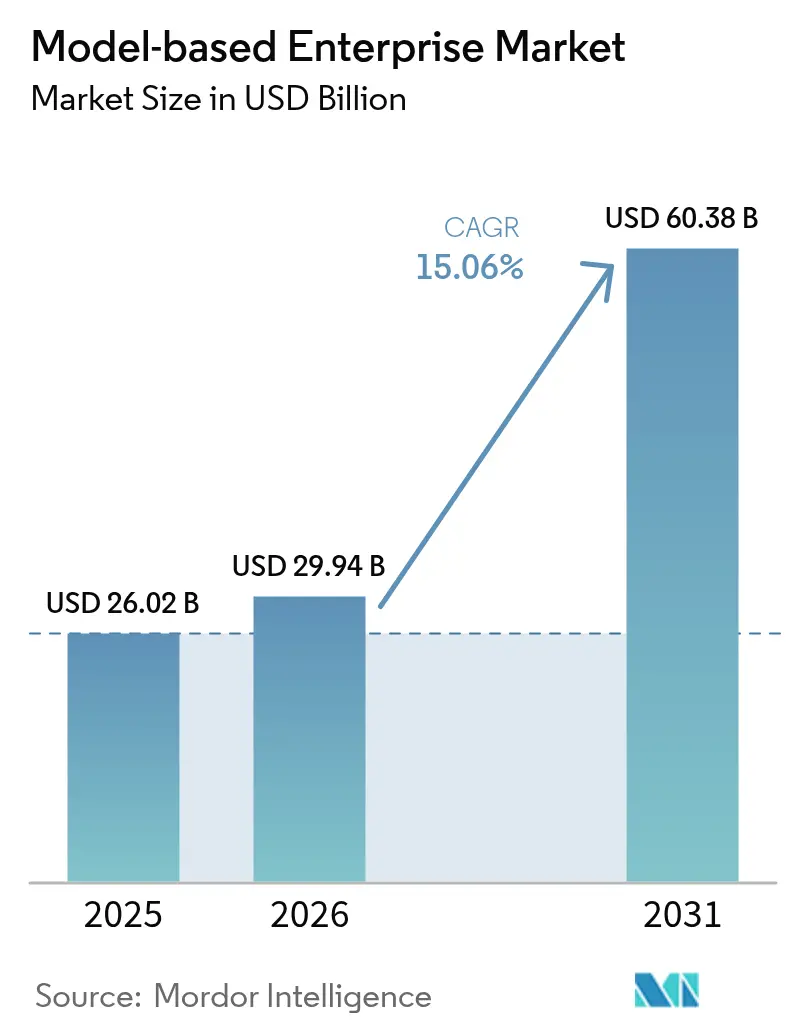
The model-based enterprise market size is expected to grow from USD 26.02 billion in 2025 to USD 29.94 billion in 2026 and is forecast to reach USD 60.38 billion by 2031 at 15.06% CAGR over 2026-2031. This momentum is anchored in the shift from document-centric workflows to coherent digital threads that connect design, engineering, manufacturing, and service functions. The United States Department of Defense requirement that digital models act as the single authoritative data source is spurring swift uptake among aerospace and defense contractors. Automotive manufacturers are adopting similar practices to compress electric-vehicle development timelines, while cloud-native product-lifecycle-management suites are lowering barriers for small and medium manufacturers in Asia-Pacific. Vendors are investing in AI-driven simulation, additive-manufacturing quality loops, and integrated digital twins to deliver faster ROI, yet many users still grapple with workforce reskilling costs and data-interoperability gaps.
Key Report Takeaways
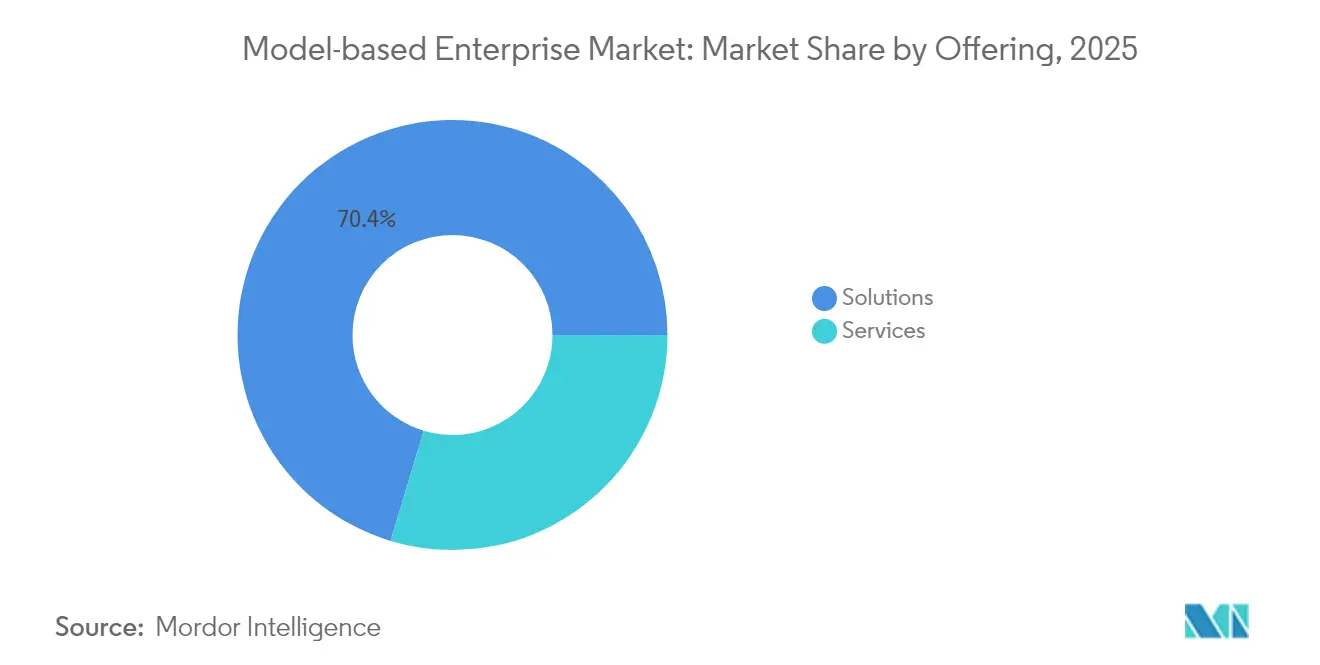
- By offering, Solutions held 70.35% of 2025 revenue, whereas Services are projected to post the fastest 17.46% CAGR through 2031.
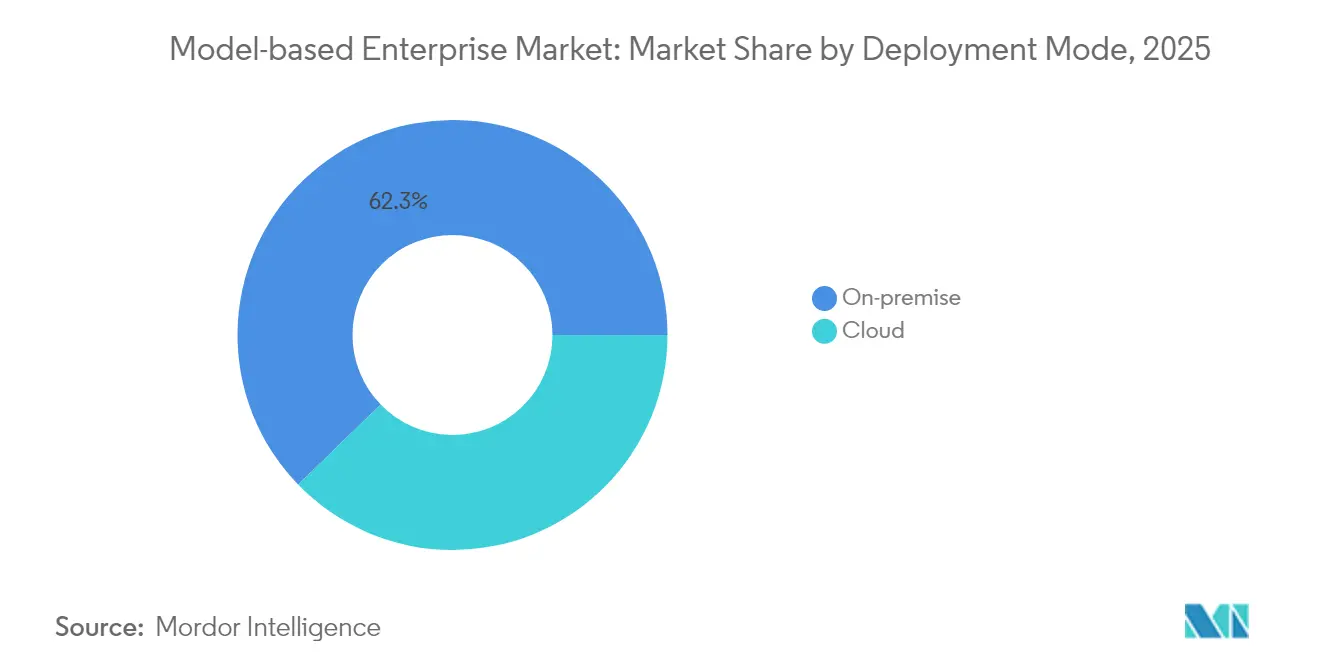
- By deployment mode, on-premise installations commanded 62.25% share of the model-based enterprise market size in 2025; cloud deployments are growing at an 17.96% CAGR.
- By end-user industry, aerospace & defense accounted for 32.55% share of the model-based enterprise market size in 2025, and automotive is advancing at a 15.86% CAGR.
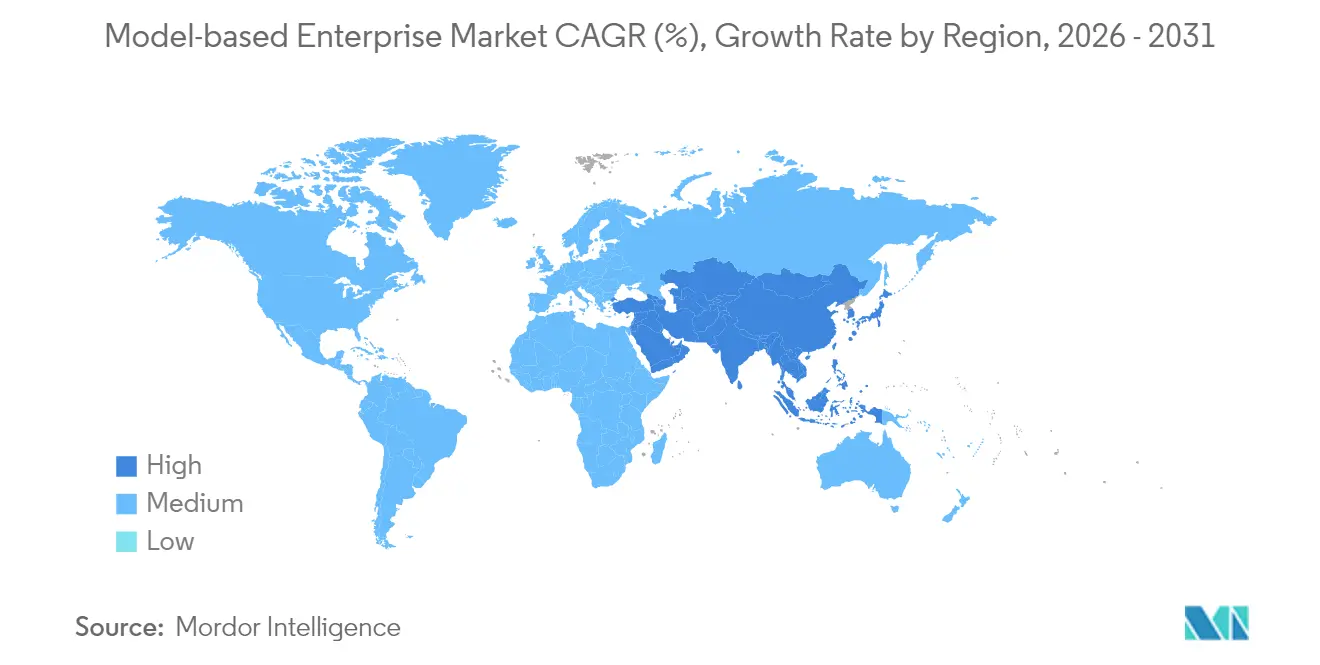
- By geography, North America led with 37.62% of model-based enterprise market share in 2025, while Asia-Pacific is set to expand at an 18.34% CAGR over 2026-2031.
Note: Market size and forecast figures in this report are generated using Mordor Intelligence’s proprietary estimation framework, updated with the latest available data and insights as of 2026.
Market Trends and Insights
Drivers Impact Analysis of Model-based Enterprise Market*
| Driver | % Impact on CAGR Forecast | Geographic Relevance | Impact Timeline |
|---|---|---|---|
| DoD Digital Engineering Mandates | +3.8% | North America with spillover to Europe & Asia-Pacific | Medium term (2-4 years) |
| Automotive OEM Shift to Full-3D Digital Thread | +3.4% | Europe, North America, China | Medium term (2-4 years) |
| Surge in Cloud-Native PLM Suites for SMBs | +2.8% | Asia-Pacific (Japan, South Korea, India) | Short term (≤ 2 years) |
| ROI From Aerospace MRO Turn-Around-Time Reduction | +2.3% | North America & Europe | Medium term (2-4 years) |
| Integrating MBD With Additive-Manufacturing Quality | +1.8% | North America, Europe, advanced Asia hubs | Long term (≥ 4 years) |
| Source: Mordor Intelligence | |||
DoD Digital Engineering Mandates Accelerating Adoption in North America
Defense contractors must now treat 3D models as the single source of truth for design, analysis, sourcing, and sustainment decisions. Close to 300,000 suppliers have started updating processes, software stacks, and cybersecurity safeguards to stay eligible for future contracts. Uptake is spilling over to commercial aerospace as shared subcontractors align with mandate-compliant workflows. Tool vendors are responding with packaged compliance templates and automated model-based definition (MBD) checkers that cut documentation time and enhance traceability.
Automotive OEM Shift to Full-3D Digital Thread for EV Platforms
Battery-electric programs rely on concurrent design of mechanical, electrical, and thermal systems. Deploying a unified 3D digital thread has allowed leading automakers to shrink platform cycles from 72 months to 36 months while improving traceability.[1] The integration of digital twins with model-based systems engineering lets teams simulate energy flow, crash behavior, and battery degradation early, curbing late redesigns and warranty risk. These gains drive widespread rollouts across Europe, North America, and China.
Surge in Cloud-Native PLM Suites Enabling SMB Access in Asia-Pacific
Cloud deployment removes the need for heavy servers and specialized IT staff. Typical migrations complete in 45–90 days, enabling manufacturers across Japan, South Korea, and India to deploy advanced PLM and MBD with limited capital outlay.[2] Pay-as-you-go pricing and automated updates lower lifetime ownership costs, making enterprise-grade digital-thread capabilities accessible to the region’s vast SMB base. Rapid onboarding fuels the region’s position as the fastest-growing adopter.
ROI From Aerospace MRO Turn-Around-Time Reduction
Digital twins embedded with predictive-maintenance algorithms cut unscheduled maintenance and improve fleet availability by 15%, with similar savings in direct costs.[3] Airlines and MRO providers now pull configuration-managed 3D models to forecast part life and optimize spares provisioning. Improved data fidelity raises maintenance-record accuracy to roughly 97%, supporting air-worthiness audits and cutting penalty risks.
Restraints Impact Analysis of Model-based Enterprise Market*
| Restraint | (~) % Impact on CAGR Forecast | Geographic Relevance | Impact Timeline |
|---|---|---|---|
| Data-Interoperability Gaps Between Legacy CAD and New MBD Standards | -2.3% | Global, stronger in mature manufacturing regions | Medium term (2-4 years) |
| High Up-Front Workforce Reskilling Costs | -1.8% | Global, acute where skill shortages persist | Short term (≤2 years) |
| Cyber-Security Concerns Over IP in Cloud Deployments | -1.5% | Global, especially defense, aerospace, automotive | Medium term (2-4 years) |
| Multi-Tier Supply-Chain Compliance Complexity | -1.2% | North America, Europe, Asia-Pacific export hubs | Medium term (2-4 years) |
| Source: Mordor Intelligence | |||
Data-Interoperability Challenges Hinder Seamless Integration
Roughly 65% of engineering projects still encounter delays when transforming historical CAD files into feature-rich, MBD-ready models.[4] Geometry translation alone is not enough; teams must also preserve features, constraints, and linked drawings built over decades. Specialized conversion tools are improving, yet enterprise-wide migrations remain resource intensive and carry risk of data loss that can stall digital-thread initiatives.
Workforce Reskilling Creates Implementation Hurdle
Moving from document-centric to model-centric workflows changes every daily task, from design review to shop-floor inspection. Firms must fund extensive training programs, refresh standard operating procedures, and realign performance metrics. Resistance to change is common, especially in organizations where experienced staff have honed 2D practices for decades. Comprehensive change-management plans and incremental rollouts are proving essential.
*Our forecasts treat driver/restraint impacts as directional, not additive. The impact forecasts reflect baseline growth, mix effects, and variable interactions.
Model-based Enterprise Market Segment Analysis
By Offering:
Services Outpace Solutions GrowthThe Solutions segment generated 70.35% of 2025 revenue, underscoring its role as the backbone of most deployments. Service engagements, however, are registering a 17.46% CAGR as enterprises confront the complexity of rolling out model-based practices at scale. Service providers are embedding AI to automate data migration and validation, shortening time-to-value and boosting confidence in model accuracy. Training and certification packages focused on digital-thread skills are rising in demand, highlighting the persistent talent gap. The influx of specialized service firms is broadening options for mid-market manufacturers seeking guidance without the expense of large consulting teams.
Rising subscription models are shifting revenue from perpetual software toward continuous service relationships tied to performance metrics and outcome-based contracts. Predictive analytics applied within maintenance and support agreements can flag integration glitches before they disrupt production. These capabilities reinforce client reliance on trusted partners, sustaining the upward trajectory of the Services share within the model-based enterprise market.

By Solution Type:
Digital-Twin & Simulation Gaining MomentumProduct-lifecycle-management platforms remain the foundation of most implementations, but the Digital-Twin & Simulation segment is gaining prominence as organizations seek closed-loop feedback between design and operation. Real-time sensor data feeding high-fidelity models creates self-updating digital twins that guide maintenance, optimize performance, and extend asset life. The convergence of simulation and systems engineering reduces rework by validating requirements early, a benefit that is especially acute in regulated domains such as aerospace and medical devices.
Visualization and collaboration tools are adding AR/VR overlays to facilitate immersive design reviews. Engineers, suppliers, and even field technicians can inspect the same model in real time, shrinking the decision window. CAD/CAM/CAE suites now embed product-manufacturing information directly in 3D geometry. This allows downstream software, including inspection planning and shop-floor metrology platforms, to consume a single data set, trimming translation steps and minimizing revision errors.
By Service Type:
Integration & Implementation Addresses ComplexityIntegration & Implementation services account for the largest slice of service revenue because aligning new PLM, simulation, and analytics layers with legacy ERP and MES systems is rarely straightforward. High-quality models that span the concept, design, production, and sustainment phases are essential to prevent data silos. As a result, service teams frequently deploy connectors, configure application-programming interfaces, and test digital-thread continuity across domains.
Consulting & Training engagements are expanding fastest as enterprises request road-maps, maturity assessments, and workforce enablement programs. Structured curricula covering model-based definition, systems engineering, and additive-manufacturing workflows help firms overcome cultural inertia. Support & Maintenance contracts are shifting toward proactive analytics, where service desks monitor usage metrics and flag anomalies before they escalate into downtime. Vendors that can blend all three service types-integration, consulting, and proactive support-are solidifying long-term client relationships.
By Deployment Mode:
Cloud Adoption Accelerates FlexibilityOn-premise deployments retained a 62.25% revenue share in 2025 because many firms already own significant data-center assets and must adhere to strict security controls. Even so, cloud solutions are growing at an 17.96% CAGR as software-as-a-service models show that updates, scalability, and cost predictability can outweigh perceived risks. Hybrid approaches let organizations keep sensitive data on-premise while using cloud compute for bursty simulation or real-time collaboration.
The arrival of containerized PLM and simulation micro-services enables consistent performance across private and public environments. In Asia-Pacific, small and mid-size enterprises increasingly adopt full cloud stacks because they lack legacy data centers. North-American and European multinationals often choose phased migrations, starting with supplier collaboration portals or engineering-change workflows before moving mission-critical CAD data to secure cloud vaults.
By End-User Industry:
Aerospace & Defense Leads ImplementationAerospace and Defense held 32.55% of 2025 revenue, reflecting strict regulatory requirements and the complexity of multi-year programs where digital continuity cuts risk. Budget commitments and the DoD mandate ensure stable demand for hardened, traceable, model-centric toolchains. Predictive simulation linked to digital twins accelerates test cycles, allowing contractors to meet performance targets while managing cost caps.
Automotive posted the fastest 15.86% CAGR as electrification and software-defined vehicles require cross-disciplinary collaboration. Unified 3D threads enable engineers to align battery thermal models with crash-worthiness targets and manufacturing constraints. Electronics & Hi-Tech, Construction & Infrastructure, and Power & Energy segments are also increasing their investments because digital twins promise shorter project schedules, lower rework, and better lifecycle management.
Geography Analysis
North America Model-based Enterprise Market
North America contributed 37.62% of 2025 revenue, supported by defense spending, a mature aerospace supply chain, and automakers seeking to accelerate electric-vehicle launches. Federal policies that enforce digital models as the official technical baseline are nudging even conservative contractors to modernize. Canada and Mexico participate through integrated supply chains that must also prove compliance, driving widespread adoption across the continent.
APAC Model-based Enterprise Market
Asia-Pacific is the fastest-growing region with an 18.34% CAGR over 2026-2031. Cloud-hosted PLM lowers entry barriers for Japan’s precision manufacturers, South Korea’s electronics champions, and India’s engineering-services providers. China’s investment in digital factories fuels demand for digital-thread solutions that can scale across vast production networks. Local governments promote smart-manufacturing grants, accelerating SMB participation.
Europe Model-based Enterprise Market
Europe maintains robust adoption driven by Germany’s Industrie 4.0 initiatives and France’s advanced aerospace programs. A United Kingdom digital-twin center in Belfast demonstrates national commitment to remain competitive in next-generation aircraft development. Sustainability regulations further encourage model-centric design to track carbon footprints and optimize resource use. Regional standards bodies collaborate on interoperability frameworks, smoothing cross-border collaboration.
Regulatory Landscape
Regulatory forces shaping model-based enterprise adoption center on government procurement requirements, evolving AI and data rules, and a growing body of interoperability standards. In the United States, the Department of Defense digital engineering mandate continues to position digital models as the authoritative technical baseline, and it is cascading across aerospace and defense supply chains. Contractors and suppliers are aligning toward traceable, model-centric workflows, while also tightening cybersecurity controls.
On the standards side, ISO/IEC/IEEE 24641:2023 provides a reference model for model-based systems and software engineering processes, while ASME MBE-1-2022 defines an architecture framework for structuring an MBE and its component systems. NISTs Model-Based Enterprise (MBE) program underpins measurement science and test methods that support manufacturing interoperability between software platforms and simulation models. In parallel, the EU AI Act introduces risk-tiered obligations, including transparency and human oversight, which shape how generative AI is embedded into engineering automation and digital-thread platforms used in model-based enterprise programs, particularly in regulated industries and across-border supply chains.
Competitive Landscape
Long-standing PLM providers-Siemens, Dassault Systèmes, and PTC-retain dominant positions by bundling CAD, PLM, simulation, and IoT analytics in unified suites. They are augmenting portfolios with AI-powered physics engines and cloud micro-services to improve scalability and accuracy. Challenger vendors such as Aras employ open architectures that ease integration with heterogeneous toolchains, appealing to enterprises wrestling with legacy data.
White-space opportunities lie in mid-market offerings that deliver robust digital-thread functions without enterprise-level complexity. Specialist firms focus on additive-manufacturing quality or model-based systems engineering templates, enabling faster domain-specific deployments. Customers increasingly judge vendors on their ability to supply outcome-oriented service bundles, training, and rapid pilot-to-production pathways, rather than on software features alone.
Manufacturers are both customers and innovators. Rolls-Royce’s connected-enterprise program uses model-based systems engineering to streamline design and service analytics. Partnerships such as Siemens and PhysicsX illustrate how incumbents embrace external AI expertise to refine simulation speed and accuracy. As cloud adoption rises, joint ventures between PLM vendors and hyperscale cloud providers are expected to intensify.
Model-based Enterprise Industry Leaders
-
Siemens AG
-
General Electric Company
-
PTC Inc.
-
Dassault Systèmes SE
-
SAP SE
- *Disclaimer: Major Players sorted in no particular order

Model-based Enterprise Market Companies Covered in this Report
- Siemens AG
- Dassault Systèmes SE
- PTC Inc.
- SAP SE
- Ansys, Inc.
- Autodesk Inc.
- IBM Corporation
- Oracle Corporation
- HCL Technologies Limited
- Aras Corporation
- Anark Corporation
- Hexagon AB
- Altair Engineering Inc.
- Ansys Inc.
- Rockwell Automation Inc.
- IFS AB
- Bentley Systems Inc.
- Capgemini SE
Market Opportunities and Future Outlook
Opportunities are expanding around standards-led interoperability and machine-readable downstream consumption of 3D product definition, where the bottleneck shifts from creating 3D models to making them verifiable and consumable by inspection, metrology, and manufacturing execution workflows. A clear marker is the June 2026 approval by ANSI of the Digital Metrology Standards Consortium (DMSC) Model-Based Characteristics v1.0 (MBC 1.0), which supports connecting model-based definition to automated inspection and Metrology 4.0 initiatives. ISO 10303-242:2025 (managed model-based 3D engineering) and the Prostep IVIP MBx Interoperability Forum work on STEP recommended practices also add pathways for multi-CAD and multi-tier supply chains that need consistent exchange of semantic PMI and configuration-managed product data.
Another area of demand is supplier enablement and compliance toolchains that operationalize MBE requirements beyond prime contractors, especially where mandates require a single source of truth across design, manufacturing, and sustainment. In April 2026, Lockheed Martin published an updated Model-Based Enterprise supply chain playbook to standardize technical data package collaboration, reinforcing uptake for packaged templates, validation routines, and service-led implementation for Tier 1 and Tier 2 suppliers. Enterprise programs are also broadening beyond aerospace into discrete manufacturing, supported by Siemens work with HD Hyundai on an integrated 3D data platform for shipbuilding processes and by automotive efforts to engineer EV programs on unified digital platforms, which increases demand for scalable cloud PLM, data governance, and integration services that connect legacy CAD/ERP/MES environments.
Recent Industry Developments in Model-based Enterprise Market
- May 2026: GE Aerospace expanded its partnership with Palantir Technologies to deploy agentic AI-powered solutions across production systems to improve military aircraft readiness. The initiative ties operational data and analytics more tightly to digital threads used in sustainment, reinforcing demand for model-centric data foundations in defense programs.
- April 2026: Siemens generally released the Eigen Engineering Agent, an AI designed for automation engineering that connects to TIA Portal and executes tasks based on project data structures and standards. By automating engineering activities using structured project data, it supports broader model-driven workflows that reduce manual rework in industrial programs.
- February 2026: PTC launched cloud-native Model-Based Definition capabilities in Onshape, enabling teams to embed manufacturing information directly in 3D models within its CAD and PDM environment. This strengthens cloud deployment pathways for MBD adoption and supports faster collaboration with suppliers and downstream manufacturing users.
Model-based Enterprise Market Report Scope and Research Methodology
Market Definition and Coverage
The model-based enterprise market is sized as the revenue generated from software and related services that help companies create, manage, and use model-based definitions, so a 3D product model becomes the main source of product and manufacturing information.
Scope exclusions: We exclude general engineering IT that is not tied to model-based definition workflows, along with internal labor, training-only spend, and hardware used to run these platforms.
Segments Covered in This Report
- By Offering
- Solutions
- Services
- By Solution Type
- PLM Software
- CAD/CAM/CAE
- Digital-Twin and Simulation
- Visualization and Collaboration
- By Service Type
- Integration and Implementation
- Consulting and Training
- Support and Maintenance
- By Deployment Mode
- On-premise
- Cloud
- Public Cloud
- Private Cloud
- Hybrid Cloud
- By End User Industry
- Aerospace and Defense
- Automotive
- Construction and Infrastructure
- Power and Energy
- Retail and CPG
- Electronics and Hi-Tech
- Marine and Offshore
- Other Industries
- By Geography
- North America
- United States
- Canada
- Mexico
- South America
- Brazil
- Argentina
- Chile
- Peru
- Rest of South America
- Europe
- Germany
- United Kingdom
- France
- Italy
- Spain
- Rest of Europe
- Asia-Pacific
- China
- Japan
- South Korea
- India
- Australia
- New Zealand
- Rest of Asia-Pacific
- Middle East
- United Arab Emirates
- Saudi Arabia
- Turkey
- Rest of Middle East
- Africa
- South Africa
- Rest of Africa
- North America
Data Sources, Market Sizing, and Validation
Desk Research
Desk research is used to map the demand environment and set realistic ranges for adoption and budgets before we finalize the model. Public sources such as the US Bureau of Labor Statistics, US Census Bureau trade and manufacturing series, Eurostat industrial production data, NIST digital manufacturing publications, and USITC import and export statistics were reviewed to understand engineering and manufacturing activity by region.
We also used company annual reports, earnings call transcripts, investor presentations, and technical papers published in peer reviewed journals to see how model-based definition is being deployed across product lifecycle teams. In a few places, paid subscriptions for company financials and intelligence, news and financials, and patent databases were used to cross-check revenue exposure and product positioning signals. These desk sources are not exhaustive, and other public references were used for data collection, validation, and clarification during the study.
Primary Interviews and Surveys
Primary work focused on practitioners who run digital engineering programs, along with solution leaders, implementation partners, and manufacturing engineering stakeholders who can describe budget timing and rollout sequencing. Inputs were gathered across APAC, EMEA, and the Americas to validate adoption pace, typical deal structures (software versus services), and how cloud deployments change average contract values over time.
Distribution of primary research fieldwork respondents
| Company type | Respondent position | Region |
|---|---|---|
| Top tier: 33% | CXOs: 12% | APAC: 47% |
| Mid tier: 47% | Functional/Unit leaders: 41% | EMEA: 30% |
| Smaller Players: 20% | Managers: 47% | Americas: 23% |
Market-Sizing & Forecasting
Sizing starts with a top-down build where engineering and manufacturing digitization spend pools are reconstructed by region, then filtered using model-based definition adoption and rollout intensity by end-user industry. Once that structure is in place, we corroborate totals with selective bottom-up checks using sampled vendor revenue exposure, channel and partner feedback, and a simple volume times ASP logic for common license and subscription motions, which helps adjust for over-counting.
Key inputs used in the model include the share of new product programs moving to 3D model-based definition, the services-to-software mix during initial rollouts, the cloud migration rate for engineering platforms, the number of active manufacturing sites under a digital thread program, and the typical refresh cycle of product data management and downstream authoring tools. Forecasting is primarily scenario analysis, since adoption is sensitive to program timing, compliance requirements in regulated industries, and enterprise budget cycles. Scenarios are then anchored to what interviewees expect for rollout pace and renewal behavior. Where bottom-up visibility is weaker, we apply conservative penetration bands and recheck them against observed deal sizes and implementation timelines from primary discussions.
Data Validation & Update Cycle
Validation is done through multiple passes, where outputs are compared against independent signals such as manufacturing and engineering software spending trends, regional industry activity, and the observed split of services versus recurring software revenue. If a value looks off, we trace the assumptions back to the driver level, then review the variance with another analyst before sign-off.
The report is refreshed annually, and interim updates are triggered when there are material changes such as major regulatory pushes, noticeable demand shocks in core end-user industries, or clear shifts in deployment preferences. Before delivery, a final check is completed to ensure the latest public information and any newly learned primary inputs are reflected in the numbers.
Mordor Intelligence's Model Based Enterprise Market Estimate Compared With Other Published Estimates
Published values for this market often differ because firms do not count the same things, even if the title looks identical. The biggest gaps usually come from what is treated as model-based definition versus broader digital engineering tooling, how services are counted (one-time implementation versus recurring support), and the exact year and currency timing used.
Some publishers fold a wider digital thread view into the number, which can pull in adjacent PLM and enterprise digital transformation budgets that are not always tied to model-based definition usage. In Mordor Intelligence, the value is counted only when the solution and related services directly enable model-based definition workflows across design and manufacturing teams, and then it is rechecked using deployment and end-user adoption signals gathered in primary validation.
Benchmark comparison
| Source | Market Size | Gaps in Research Methodology |
|---|---|---|
| Mordor Intelligence | USD 26.02 B (2025) | |
| Global Consultancy A | USD 20.62 B (2024) | Uses a different base year and appears to include a broader lifecycle narrative without clearly separating model-based definition specific revenue from wider digital-thread programs, which can shift the 2024 total versus a 2025 view. |
| Industry Publisher B | USD 13.90 B (2024) | Tends to keep the scope closer to manufacturing-side usage and reports a shorter horizon, which can reduce the counted software plus services pool when upstream engineering authoring and cross-site deployments are not fully captured. |
Looking across the three figures, the spread is mainly explained by scope and timing rather than arithmetic differences. When we keep the counted revenue tied to clear MBE-enabling use cases and then validate it against adoption, deployment, and services mix checks, the result stays traceable and repeatable from one update cycle to the next.
Key Questions Answered in the Report
What are the top regulatory forces shaping model-based enterprise adoption?
The U.S. Department of Defense digital-engineering mandate and similar aerospace regulations compel suppliers to maintain model-centric workflows, accelerating investment across the supply chain.
Why is cloud deployment gaining traction despite security concerns?
Cloud PLM offers rapid onboarding, elastic compute for simulation, and subscription pricing; hybrid architectures retain sensitive data on-premise to address intellectual-property risk.
How do digital twins improve maintenance, repair, and overhaul operations?
Real-time sensor data synchronizes with high-fidelity models, enabling predictive scheduling that has cut aircraft maintenance costs and turnaround times by roughly 15%.
Which industries demonstrate the fastest uptake after aerospace and defense?
Electric-vehicle programs in automotive manufacturing adopt full 3D digital threads to meet compressed launch schedules and integrate software-defined functionality.
What is the greatest technical hurdle to enterprise-wide rollouts?
Converting decades of legacy CAD into fully annotated, parametric models without losing design intent remains the dominant technical barrier and often delays projects.
Which industry currently invests the most?
Aerospace and Defense stands out, contributing 32.55% of 2025 revenue due to mandated digital-engineering policies and the complexity of long-lifecycle programs that benefit from full digital continuity.