
Market Overview
| Study Period | 2020 - 2031 |
|---|---|
| Market Size (2026) | USD 9.5 Billion |
| Market Size (2031) | USD 28.84 Billion |
| Growth Rate (2026 - 2031) | 24.86% CAGR |
| Fastest Growing Market | Asia Pacific |
| Largest Market | North America |
| Market Concentration | Medium |
Major Players *Disclaimer: Major Players sorted in no particular order Image © Mordor Intelligence. Reuse requires attribution under CC BY 4.0. | |
Managed Mobility Services Market Analysis by Mordor Intelligence
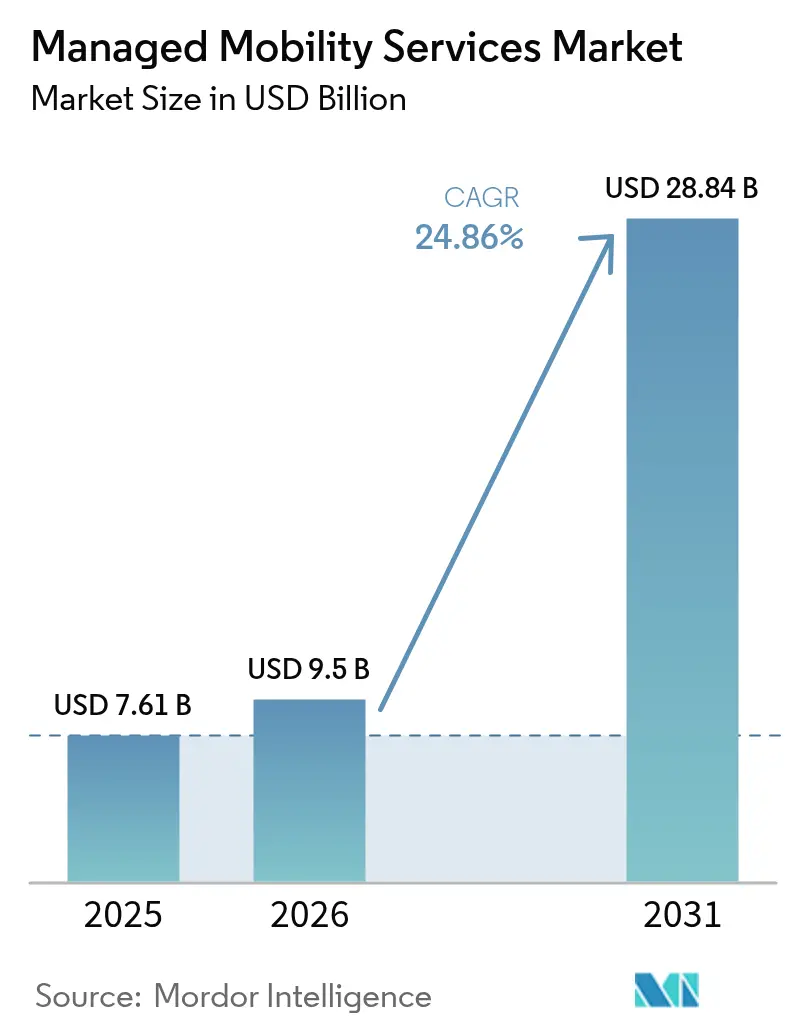
The managed mobility services market size is expected to grow from USD 7.61 billion in 2025 to USD 9.5 billion in 2026 and is forecast to reach USD 28.84 billion by 2031 at 24.86% CAGR over 2026-2031. Growth stems from organizations outsourcing complex mobility lifecycles as hybrid work becomes permanent, employee-owned devices multiply, and AI-enabled cloud platforms simplify endpoint orchestration. Accelerated bring-your-own-device adoption, rapid cloud migration, and unified security demands together fuel new service contracts while telecom operators, software providers, and niche vendors compete to deliver differentiated value propositions that cut support costs and sharpen workforce productivity. Intensifying demand for zero-touch onboarding through eSIM provisioning plus predictive support technologies further expands addressable revenue pools within the managed mobility services market.[1]Microsoft, “What’s New in Microsoft Intune,” microsoft.com
Key Report Takeaways
- By function, mobile device management led with 61.98% of managed mobility services market share in 2025 and mobile application management is on track to grow at a 26.64% CAGR to 2031.
- By deployment model, cloud-based services captured 68.15% of the managed mobility services market size in 2025 and are anticipated to expand at a 26.92% CAGR through 2031.
- By organization size, large enterprises accounted for 62.95% revenue share in 2025 in the managed mobility services market, whereas small and medium enterprises will post the fastest 26.7% CAGR through 2031.
- By end-user industry, IT and telecom retained the highest 28.55% share in 2025 in the managed mobility services market and healthcare is positioned for a 26.05% CAGR through 2031.
- By geography, North America held 39.35% share of the managed mobility services market size in 2025 while Asia-Pacific is projected to advance at a 26.21% CAGR during the forecast horizon.
Note: Market size and forecast figures in this report are generated using Mordor Intelligence’s proprietary estimation framework, updated with the latest available data and insights as of 2026.
Global Managed Mobility Services Market Trends and Insights
Drivers Impact Analysis*
| Driver | (~) % Impact on CAGR Forecast | Geographic Relevance | Impact Timeline |
|---|---|---|---|
| BYOD proliferation and hybrid-work normalization | +6.2% | Global, with North America and Europe leading adoption | Short term (≤ 2 years) |
| Outsourcing of IT and mobility lifecycle to cut TCO | +5.8% | Global, with SME segment driving growth in APAC | Medium term (2-4 years) |
| Rapid cloud adoption enabling scalable MMS delivery | +4.9% | Global, with cloud-first markets leading | Short term (≤ 2 years) |
| Need for unified security and compliance across endpoints | +4.1% | North America and EU regulatory markets, expanding globally | Medium term (2-4 years) |
| eSIM/iSIM and remote SIM-OTA fueling zero-touch global fleets | +2.3% | APAC core, spill-over to global enterprise fleets | Long term (≥ 4 years) |
| AI-driven predictive support slashing device downtime | +1.8% | Advanced markets initially, scaling to emerging regions | Long term (≥ 4 years) |
| Source: Mordor Intelligence | |||


BYOD proliferation and hybrid work normalization
Firms now manage unprecedented endpoint diversity because 80% of employees access corporate data from personal devices, a scenario that stretches internal IT teams beyond practical limits.[2]IBM Security, “MaaS360 Mobile Device Management,” ibm.com Cyber-risks rise when unmanaged smartphones and tablets handle sensitive files, so enterprises seek external specialists able to impose policy uniformity without limiting user freedom. Managed mobility services market vendors respond with containerization and real-time threat detection that secure data in motion and at rest. Demand rises fastest among knowledge-intensive industries where productivity gains offset device heterogeneity. Service providers that can blend security, user experience, and regulatory compliance stand to win large multiyear contracts as hybrid work policies solidify.
Outsourcing of IT and mobility lifecycle to cut TCO
Budget ownership has shifted from capital to operating expense, making predictable subscription models attractive. Comparative studies show per-device support costs drop 30% when lifecycle tasks move to a multi-tenant provider that leverages automation and scale. Outsourcing frees overstretched IT teams for strategic digital programs while giving executives uniform dashboards for usage, compliance, and spend. The managed mobility services market therefore grows rapidly among mid-market companies that lack mobility specialists. Vendors win deals when they can prove measurable savings, rapid onboarding, and SLA-based quality metrics that outclass in-house alternatives.
Rapid cloud adoption enabling scalable MMS delivery
Cloud-native platforms remove infrastructure barriers once inherent to on-premises mobility suites. Global policy engines, API-based integrations, and elastic compute resources allow providers to onboard thousands of devices in minutes while pushing updates without service windows. Real-time analytics and machine learning generate predictive insights that flag battery failures, malware attempts, or policy violations. These advantages help the managed mobility services market penetrate highly distributed organizations that need consistent experiences across geographies. Cloud dominance also encourages rapid feature co-innovation because modules can be rolled out incrementally instead of through large version upgrades.
Need for unified security and compliance across endpoints
Healthcare entities bound by HIPAA, banks governed by PCI DSS, and European firms subject to GDPR all seek unified solutions that streamline audit readiness.[3]Philips, “Clinical Mobility Solutions,” philips.com Managed mobility partners now embed compliance rule-sets directly into device management workflows, automating evidence collection and alerting staff when settings drift from baseline. Integration with threat intelligence feeds enables proactive containment, reducing breach dwell time. Vendor differentiation rests on domain expertise in sector-specific regulations and the ability to demonstrate continuous rather than point-in-time compliance. That requirement underpins steady recurring revenue in the managed mobility services market.
Restraints Impact Analysis*
| Driver | (~) % Impact on CAGR Forecast | Geographic Relevance | Impact Timeline |
|---|---|---|---|
| Perceived loss of operational control and cost visibility | -2.8% | Global, particularly affecting large enterprises | Short term (≤ 2 years) |
| Integration complexity with legacy infrastructure | -2.1% | North America and Europe with established IT systems | Medium term (2-4 years) |
| Rising SLA penalties from customization and high-touch support | -1.6% | Global, affecting service provider margins | Medium term (2-4 years) |
| Shortage of skilled mobility professionals | -1.3% | Global, with acute shortages in emerging markets | Long term (≥ 4 years) |
| Source: Mordor Intelligence | |||
Perceived loss of operational control and cost visibility
Executives hesitate to hand key mobility functions to third parties when budget accountability and live performance data appear opaque. Concerns grow when variable fees, custom reporting surcharges, or vendor lock-in clauses come to light during contract negotiations. Providers now counter by exposing granular dashboards, flexible exit options, and benchmark pricing to rebuild trust. Transparent governance frameworks and co-managed models help sustain momentum in the managed mobility services market even among risk-averse organizations.
Integration complexity with legacy infrastructure
Multinational firms still rely on on-premises mail servers, proprietary ERPs, and outdated directory services that lack modern APIs. Connecting cloud-based mobility suites to these systems can trigger multi-phase migrations, unexpected downtime, and unforeseen license costs. Providers that invest in tooling, professional services, and reference architectures reduce friction, yet integration hurdles still prolong sales cycles and inflate total project spend. Where compliance prohibits extensive refactoring, some customers postpone full outsourcing, constraining near-term market growth.
*Our forecasts treat driver/restraint impacts as directional, not additive. The impact forecasts reflect baseline growth, mix effects, and variable interactions.
Segment Analysis
By Function: Device management dominance faces application challenge
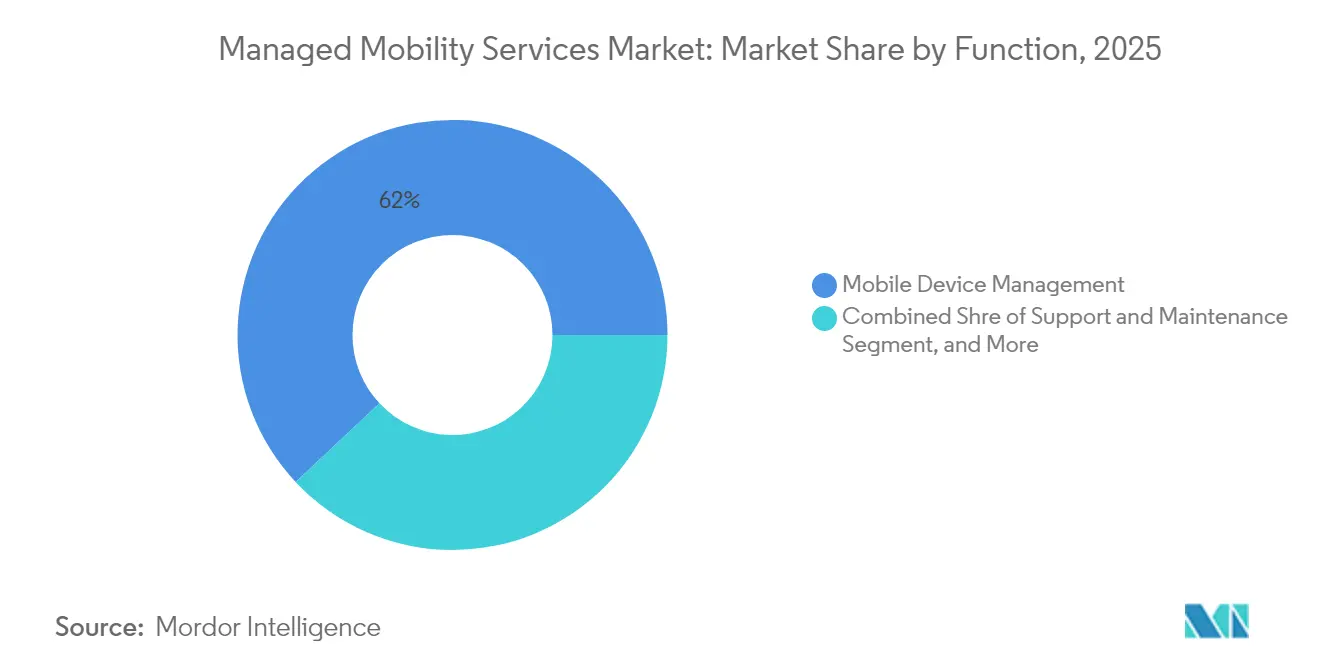
Mobile device management delivered 61.98% of the managed mobility services market share in 2025 because enterprises initially prioritized uniform policy enforcement, asset tracking, and remote wipe capabilities across smartphones, tablets, and rugged endpoints. Comprehensive control over firmware updates and encryption status made the device layer an indispensable foundation for compliance audits and incident response. However, the segment’s expansion rate now lags more agile application-centric options as organizations refine security to the data layer.
Mobile application management is forecast to post a 26.64% CAGR, the strongest among functional categories, as containerization separates corporate and personal contexts on BYOD hardware without intrusive full-device controls. Healthcare providers adopt app-level management to safeguard patient records while permitting clinicians to use personal phones, and financial institutions deploy secure app wrappers for mobile banking advisors. The shift encourages service vendors to bundle device, app, and content modules so clients avoid multiple contracts. Such convergence keeps the managed mobility services market adaptable to evolving endpoint threats and workforce expectations.


By Deployment Model: Cloud supremacy accelerates
Cloud solutions held 68.15% of managed mobility services market size in 2025 and they will maintain momentum with a 26.92% CAGR as enterprises seek elastic capacity, uniform policy propagation, and rapid feature rollout. Multi-tenant architectures offer economies of scale for patch distribution, analytics processing, and compliance reporting that on-premises stacks cannot match. CIOs also value geographic redundancy delivered through hyperscale data centers that satisfy uptime commitments without capital expenditure.
On-premises deployments persist in defense, public sector, and heavily regulated utilities that require data residency or air-gapped operations. Even within those verticals, hybrid models emerge where core identity stores remain on site but device telemetry and AI analytics reside in the cloud. Service providers therefore invest in flexible architectures with connectors that move workloads seamlessly across environments. This approach keeps their addressable universe broad as sovereignty rules evolve, reinforcing the managed mobility services market as a pragmatic pathway to unified endpoint oversight.
By Organization Size: SME segment disrupts traditional patterns
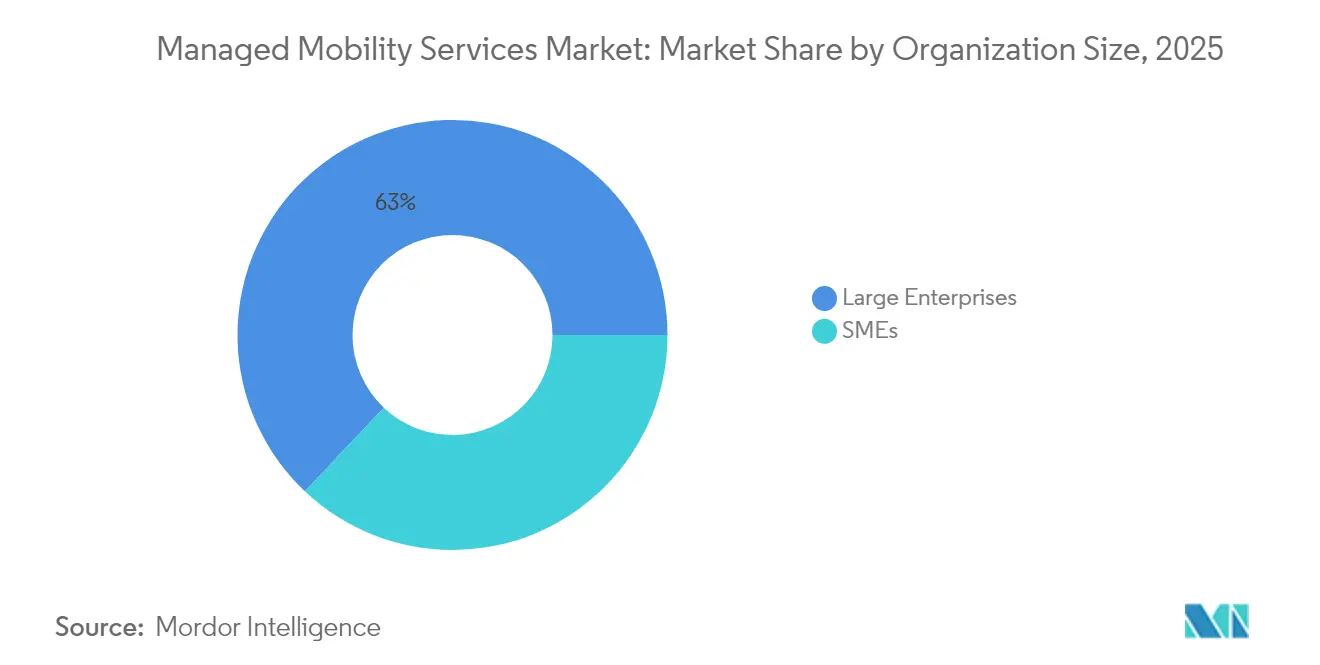
Large enterprises controlled 62.95% of revenue in 2025 because their global device fleets and strict compliance mandates justify comprehensive outsourcing agreements that bundle 24 x 7 support, analytics, and governance reporting. Complex mobility estates spanning corporate-owned and BYOD assets demand deep integration skills and broad geographic reach, capabilities typically found among tier-one providers.
Small and medium enterprises will, however, record the highest 26.7% CAGR as low-code onboarding portals, pay-as-you-grow pricing, and automated policy sets erase earlier barriers. Cloud marketplaces now let an organization with fewer than 200 seats deploy full device, app, and identity control in hours. Providers that pre-package vertical templates for retail, professional services, or manufacturing stand out by reducing configuration complexity. As adoption broadens, SME demand fuels a vibrant long-tail ecosystem within the managed mobility services market, opening space for regional specialists and born-in-the-cloud startups.
By End-user Industry: Healthcare mobility transformation accelerates
IT and telecom companies captured 28.55% of managed mobility services market size in 2025 because their field engineers, salesforces, and customer-service agents rely on always-connected devices for critical workflows. High device turnover and stringent service-level expectations make external lifecycle management attractive. Telecom operators also bundle internal know-how into commercial offerings, creating virtuous cycles of scale and product improvement.
Healthcare is set for a 26.05% CAGR as hospitals digitize clinical workflows and enforce electronic health record security. Bedside devices, medication scanners, and telehealth tablets require continuous updates and HIPAA-aligned safeguards that internal biomedical teams seldom have bandwidth to manage. Managed services relieve resource strain while embedding audit trails and encryption defaults. Manufacturing, BFSI, retail, and government segments each add steady volumes, reflecting tailored compliance drivers such as PCI DSS, OSHA mandates, and citizen identity protection. The diversity of needs encourages solution modularity, sustaining multipronged expansion across the managed mobility services market.
Geography Analysis
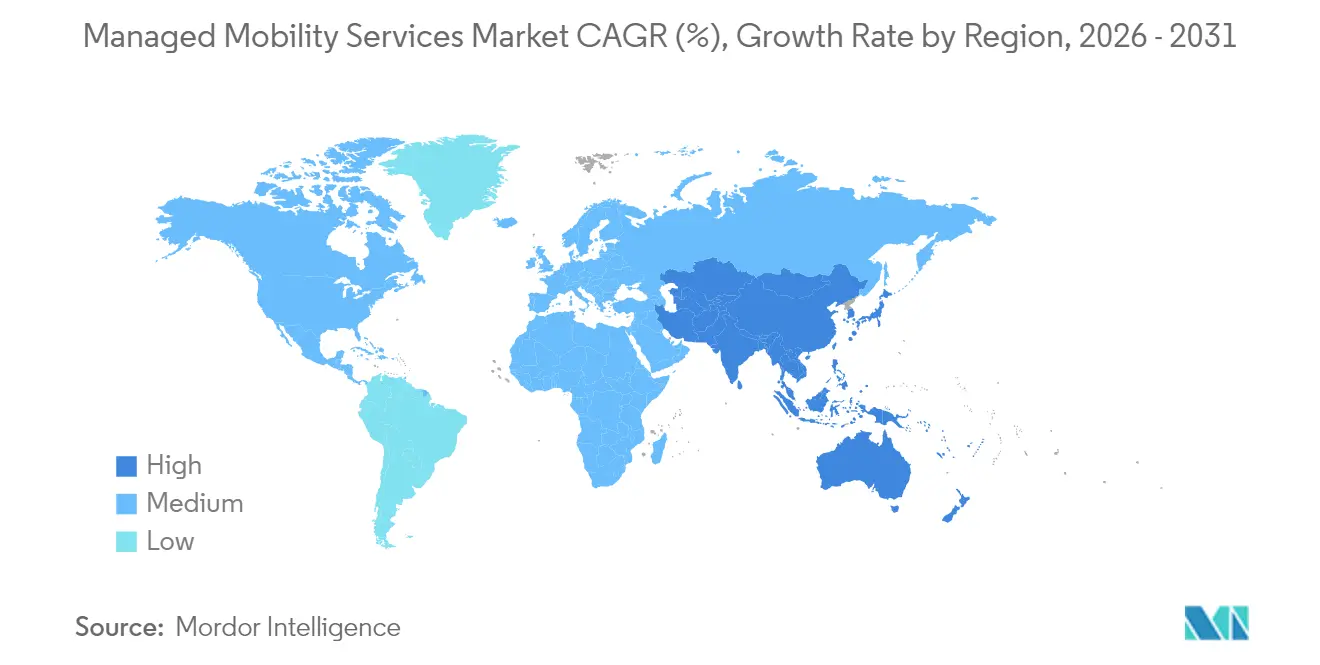
North America retained 39.35% share in 2025 because early BYOD acceptance, mature cloud adoption, and stringent privacy rules together encouraged investment in full-featured managed programs. Enterprises routinely integrate mobile threat defense, secure connectivity, and analytics within unified contracts, raising average deal values. Public sector demand also rises as agencies modernize service delivery while satisfying FedRAMP and CJIS mandates, all of which magnify regional revenue pools for the managed mobility services market.
Asia-Pacific will advance at a 26.21% CAGR, the fastest worldwide, underpinned by industrial digitalization, government smart city agendas, and multifaceted e-commerce ecosystems. China’s domestic cloud champions bundle mobility services with 5G private networks, while India’s IT service integrators extend global best practices to local SMEs eager for remote support. ASEAN nations invest in workforce mobility to streamline tourism border checks, logistics corridors, and financial inclusion programs that rely on robust endpoint security. These varied deployments deepen regional expertise and attract fresh capital into the managed mobility services market.
Europe records steady growth due to GDPR enforcement, digital identity schemes, and demand for sovereignty-compliant clouds. Enterprises adjust procurement to favor providers that host telemetry within the bloc and can certify ISO 27001 compliance. Although budget cycles remain cautious, repeat contract renewals sustain predictable momentum. South America and the Middle East and Africa exhibit emerging demand as mobile broadband penetration climbs and multinational firms roll out standardized policies across affiliates. Capacity building by regional telecoms further enlarges the managed mobility services market footprint.

Regulatory Landscape
Managed mobility services sit at the intersection of privacy, cybersecurity, and telecom-security obligations that set minimum expectations for device controls, auditability, and supplier governance. For regulated end users, key anchors include GDPR-driven controls in Europe and sector frameworks such as HIPAA (healthcare) and PCI DSS (BFSI), which push providers to standardize encryption, policy enforcement, and evidence collection across mixed corporate-owned and BYOD estates. In the United States, federal demand is shaped by procurement and security baselines such as FIPS 140-2 validated cryptography, NIST SP 800-37 (Risk Management Framework), and OMB M-22-09 (Zero Trust), translating into operational requirements for managed service desks, incident processes, and compliant tooling.
Government procurement requirements also shape how MMS offerings are packaged and sourced. The GSA Wireless Mobility Solutions checklist (June 2025) and Trade Agreements Act (TAA) compliance requirements tied to schedules such as SIN 517312 influence sourcing eligibility and documentation. In November 2025, DHS issued the final solicitation for Cellular Wireless Managed Services (CWMS) 3.0 (2025-2035), reinforcing a shift toward centralized managed wireless and mobility contracts that bundle TEMS, MDM, and program governance. In June 2026, telecom security governance tightened further with the UK publishing a draft revised Telecommunications Security Code of Practice and India issuing Telecommunications (Authorisation for Captive Telecommunication Services) Rules, 2026 under the Telecommunications Act, 2023, both of which raise compliance expectations for managed connectivity environments that overlap with mobility estates.
Value Chain Analysis
The managed mobility services value chain begins with device and connectivity inputs (OEMs, carriers/MNOs, MVNOs, and eSIM provisioning) and then shifts into the core control plane (UEM/MDM, mobile security, identity, and app/content governance) that supports policy and telemetry. Delivery is carried out by managed mobility integrators and telecom operators, which combine onboarding, configuration, security baselines, and 24/7 service desk operations. This is supported by depot/repair partners, logistics providers, and telecom expense management (TEMS) specialists for billing and usage controls. Cloud infrastructure and API integrations with ITSM platforms (for example, ServiceNow) increasingly sit in the middle of the chain, linking procurement, enrollment, compliance reporting, and remediation workflows.
Recent moves also show where bottlenecks are being engineered out through remote activation and provisioning, which reduces physical handling and shortens time-to-service for large fleets. In July 2026, BT Business and Ivanti launched remote eSIM installation for managed Android devices, enabling activation from MDM without in-person touch and shifting value toward platform orchestration rather than manual staging. At the enterprise layer, large-scale renewals such as Techstep ASA's June 2026 renewed agreement with Equinor to manage about 40,000 iOS devices illustrate the stickiness of lifecycle, consulting, and always-on support once integrated into operations. On the distribution side, government and large-enterprise sourcing increasingly favors consolidated, single-provider structures, such as DHS CWMS 3.0, which rewards providers that can deliver unified portals, compliance reporting, and multi-operator connectivity management across geographies.
Competitive Landscape
The managed mobility services market remains moderately fragmented because telecom operators, global software houses, and pure-play mobility specialists each command pockets of influence without a single firm surpassing 15% revenue. Telecommunications incumbents leverage network assets and existing enterprise bill-of-materials to cross-sell lifecycle management packages, often bundling voice, data, and device financing into unified invoices. Software-centric players focus on platform extensibility, leaning on vast ISV communities to tailor workflows and analytics. Niche providers compete on deep vertical knowledge, for instance clinical mobility or rugged industrial device fleets, which larger peers sometimes overlook.
Strategic alliances escalate. Kyndryl partners with Microsoft to merge cloud scale and managed service expertise, allowing joint pursuit of multinational frameworks that integrate Intune with legacy on-premises identity stacks. Samsung SDS collaborates with chipset makers to optimize firmware for remote diagnostics, while Philips Healthcare aligns with hospital IT to certify medical-grade devices inside broader endpoint estates. Such partnerships convert technology synergies into market share wins by shortening deployment times and reducing integration risk.
Innovation remains the prime differentiator. AI-enabled predictive maintenance halves support tickets at several early adopters, prompting providers to embed machine learning in every incident management tier. Edge computing use cases such as offline compliance checks inside oil rigs or naval vessels create new premium service niches. Providers that translate technical advances into verifiable productivity and risk-reduction metrics secure multiyear renewals, raising switching costs and reinforcing competitive positioning across the managed mobility services market.
Managed Mobility Services Industry Leaders
Orange S.A.
AT&T Inc.
Fujitsu Limited
Kyndryl Holdings, Inc.
Wipro Limited
- *Disclaimer: Major Players sorted in no particular order


Market Opportunities and Future Outlook
A key opportunity is consolidation and orchestration across fragmented mobility estates, especially for enterprises running multiple MDM/UEM tools and struggling to maintain consistent policy, reporting, and user support. Providers that can unify policy engines across device, application, and content layers, and integrate with ITSM and TEMS, address a practical pain point tied to governance and cost transparency. The cloud-based delivery model, already the majority deployment approach in 2025, supports standardized packaging for SMEs and distributed workforces, while regulated industries such as healthcare, BFSI, and public sector continue to require compliance-ready configurations and audit artifacts that can be operationalized as managed services.
Service differentiation is shifting toward employee experience measurement and automation inside the service desk, creating room for Experience Level Agreements (XLAs) and Digital Employee Experience (DEX) telemetry on top of traditional SLAs. Company and industry commentary in 2026 highlights GenAI-enabled support functions such as automated ticket resolution, device diagnostics, and multilingual help-desk workflows, aligning with the market's move toward predictive support and lower downtime. In parallel, operator-layer simplification and eSIM-based onboarding expand addressable use cases for global fleets. Initiatives such as BT Business and Ivanti's July 2026 remote eSIM installation capability and Telgea's July 2026 collaboration with Fastweb + Vodafone to build a unified multi-country operator layer reflect demand for zero-touch provisioning and cross-border operational consistency, which managed mobility providers can package as premium global lifecycle services.
Recent Industry Developments
- July 2026: BT Business and Ivanti launched remote eSIM installation for managed Android devices, enabling activation directly from MDM workflows without physical device handling. The move reduces provisioning friction for large, distributed fleets and increases the value of service providers that can integrate carrier actions into unified endpoint operations.
- June 2026: Techstep ASA renewed a managed mobility services agreement with Equinor ASA to manage around 40,000 iOS devices, spanning lifecycle management, consulting, and 24/7 support. The scale of the renewal highlights how embedded operational support and governance capabilities drive retention once mobility estates are standardized.
- February 2024: Kyndryl launched Unified SIM to deliver integrated global connectivity as part of its managed services portfolio. It strengthened the link between mobility lifecycle management and cross-border connectivity orchestration, supporting customers that need centralized control over provisioning, usage, and security across regions.


Research Methodology Framework and Report Scope
Market Definition and Coverage
For this study, the mobility managed services market is defined as outsourced services that help organizations procure, deploy, secure, monitor, and support mobile devices and mobility applications used by employees, including ongoing lifecycle and compliance work across common deployment models.
Scope exclusions: We exclude pure telecom connectivity resale and standalone hardware sales when they are not bundled with an ongoing managed mobility service contract.
Segmentation Overview
- By Function
- Mobile Device Management
- Mobile Application Management
- Mobile Security Management
- Support and Maintenance
- By Deployment Model
- Cloud-based
- On-premises
- By Organization Size
- Large Enterprises
- Small and Medium-Sized Enterprises
- By End-user Industry
- IT and Telecom
- BFSI
- Healthcare
- Manufacturing
- Retail and E-commerce
- Education
- Government and Public Sector
- By Geography
- North America
- United States
- Canada
- Mexico
- South America
- Brazil
- Argentina
- Rest of South America
- Europe
- Germany
- United Kingdom
- France
- Italy
- Spain
- Rest of Europe
- Asia-Pacific
- China
- Japan
- South Korea
- India
- ASEAN
- Rest of Asia-Pacific
- Middle East and Africa
- Middle East
- Saudi Arabia
- United Arab Emirates
- Turkey
- Rest of Middle East
- Africa
- South Africa
- Nigeria
- Rest of Africa
- Middle East
- North America
Data Sources, Market Sizing, and Validation
Desk Research
We started by mapping what buyers typically pay for in mobility managed services, then aligned that with public signals that show device adoption, security needs, and enterprise mobility usage. Foundational inputs came from the US Bureau of Labor Statistics (remote and hybrid work indicators), the US International Trade Commission (device and component trade signals), the National Institute of Standards and Technology guidance (security control expectations), and Federal Communications Commission releases (mobile network and usage context).
To keep the model grounded, we also reviewed annual reports and investor presentations of listed service providers and IT services firms, reputable press coverage of large enterprise mobility programs, and association publications focused on enterprise IT operations. Where needed, we validated company-level revenue ranges and mobility related commentary using an approved paid subscription for company financials and intelligence, and we also used a paid patent database selectively to sanity-check directional investment in device management and endpoint security. The desk sources listed here are illustrative only, and we relied on additional public and paid references for data collection, cross-checking, and clarification.
Primary Interviews and Surveys
Next, we interviewed and surveyed stakeholders across the service delivery chain, including managed service leaders, enterprise mobility owners, IT security managers, procurement teams, and channel partners that support device lifecycle services. Respondent input was collected across major regions to test assumptions on adoption timing, service bundling, and price changes, and then we corrected items where the desk view was too optimistic or too conservative.
Distribution of primary research fieldwork respondents
| Company type | Respondent position | Region |
|---|---|---|
| Top tier: 32% | CXOs: 16% | APAC: 41% |
| Mid tier: 46% | Functional/Unit leaders: 31% | EMEA: 32% |
| Smaller Players: 22% | Managers: 53% | Americas: 27% |
Market-Sizing & Forecasting
Our sizing starts with a top-down demand pool build that links enterprise mobility usage to the managed service attach rate, then converts it into annual spend using typical contract structures. To avoid overcounting, spend is allocated only when ongoing management work is present, and then split across device management, application management, and mobile security activities.
Key inputs used to shape the model include the installed base of enterprise mobile endpoints, the share of remote and field workforces, endpoint security and compliance requirements, the pace of OS and device refresh cycles, and typical pricing moves expressed in per-device-per-month fees and bundled support. Bottom-up checks were then run using selective supplier roll-ups and sampled ASPs for managed endpoints in a few mature markets. Where private provider revenue was not directly visible, we applied conservative ranges that were confirmed in interviews.
For forecasting, we ran scenario analysis because adoption and bundling can shift quickly with security events and workplace policy changes. Demand drivers and pricing paths were stress-tested with primary feedback, and the final forecast reflects the most repeated view across buyer and provider cohorts rather than a single aggressive case.
Data Validation & Update Cycle
Outputs are triangulated against independent signals such as enterprise device shipments, remote work indicators, and reported managed services revenue commentary, and then checked for unrealistic jumps across years. If a variance shows up, the analyst traces it back to the driver, for example attach rate, pricing, or endpoint base, and then re-checks it through additional calls or follow-up questions.
Before sign-off, a second analyst reviews the logic, formulas, and year-over-year trends so one person does not approve their own assumptions without challenge. The dataset is refreshed annually, with interim updates when major demand shocks occur, and a final pre-delivery review is completed so clients receive the latest view available at the time of purchase.
Mordor Intelligence's Mobility Managed Services Market Estimate Compared With Other Published Estimates
Published market sizes for mobility managed services can look far apart because the scope line is drawn differently, and because pricing and adoption are updated on different schedules. Differences also show up when one study counts only device management, while another folds in adjacent categories like broader managed services or telecom expense programs.
The biggest gap drivers we saw were whether telecom connectivity resale is included, whether only ongoing managed contracts are counted versus one-time setup projects, and how the per-device pricing path is treated as device fleets shift to newer operating systems. Some publishers anchor on a single year and then project out without re-checking attach rates with current enterprise mobility teams, which can leave the forecast too smooth for a market that responds to security and workplace changes. The table points to this scope and refresh effect, where estimates that include broader outsourced IT services inflate totals compared with a model that limits revenues to managed mobility activities, a choice kept consistent by Mordor Intelligence.
Benchmark comparison
| Source | Market Size | Gaps in Research Methodology |
|---|---|---|
| Mordor Intelligence | USD 7.61 B (2025) | |
| Global Consultancy A | USD 9.00 B (2024) | This estimate appears to anchor on an earlier base year and uses a wider managed mobility definition that can blend into general managed services, which can lift totals if adjacent IT support revenues are counted. |
| Industry Publisher B | USD 38.42 B (2025) | The figure suggests a much broader service basket, likely including wireless expense management, network related outsourcing, and other enterprise mobility spend categories, which expands the addressable pool beyond managed mobility service contracts. |
Across the three numbers, the spread is mainly explained by what is counted as managed mobility revenue and how frequently inputs like attach rate and pricing are refreshed. By keeping the demand pool tied to managed endpoints and contract-based services, and then cross-checking it with selective bottom-up math, the resulting value stays traceable to clear variables and repeatable steps.


Key Questions Answered in the Report
What is the projected value of the managed mobility services market by 2031?
The market is projected to reach USD 28.84 billion by 2031, reflecting a 24.86% CAGR during 2026-2031.
Which function will expand the fastest over the forecast period?
Mobile application management is expected to grow at a 26.64% CAGR as enterprises shift to data-level controls.
Why are small and medium enterprises adopting managed mobility services quickly?
Cloud marketplaces, pay-as-you-grow pricing, and automated policy templates reduce complexity and support a 26.7% CAGR among SMEs.
Which region offers the highest growth potential for providers?
Asia-Pacific leads with a projected 26.21% CAGR driven by smart city initiatives and rapid smartphone penetration.
How do eSIM and remote SIM provisioning benefit global enterprises?
They enable zero-touch activation across borders, reducing logistics delays and roaming costs while simplifying fleet scaling
Page last updated on:






