
Mobile Medical Imaging Services Market Size and Share
Market Overview
| Study Period | 2020 - 2031 |
|---|---|
| Market Size (2026) | USD 17.31 Billion |
| Market Size (2031) | USD 21.13 Billion |
| Growth Rate (2026 - 2031) | 4.07 % |
| Fastest Growing Market | Asia-Pacific |
| Largest Market | North America |
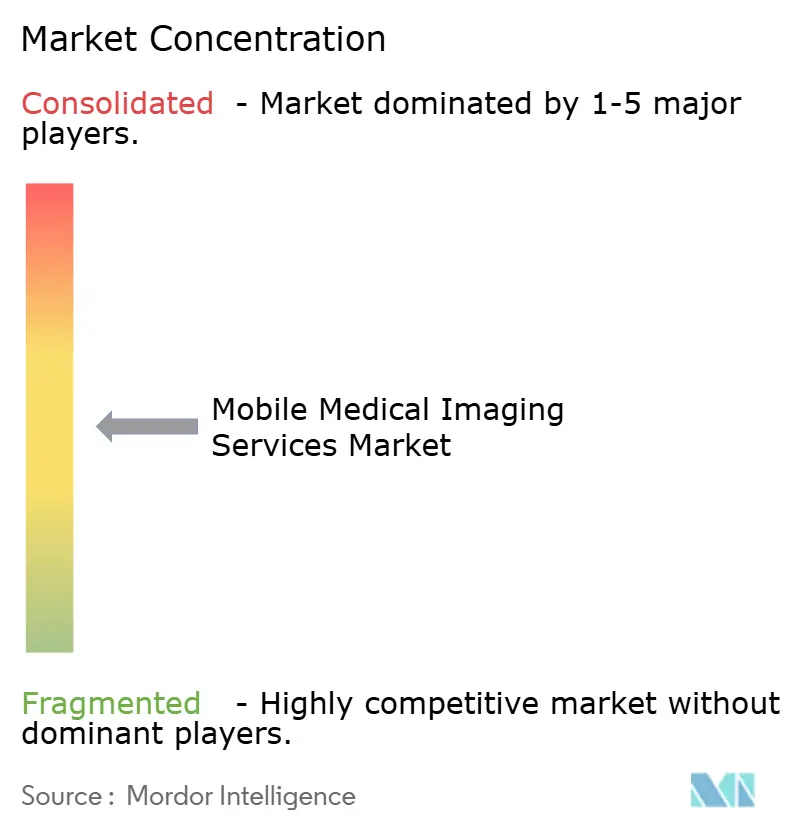
| Market Concentration | Medium |
Major Players *Disclaimer: Major Players sorted in no particular order Image © Mordor Intelligence. Reuse requires attribution under CC BY 4.0. | |
Mobile Medical Imaging Services Market Analysis by Mordor Intelligence
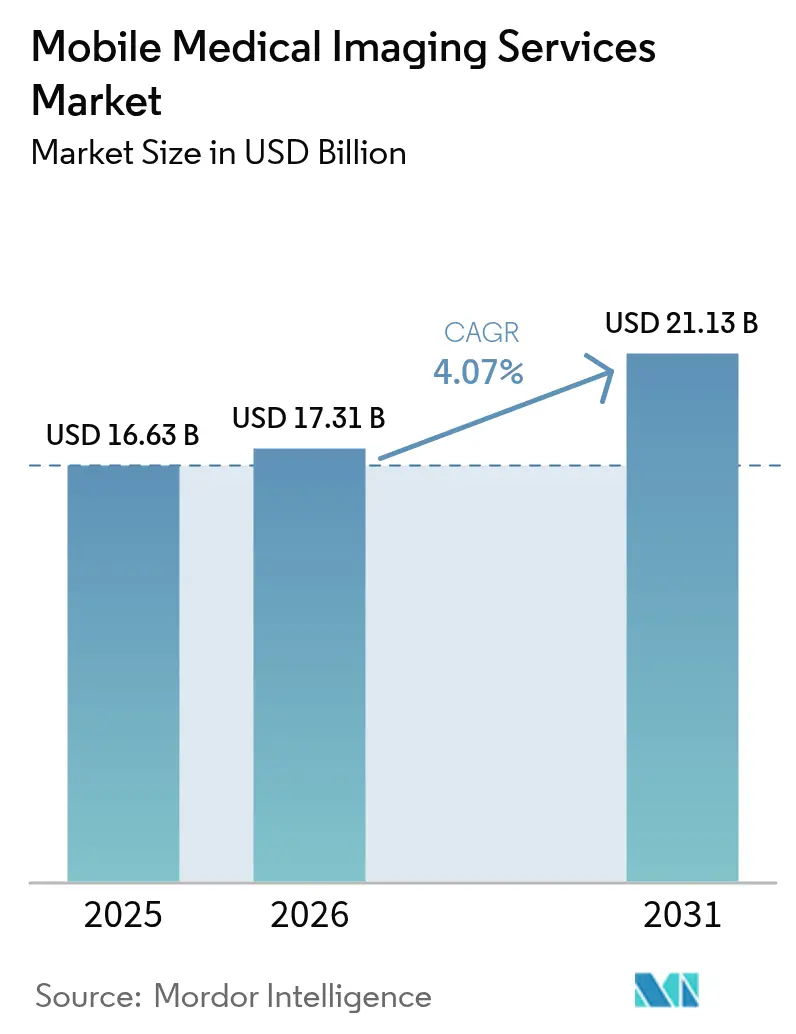
The Mobile Medical Imaging Services market size is expected to grow from USD 16.63 billion in 2025 to USD 17.31 billion in 2026 and is forecast to reach USD 21.13 billion by 2031 at 4.07% CAGR over 2026-2031. Widespread decentralization of care, technological miniaturization and favorable reimbursement reforms keep demand rising, while point-of-care diagnostics continue to displace in-facility scans. Magnetic resonance imaging retains the largest revenue footprint, although positron-emission tomography/CT is expanding quickest as cardiac and oncology procedures migrate to mobile platforms. Provider strategies now integrate bedside scanning into hospital-at-home programs, trimming transport costs and boosting patient adherence. Growth is most pronounced in regions that combine supportive regulation, chronic disease burdens and infrastructure investments, particularly across North America and Asia-Pacific. Ongoing workforce constraints, cyber-security mandates and equipment capital outlays temper overall momentum but have not derailed the broader upward trajectory of the mobile medical imaging services market.
Key Report Takeaways
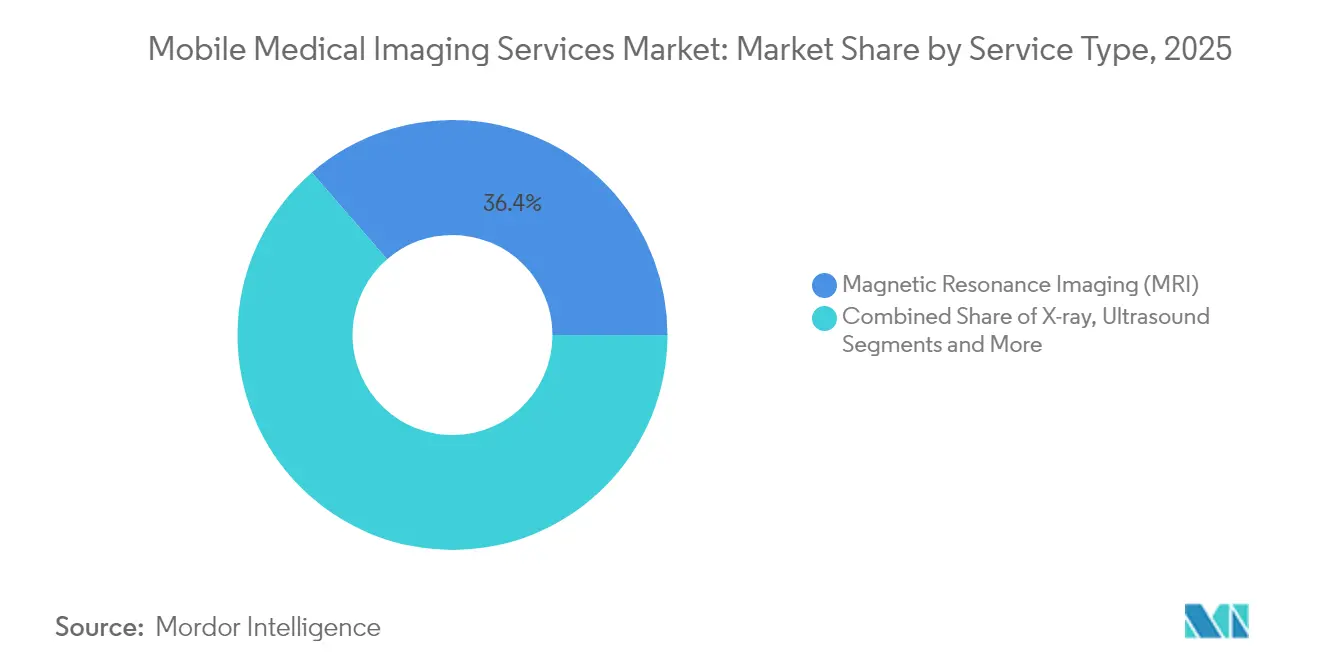
- By service type, magnetic resonance imaging led with 36.35% of mobile medical imaging services market share in 2025, while PET/CT is projected to grow at a 5.61% CAGR to 2031.
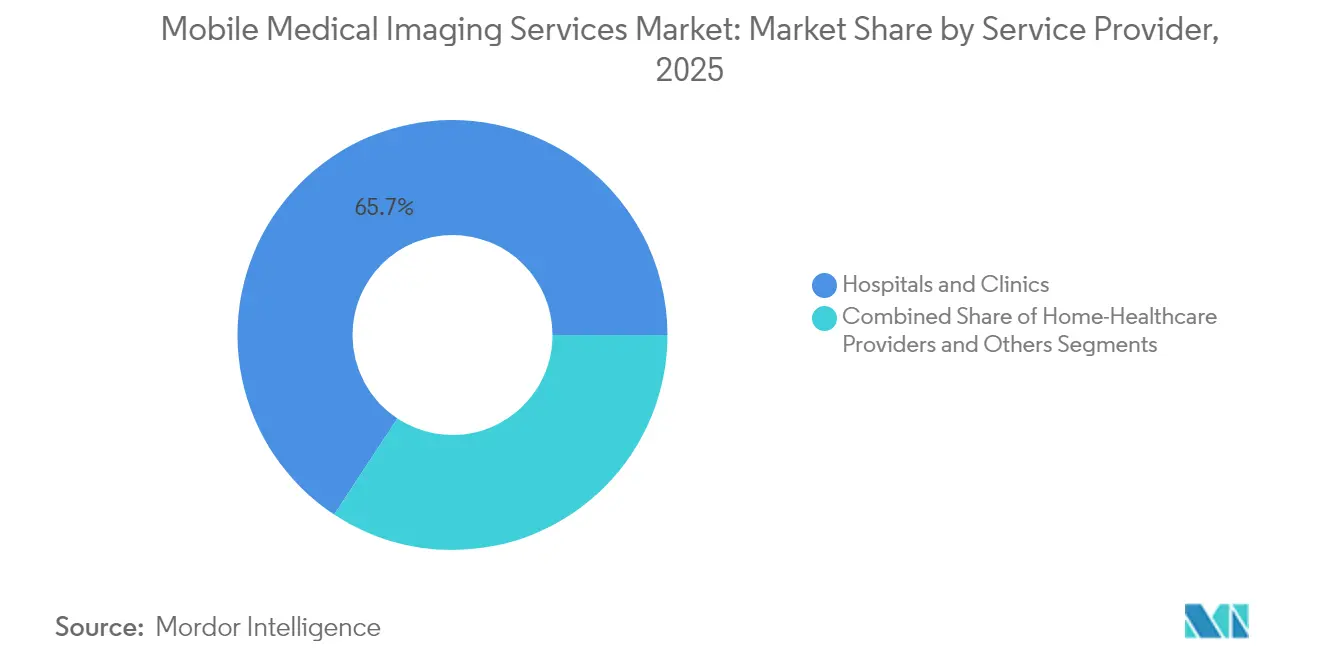
- By service provider, hospitals and clinics held 65.72% of revenue in 2025; home-healthcare providers are advancing at a 5.55% CAGR through 2031.
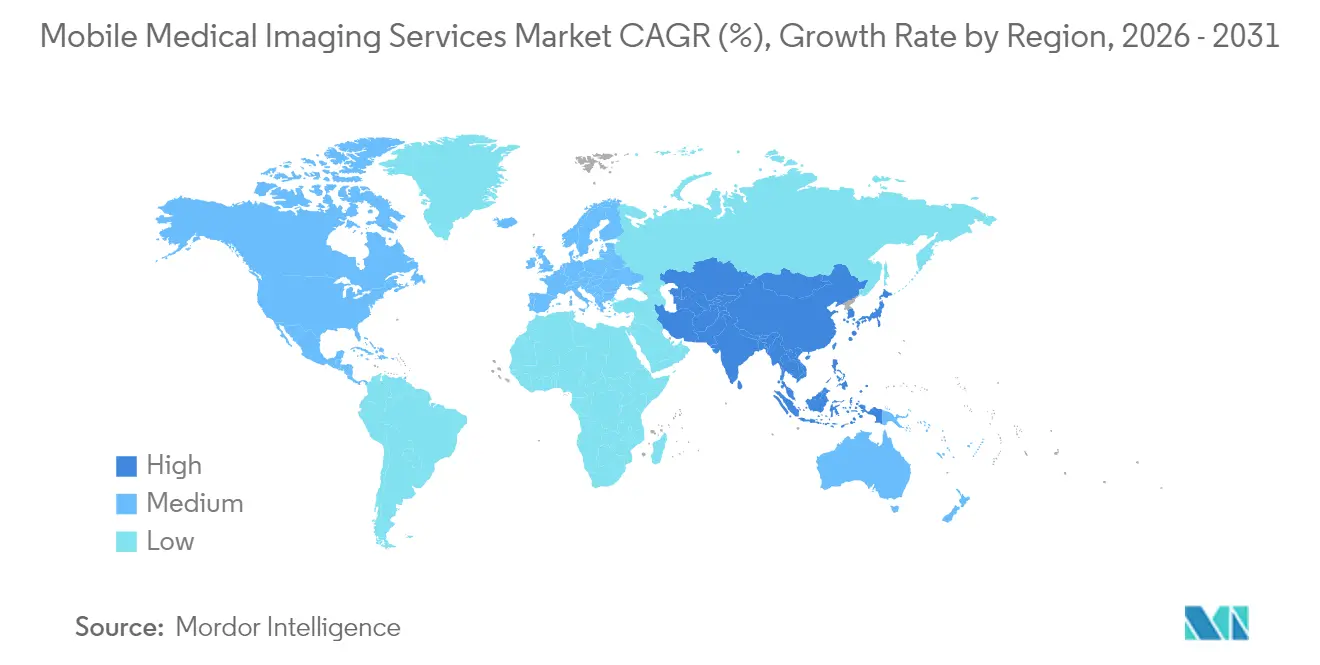
- By geography, North America captured 40.18% of revenue in 2025, while Asia-Pacific is growing the fastest at a 5.88% CAGR through 2031.
Note: Market size and forecast figures in this report are generated using Mordor Intelligence’s proprietary estimation framework, updated with the latest available data and insights as of 2026.
Market Trends and Insights
Drivers Impact Analysis of Mobile Medical Imaging Services Market*
| Driver | (~) % Impact on CAGR Forecast | Geographic Relevance | Impact Timeline |
|---|---|---|---|
| Rise in Demand for Portable Imaging Technology and Services | +1.2% | Global, with early adoption in North America & EU | Medium term (2-4 years) |
| Growing Burden of Chronic Diseases | +0.8% | Global, particularly pronounced in APAC and North America | Long term (≥ 4 years) |
| Technological Advancements | +1.0% | North America & EU leading, APAC following | Short term (≤ 2 years) |
| Expansion of "Hospital-At-Home" Reimbursement Codes | +0.9% | North America, with EU pilot programs | Medium term (2-4 years) |
| Healthcare Infrastructure Expansion | +0.7% | APAC core, spill-over to MEA and Latin America | Long term (≥ 4 years) |
| Rising Adoption of Telemedicine and Teleradiology | +0.6% | Global, accelerated in rural and underserved areas | Short term (≤ 2 years) |
| Source: Mordor Intelligence | |||
Rise in Demand for Portable Imaging Technology and Services
Portable scanners now reach rural clinics, ambulances and intensive-care units without sacrificing image quality. The 2024 FDA clearance of Positrigo’s NeuroLF brain PET and Hyperfine’s AI-enhanced Swoop MRI confirmed regulatory confidence in ultra-compact formats. Handheld ultrasound platforms such as Exo Iris achieve up to 80% cost savings versus cart-based systems and slip into a clinician’s pocket, fostering everyday use in primary care.[1] Providers also note reductions in patient transfer times that cut adverse-event risk during critical care episodes. Point-of-care capabilities shorten diagnostic cycles, improving outcomes for stroke and trauma. Collectively, these shifts enlarge the mobile medical imaging services market by opening settings once considered unreachable.
Growing Burden of Chronic Diseases
Higher incidences of cardiovascular disease, cancer, and diabetes keep scan volumes climbing year after year. PET myocardial perfusion imaging grew 25% between 2018 and 2023, reflecting cardiologists’ preference for on-site assessments that speed intervention. Mobile mammography units targeted at population screening reduce travel burdens for seniors and improve compliance with annual checkups. Frequent imaging of diabetic foot complications through portable ultrasound provides early identification of ischemic tissue, lowering amputation rates. These clinical imperatives reinforce the structural expansion of the mobile medical imaging services market, particularly in aging regions.
Technological Advancements
Artificial-intelligence algorithms embedded inside scanners trim interpretation time by roughly 30%, while photon-counting detectors cut radiation dose and sharpen resolution. Cloud workstations offload processing, allowing vans and carts to remain lightweight and energy-efficient. Miniaturized gradient coils in next-generation MRI units eliminate the need for shielded rooms, letting providers wheel systems into emergency bays. Together, these upgrades raise productivity for radiologists and widen the application spectrum, cementing the competitiveness of early movers in the mobile medical imaging services market.
Expansion of "Hospital-At-Home" Reimbursement Codes
The 2025 Medicare Physician Fee Schedule grants parity for remote supervision of diagnostic procedures, removing long-standing financial deterrents. Private insurers have mirrored the policy, bundling mobile scans into home-care packages. Providers are capitalizing by launching turnkey imaging fleets that accompany nurses and virtual-care teams to patients’ homes. These reimbursements accelerate diffusion of services across suburban and rural counties, reinforcing revenue visibility for stakeholders in the mobile medical imaging services market.
Restraints Impact Analysis of Mobile Medical Imaging Services Market*
| Restraint | (~) % Impact on CAGR Forecast | Geographic Relevance | Impact Timeline |
|---|---|---|---|
| High Capital Cost of Mobile Set-Ups and Scanners | -0.8% | Global, particularly impacting smaller providers | Medium term (2-4 years) |
| Radiation-Exposure Compliance Hurdles | -0.5% | Global, with stricter enforcement in EU and North America | Long term (≥ 4 years) |
| Cyber-Security Mandates for Mobile Endpoints | -0.4% | Global, with heightened focus in North America | Short term (≤ 2 years) |
| Shortage of Certified Mobile Technologists | -0.9% | Global, most acute in North America and EU | Medium term (2-4 years) |
| Source: Mordor Intelligence | |||
High Capital Cost of Mobile Set-Ups and Scanners
The substantial capital requirements for mobile imaging equipment create significant barriers to market entry and expansion. Acquiring a mobile PET/CT can cost USD 1.5 million–3 million, while mobile MRI frequently surpasses USD 2 million.[2] Rental fees for CT trailers approach USD 30,000 per month, excluding transport and shielding expenses. Refurbished units offer savings of 20–40% but availability is limited and may lag on AI upgrades. Financial constraints particularly impact rural and underserved markets where mobile imaging services are most needed, but economic viability is most challenging.
Shortage of Certified Mobile Technologists
The acute shortage of qualified imaging technologists severely constrains market growth. Radiologic technologist vacancy rates climbed to 18.1% in 2024 as retirements outpaced graduate inflows. Mobile assignments demand additional skills such as equipment rigging and lone-worker safety, pushing wages 15–25% above in-facility roles. Staffing agencies fill gaps but raise overhead, limiting smaller operators’ geographic reach and restraining capacity growth within the mobile medical imaging services market.
*Our forecasts treat driver/restraint impacts as directional, not additive. The impact forecasts reflect baseline growth, mix effects, and variable interactions.
Mobile Medical Imaging Services Market Segment Analysis
By Service Type:
MRI Dominance Amid PET/CT AccelerationMagnetic resonance imaging retained 36.35% of revenue in 2025, underpinned by portable systems that bypass the need for shielded rooms and fixed cryogens. The modality’s versatility across neurology, orthopedics and cardiology cements its commanding role within the mobile medical imaging services market. PET/CT, however, is gaining momentum at a 5.61% CAGR, buoyed by surging cardiac perfusion studies and precision oncology diagnostics. PET scan volumes rose 10.2% year on year in 2023, indicating pent-up demand for real-time metabolic imaging in outpatient settings.
Ultrasound benefits from handheld transducers that cost a fraction of cart-based systems, democratizing access for primary-care physicians. Portable X-ray remains a workhorse in critical-care wards and nursing homes due to its speed and low radiation dose. A niche “Others” cohort—covering photon-counting CT and optical coherence tomography—illustrates the pipeline of next-generation tools set to enlarge the mobile medical imaging services market size for specialized scans over the next decade.

By Service Provider:
Hospital Systems Lead While Home Care AcceleratesHospitals and clinics generated 65.72% of 2025 revenue, translating existing referral streams into bedside imaging capacity. Integrated delivery networks fold mobile fleets into emergency and transplant pathways, capturing economies of scale and simplifying compliance documentation. These incumbents also leverage capital budgets to refresh scanners regularly, maintaining quality benchmarks that reinforce patient trust in the mobile medical imaging services market.
Home-healthcare providers are the fastest-growing cohort, advancing at 5.55% CAGR to 2031 as parity reimbursement legitimizes at-home diagnostics. DispatchHealth and similar players dispatch radiologic technologists alongside nurse practitioners, enabling acute evaluations that previously required ED transfers. A separate “Others” category spans urgent-care franchises, telemedicine hubs and dedicated mobile imaging vendors, each carving micro-niches based on geography or modality specialization. Momentum across these groups illustrates how diversification of provider types propels the broader mobile medical imaging services market.
Geography Analysis
North America Mobile Medical Imaging Services Market
North America retained 40.18% of 2025 revenue on the strength of early FDA clearances, CMS reimbursement innovation and established teleradiology networks. Capital inflows from private equity into imaging chains such as RadNet and RAYUS have reinforced equipment refresh cycles and accelerated fleet acquisitions. Workforce shortages pose headwinds, yet educational pipelines are expanding cohort sizes to moderate future vacancy rates. Overall, the mobile medical imaging services market size in North America is set to increase steadily through 2030 as hospital-at-home pilots transition into mainstream service lines.
APAC Mobile Medical Imaging Services Market
Asia-Pacific represents the fastest-growing region at 5.88% CAGR, driven by rising chronic disease prevalence and large-scale infrastructure spending. Governments in China, India and Indonesia are subsidizing modular clinics equipped with point-of-care scanners to bridge urban-rural divides. Technology licensors such as Hyperfine and Positrigo have signed multi-country distribution agreements that shorten adoption lags. Domestic manufacturers are also scaling production of cost-effective ultrasound and X-ray units, fostering competitive pricing that broadens the mobile medical imaging services market across lower-income provinces.
EMEA and South America Mobile Medical Imaging Services Market
Europe, the Middle East and Africa, and South America display mixed trajectories tied to differing reimbursement climates and currency volatility. European Union adherence to new MDR rules has lengthened product certification cycles but also instilled confidence in device quality. Middle Eastern health-city projects position mobile fleets as interim solutions while permanent facilities rise. Latin American adoption rates hinge on public-private financing partnerships that offset capex barriers. Collectively, these developments echo a global pivot toward decentralized diagnostics that amplifies the footprint of the mobile medical imaging services market.
Regulatory Landscape
Regulation for mobile medical imaging services is shaped by device-market authorization, radiation safety and portable-service licensure. In the United States, the FDA moved quality-system oversight to the Quality Management System Regulation (QMSR) effective February 2, 2026, incorporating ISO 13485:2016 by reference. Imaging-related software functions continue to be handled under FDA device and digital-health frameworks, while CMS rules for portable X-ray suppliers (42 CFR Part 486, Subpart C) link reimbursement participation to compliance with applicable state and local licensing and inspection requirements. For multi-state mobile operators, those licensing and inspection constraints act as a practical gating factor.
Jurisdiction-specific operating constraints also affect fleet deployment and route planning. Several US states maintain explicit limitations on when mobile X-ray can be used, including rules that require mobile use where transfer to stationary installations is impractical, as reflected in state-level requirements such as Nevada and Iowa. Radiation protection is enforced through state codes as well, for example, Ohio Administrative Code provisions for X-ray registration and controls. In Europe, market access for mobile imaging systems continues to be governed by the EU Medical Device Regulation (Regulation (EU) 2017/745), and the shift toward EUDAMED adds operational compliance tasks for manufacturers and certificate holders as module use becomes enforceable in 2026.
Competitive Landscape
The field remains moderately fragmented, with regional specialists competing alongside national hospital networks. RadNet’s USD 103 million purchase of breast-AI vendor iCAD illustrates vertical integration that embeds analytics deeper into workflows. GE HealthCare’s acquisition of Intelligent Ultrasound for USD 51 million expands its ultrasound AI portfolio, signaling continued convergence between equipment and software providers.
Strategic alliances focus on cloud and artificial-intelligence enablement. GE HealthCare and Amazon Web Services cooperate on generative-AI imaging tools that promise faster triage and auto-reporting, raising the technology bar for all participants. Private equity is accelerating roll-ups: Affinity Equity Partners’ USD 658 million bid for a diagnostic imaging group reflects demand for scale benefits in procurement and compliance management. These moves consolidate market share but plenty of white space remains for agile entrants, especially in underserved rural pockets where the mobile medical imaging services industry continues to evolve.
Competition increasingly hinges on workforce models and cyber-security credentials. Operators that can recruit certified technologists and maintain zero-breach records win hospital contracts more readily. AI-driven maintenance schedules and remote diagnostics reduce downtime, enhancing utilization rates. Ultimately, differentiation rests on the seamless integration of hardware, software, staffing and reimbursement know-how, themes that will define leadership positions within the mobile medical imaging services market over the next five years.
Mobile Medical Imaging Services Industry Leaders
-
Akumin Inc (Alliance Healthcare Services)
-
DMS Health Technologies
-
Front Range Mobile Imaging
-
Accurate Imaging Inc
-
Cobalt Imaging Center
- *Disclaimer: Major Players sorted in no particular order
Mobile Medical Imaging Services Market Companies Covered in this Report
- Akumin Inc (Alliance HealthCare Services)
- TridentCare
- DMS Health Technologies
- Cobalt Imaging Center
- Accurate Imaging
- InHealth Group Ltd
- RAYUS Radiology
- Star Equity Holdings (Digirad)
- Front Range Mobile Imaging
- Interim Diagnostic Imaging
- Atlantic Mobile Imaging
- MD Laboratory
- Shared Medical Services
- RadNet Mobile Solutions
- Mobile xUSA
- OnSite Imaging (US)
Market Opportunities and Future Outlook
Hospital-at-home reimbursement and home-based diagnostics create room for mobile imaging providers that can run portable modalities across homes, post-acute sites, and outpatient pathways without depending on fixed suites. A policy signal is the introduction of H.R. 2477 in the 119th US Congress, which proposes Medicare coverage for home-based ultrasound tests. If adopted, it would align with broader decentralization of care and encourage service models that combine dispatch workflows with teleradiology.
Technology and service-model convergence is also changing how providers monetize their installed base. Software-defined upgrades that expand capability from existing imaging assets, including FDA-cleared software enabling 3D imaging on standard C-arm X-ray systems (Provect AI, 2026), support mobile and ambulatory settings where adding CT is cost prohibitive. Demand for scale is showing up through consolidation and long-duration outsourcing contracts as well, including medneo expanding in the United Kingdom via acquisition of Ramsay Health Care UK mobile imaging assets and a multi-year exclusive mobile imaging agreement (2026). These deals point to continuing demand for national fleet coverage and standardized service levels, which smaller regional operators can pursue through modality specialization (for example, mobile mammography) or through partnership-led network coverage.
Recent Industry Developments in Mobile Medical Imaging Services Market
- July 2026: medneo acquired Ramsay Health Care UK mobile MRI and CT assets and entered a six-year exclusive mobile imaging contract. The deal expands medneo's fleet footprint and adds recurring demand through a long-duration service agreement, increasing competitive pressure on regional mobile operators in the UK.
- July 2025: A federal court declined to dismiss negligence and breach of contract claims tied to a data breach involving DMS Health Technologies. The ruling keeps litigation exposure active and reinforces cybersecurity and endpoint controls as contracting priorities for mobile imaging providers serving distributed sites.
- November 2024: Akumin announced a multi-year, multi-modality strategic alliance with United Imaging and designated its Plantation, Florida location as a national Center of Excellence. The partnership improves access to multi-modality equipment and standardizes operating playbooks, supporting faster fleet refresh cycles and broader modality coverage for mobile service delivery.
Mobile Medical Imaging Services Market Report Scope and Research Methodology
Market Definition and Coverage
The mobile medical imaging services market covers revenue earned from delivering diagnostic imaging at the patient location using mobile units and clinical staff, instead of routing the patient to a fixed imaging department. It includes service delivery across common modalities used for diagnostic workups in hospitals, clinics, and care facilities.
Scope exclusions: We exclude sales of imaging equipment and software sold as products, and we exclude purely in-house hospital imaging that is not delivered as a mobile service.
Segments Covered in This Report
- By Service Type
- X-ray
- Ultrasound
- Magnetic Resonance Imaging (MRI)
- PET/CT
- Others
- By Service Provider
- Hospitals and Clinics
- Home-Healthcare Providers
- Others
- By Geography
- North America
- United States
- Canada
- Mexico
- Europe
- Germany
- United Kingdom
- France
- Italy
- Spain
- Rest of Europe
- Asia-Pacific
- China
- Japan
- India
- Australia
- South Korea
- Rest of Asia-Pacific
- Middle East and Africa
- GCC
- South Africa
- Rest of Middle East and Africa
- South America
- Brazil
- Argentina
- Rest of South America
- North America
Data Sources, Market Sizing, and Validation
Desk Research
Desk research started with defining the service boundary and the demand setting, and then collecting anchor indicators that signal imaging usage outside fixed sites of care. Public sources were reviewed for healthcare capacity and utilization context, such as CDC datasets, CMS fee schedules and utilization dashboards, OECD Health Statistics, WHO health expenditure profiles, and IAEA resources on diagnostic imaging access.
To translate those signals into a market model, we also reviewed provider websites, annual reports and investor presentations, reimbursement policy notes, and reputable press coverage to understand modality mix, site-of-care shifts, and service delivery constraints. Where available, paid subscriptions for company financials and news, patent databases, and shipment-level import-export views were used to cross-check timelines and equipment movement signals that align with mobile deployments. The desk sources listed here are illustrative, and additional public and paid references were used for data collection, validation, and clarification.
Primary Interviews and Surveys
Primary work was used to pressure-test the desk assumptions, especially around utilization per mobile unit, average contracted pricing, staffing constraints, and how modality mix changes by care setting. We spoke with service providers, hospital and clinic administrators, radiology operations leaders, and channel-side experts across major regions, so the model reflects contracting and referral behavior that aligns with how services are actually purchased and scheduled, not just published averages.
Distribution of primary research fieldwork respondents
| Company type | Respondent position | Region |
|---|---|---|
| Top tier: 26% | CXOs: 16% | APAC: 42% |
| Mid tier: 57% | Functional/Unit leaders: 35% | EMEA: 33% |
| Smaller Players: 17% | Managers: 49% | Americas: 25% |
Market-Sizing & Forecasting
Our sizing starts with a top-down build where imaging procedure demand is reconstructed from site-of-care activity and modality usage, and then allocated to the share that is practically served through mobile delivery. That demand pool is converted to value using price points that reflect the service bundle (scan delivery, staffing, transport and setup, and basic reporting support where applicable), and it is then reconciled by region.
To keep the model grounded, a few inputs were treated as primary levers, such as the share of imaging shifted to outpatient and long-term care settings, the installed and active mobile unit base, average scans per unit by modality, reimbursement and contracted rate ranges, and utilization swings tied to staffing availability and turnaround expectations. Bottom-up checks were then applied selectively, using provider roll-ups, sampled contract pricing, and capacity logic (units times workable scan slots) to validate totals and to handle gaps where unit counts or utilization disclosures are uneven by country.
For forecasting, scenario analysis was used so the outlook can reflect different adoption speeds for decentralized care, reimbursement changes, and modality mix shifts (for example, MRI versus ultrasound and X-ray). The variable paths were reviewed with interview inputs, and the final forecasts were set only after the implied utilization and pricing trends stayed consistent with what practitioners said is feasible year to year.
Data Validation & Update Cycle
Validation is done in layers so outliers do not silently pass through the model. We compare the market outputs against independent signals such as imaging procedure trends, care setting utilization, and provider expansion announcements, and then we check whether implied pricing and unit productivity look realistic for each modality.
If large variances show up by region or modality, assumptions are revisited and experts are re-contacted to confirm whether the variance is a true market shift or a modeling artifact. Before sign-off, the work goes through multiple analyst reviews focused on arithmetic checks, consistency across sections, and sensitivity to key variables. Reports are refreshed annually, with interim updates when material events change pricing, reimbursement, or service availability, and a final pre-delivery pass is completed so the published view is current.
Mordor Intelligence's Mobile Medical Imaging Services Market Size Measured Against Other Published Estimates
Published market values for mobile medical imaging services often differ because the service boundary is not identical across sources, and because pricing and utilization are not updated at the same time. Currency conversion timing, the treatment of bundled versus unbundled service pricing, and how quickly new reimbursement signals are reflected can move the final number by a visible margin.
In this study, the 2026 value is kept aligned to recent pricing checks and consistent FX timing, and utilization per unit is re-tested when new provider capacity or staffing constraints are reported, which is why the refresh cadence and validation checkpoints embedded in Mordor Intelligence support where the estimate lands.
Benchmark comparison
| Source | Market Size | Gaps in Research Methodology |
|---|---|---|
| Mordor Intelligence | USD 17.31 B (2026) | |
| Industry Publisher A | USD 6.22 B (2025) | Uses a narrower definition closer to mobile imaging as a subset, and the base-year value is shaped by different pricing bundles and a longer-dated utilization assumption set, which can understate full-service mobile delivery revenue. |
| Media Brief B | USD 2.20 B (2026) | Often reflects a smaller addressable scope and conservative service pricing, and it may combine limited modality coverage with simplified currency timing, which reduces comparability with a full global services build. |
Overall, the spread in published numbers is explained mainly by what each source counts as a mobile service, how modality and end-use boundaries are drawn, and whether pricing and FX are updated close to the sizing year. By tying the model to clear demand indicators (procedure setting shifts, active unit capacity, and realistic scans per unit) and then validating price logic through primary checks, the final value stays traceable and repeatable.
Key Questions Answered in the Report
What is the forecast CAGR for the mobile medical imaging services market to 2031?
The market is expected to expand at a 4.07% CAGR between 2026 and 2031.
Which service type currently commands the largest revenue share?
Magnetic resonance imaging leads with 36.35% of revenue in 2025.
Why is PET/CT the fastest-growing modality?
Growth is propelled by increasing demand for cardiac perfusion and oncology imaging, translating into a 5.61% CAGR through 2031.
How are reimbursement reforms influencing adoption?
Medicare parity for remote diagnostics and private-payer alignment enable providers to deploy mobile fleets without revenue penalties, accelerating uptake across home-healthcare settings.
What is the main operational challenge for providers?
A shortage of certified technologists, with vacancy rates exceeding 18%, is the principal bottleneck, raising labor costs and limiting fleet expansion.
Which region offers the highest growth potential?
Asia-Pacific is projected to achieve the fastest regional growth at a 5.88% CAGR, driven by healthcare infrastructure expansion and an aging population.