
Mobile Marketing Market Size and Share
Market Overview
| Study Period | 2020 - 2031 |
|---|---|
| Market Size (2026) | USD 30.30 Billion |
| Market Size (2031) | USD 66.31 Billion |
| Growth Rate (2026 - 2031) | 16.98 % |
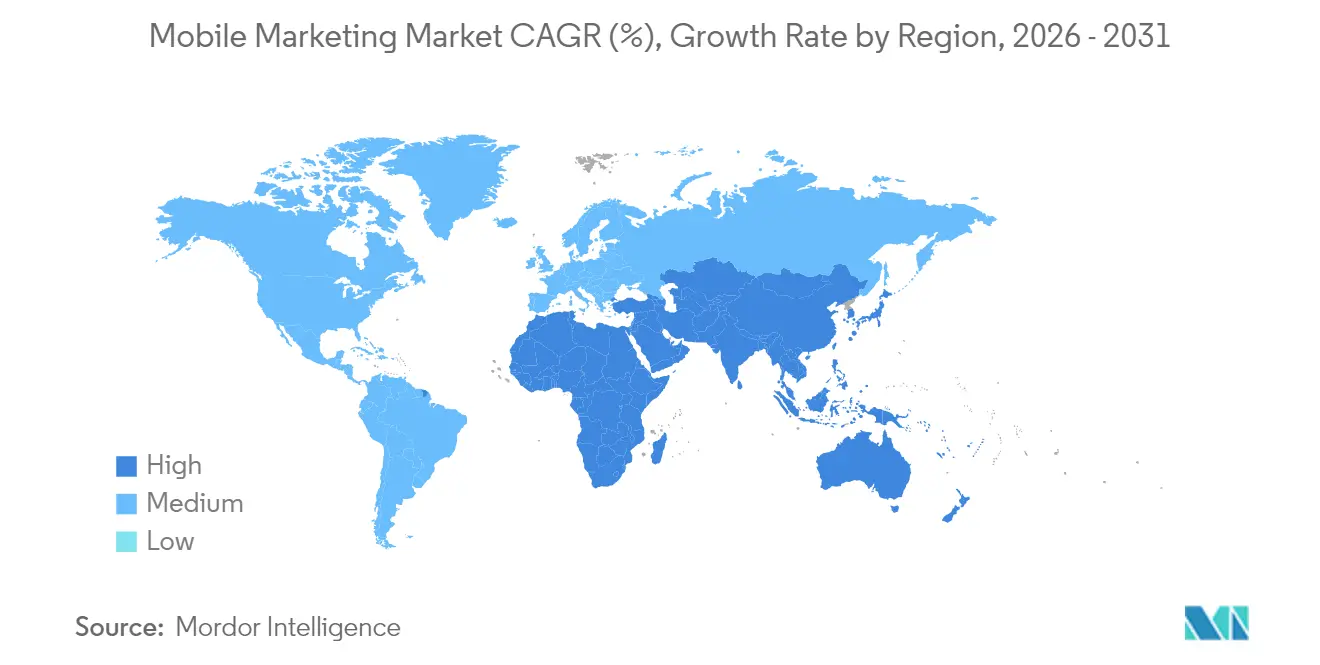
| Fastest Growing Market | Asia Pacific |
| Largest Market | North America |
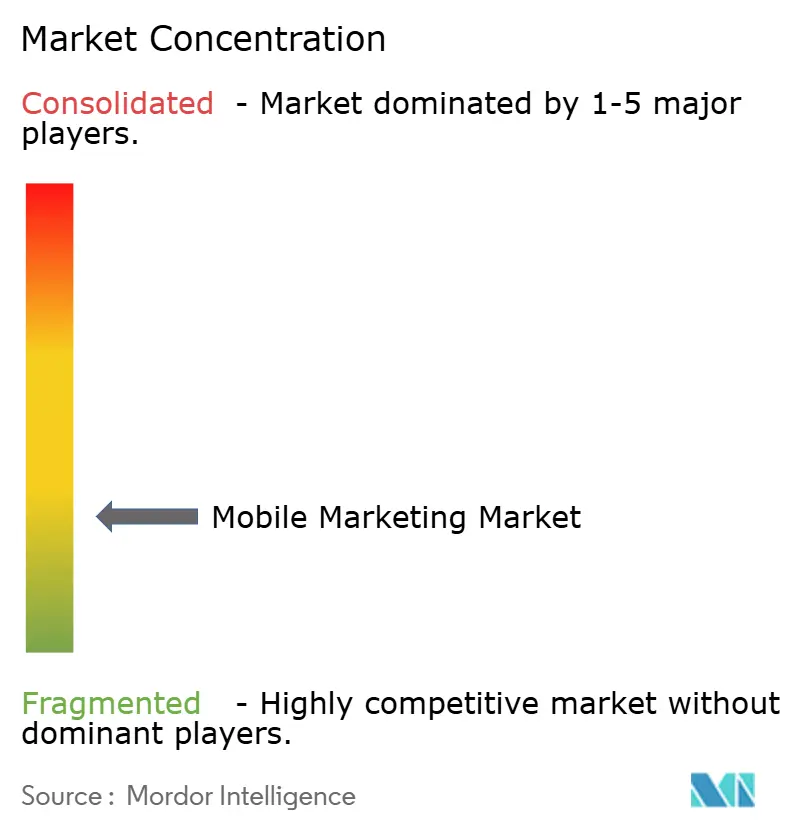
| Market Concentration | Low |
Major Players *Disclaimer: Major Players sorted in no particular order Image © Mordor Intelligence. Reuse requires attribution under CC BY 4.0. | |
Mobile Marketing Market Analysis by Mordor Intelligence
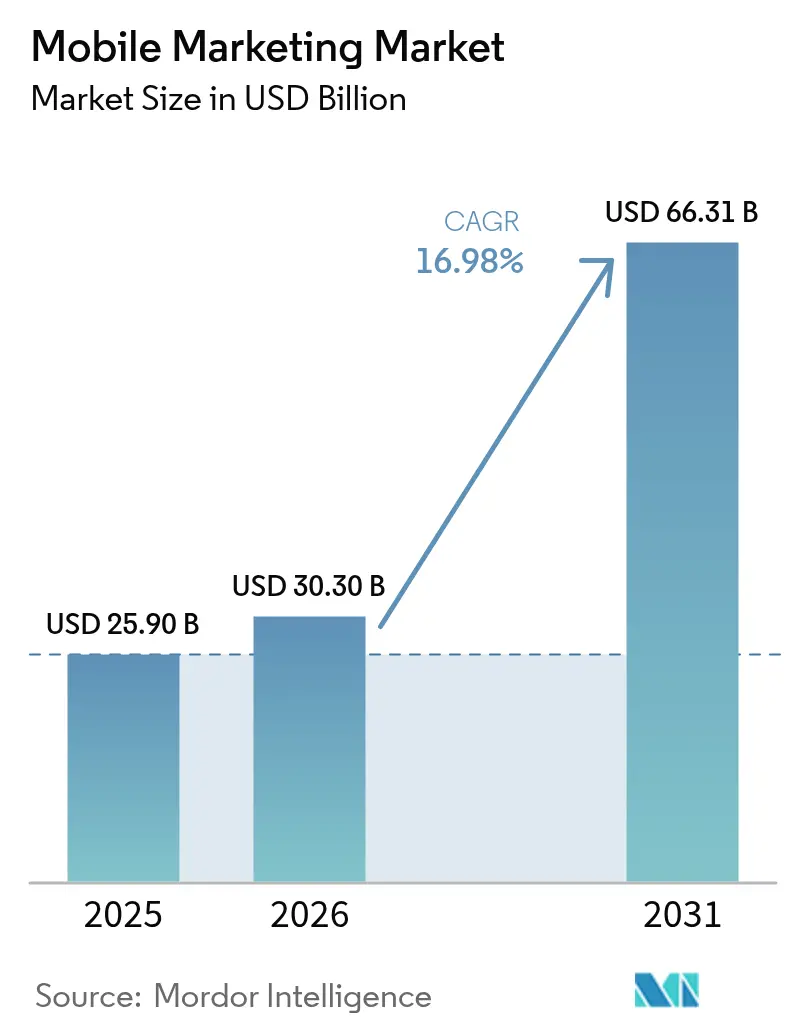
The mobile marketing market size is expected to grow from USD 25.9 billion in 2025 to USD 30.3 billion in 2026 and is forecast to reach USD 66.31 billion by 2031 at 16.98% CAGR over 2026-2031. Continuous migration of discovery, evaluation, and purchase to handheld screens has turned smartphones into the default entry point for commerce, media, and customer service. Advertisers are therefore diverting budgets toward data-rich engagement moments where identity resolution, consent management, and creative automation converge inside one workflow. Platform providers that integrate these functions under a single user interface are winning incremental spend, because brand teams can test, measure, and optimise journeys without toggling between tools. Asia-Pacific’s 20% CAGR signals the compounding effect of 5G coverage, digital wallets, and super-app ecosystems, while Europe’s stringent privacy rules push marketers to fortify first-party data assets and closed-loop measurement.
Key Report Takeaways
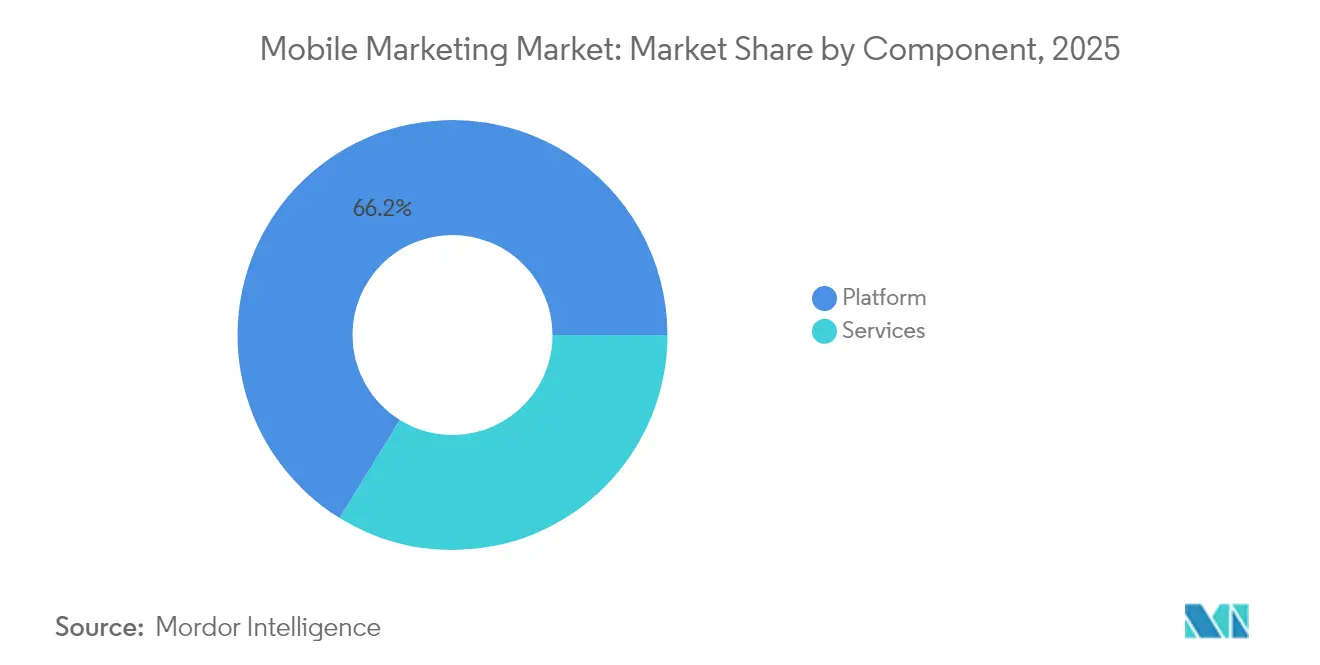
- By component, platform software captured 66.20% of the mobile marketing market share in 2025, whereas services revenue is expanding at the fastest clip.
- By solution type, location intelligence accounted for a mid-teen slice of the mobile marketing market size in 2025 and is projected to expand at a 21.3% CAGR to 2031.
- By distribution channel, social media held roughly one-third of global expenditure in 2025, while affiliate models exhibit the highest forecast growth trajectory.
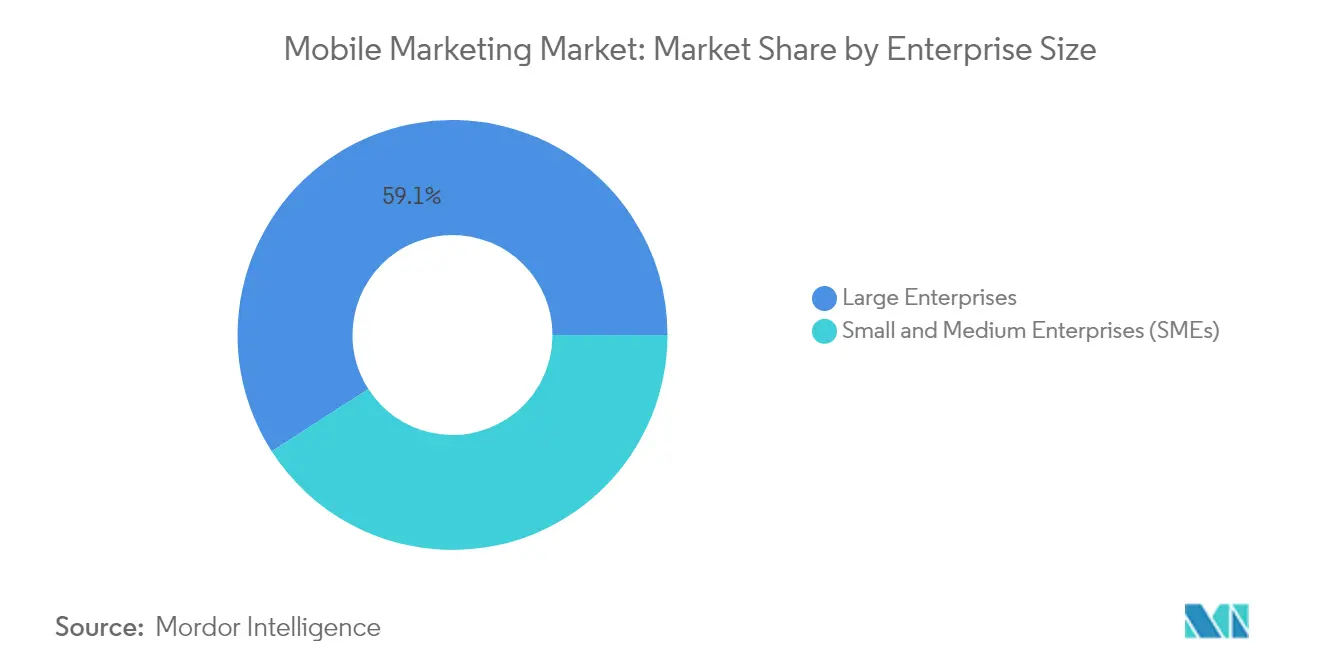
- By enterprise size, large enterprises commanded 59.10% of 2025 revenue, although small and medium enterprises are narrowing the gap through subscription AI suites.
- By end-user industry, retail and e-commerce contributed nearly 24.96% of the mobile marketing market size in 2025; healthcare is advancing at the fastest pace through 2031.
- By geography, North America led with 37.60% revenue share in 2025, whereas Asia-Pacific is projected to expand at a 19.2% CAGR through 2031.
Note: Market size and forecast figures in this report are generated using Mordor Intelligence’s proprietary estimation framework, updated with the latest available data and insights as of 2026.
Market Trends and Insights
Drivers Impact Analysis of Mobile Marketing Market*
| Driver | (~) % Impact on CAGR Forecast | Geographic Relevance | Impact Timeline |
|---|---|---|---|
| Privacy-safe identifier frameworks | +3.2% | North America, Europe | Short term (≤ 2 years) |
| 5G roll-outs | +2.8% | Asia, North America | Medium term (2-4 years) |
| Quick-commerce apps | +1.5% | South America, Asia | Short term (≤ 2 years) |
| Retail media networks | +2.4% | Europe, North America | Long term (≥ 4 years) |
| Source: Mordor Intelligence | |||
Privacy-safe identifier frameworks lifting in-app returns in North America
Server-side event collection and consented device tokens are replacing browser-level cookies across major United States publishers. Brands embedding these frameworks report doubled-digit improvements in match rates, enabling richer segmentation while meeting state-level privacy mandates. The same mechanisms automate compliance reporting, allowing finance teams to capitalise on privacy upgrades as technology investments. Marketing and risk units, therefore, align on shared metrics, and advertisers can sustain personalised outreach even as regulations tighten. These gains validate that compliant identity resolution is becoming a growth accelerator rather than a cost centre.
5G roll-outs enabling ultra-low-latency campaigns across urban Asia
Commercial 5G networks now serve most tier-one Asian cities, pushing average mobile video load times well below 100 milliseconds. Marketers respond with interactive augmented-reality product demos that let users virtually place items in their environment before one-tap checkout. Live A/B switches executed at the network edge during a 2024 gaming convention in Seoul cut abandonment by nearly 25% versus identical creative on 4G. The experience reveals that bandwidth acts as a creative canvas, spurring immersive storytelling rather than functioning only as a distribution upgrade. As 5G densifies, the mobile marketing market will see richer asset formats and higher conversion efficiency.
Quick-commerce boom drives specialised notification spend in South American capitals
Grocery-within-the-hour platforms in São Paulo and Bogotá rely on artificial-intelligence engines that time push alerts around inventory snapshots, temperature swings and traffic feeds. The most effective implementations schedule recipe-based offers just before meal-planning windows, converting perishable stock into steady turnover while raising customer lifetime value. Device permission tokens begin to act as tradable assets, turning audience curation into a strategic imperative for every logistics-driven retailer. As marketplaces scale, incremental notification volume flows directly into the mobile marketing market without burdening acquisition budgets.
Retail media networks reshape European campaign supply chains
Large European retailers are converting app-based loyalty data and point-of-sale records into self-service ad dashboards that guarantee attribution from impression to till. Advertisers tapping these networks receive SKU-level reporting within days, enabling daily budget rebalancing between end-caps, in-app banners, and mobile coupons. The economics invert the traditional agency hierarchy because media decisions now begin with shelf data rather than third-party segments. Brands benefit from faster cycle times, while retailers open a high-margin revenue stream that offsets thin in-store profitability. Closed-loop attribution also protects compliance in regions with strict consent requirements.
Restraints Impact Analysis of Mobile Marketing Market*
| Restraint | (~) % Impact on CAGR Forecast | Geographic Relevance | Impact Timeline |
|---|---|---|---|
| Cookieless policies | -2.1% | Global | Short term (≤ 2 years) |
| Telco SMS firewall upgrades | -1.2% | Africa, Middle East | Medium term (2-4 years) |
| Source: Mordor Intelligence | |||
Cookieless policies disrupt cross-app attribution worldwide
Third-party cookies are vanishing from mainstream browsers, shrinking cross-device graphs, and forcing marketers toward probabilistic measurement and incrementality experiments. Finance controllers who relied on user-level reports now train on lift-based dashboards focused on causal contribution. Learning cycles lengthen, yet budget allocations gradually stabilise because probabilistic signals tolerate privacy volatility. While performance marketers face near-term friction, the shift ultimately produces more resilient planning processes, cushioning the mobile marketing market against future regulatory swings.
Telco SMS firewall upgrades escalate A2P costs in Africa
Mobile operators across sub-Saharan Africa upgraded enterprise firewalls to block grey-route traffic, raising legitimate per-message fees by as much as one-third. Financial-services apps consolidated verification flows, sending single SMS tokens that unlock multiple in-session actions rather than separate codes for each task. Marketers also explore rich communication services as an alternative path, nudging carriers to refine pricing models to keep volume steady. Elevated costs slow spend growth, trimming the mobile marketing market’s trajectory in voice- and SMS-heavy economies until alternative channels mature.
*Our forecasts treat driver/restraint impacts as directional, not additive. The impact forecasts reflect baseline growth, mix effects, and variable interactions.
Mobile Marketing Market Segment Analysis
By Component:
software dominance and services accelerationPlatform software contributed 66.20% of 2025 revenue, affirming its status as the operating backbone of the mobile marketing market. Vendors embed low-code journey builders and privacy dashboards that let brand teams test rules in near real time without engineering support. Services lines, though smaller, are expanding faster as enterprises seek guidance on clean-room deployment, creative automation and regional regulations. Advisory practices pivot from media arbitrage to technical enablement, carving fresh fee pools and rebalancing value capture along the supply chain. Over the forecast horizon, software upgrades will sustain retention, while service engagements deepen customer lock-in.
Technical services also mediate complex data-sharing agreements between advertisers and publishers, smoothing the adoption of consented identifiers. This dual need for technology and expertise positions hybrid providers to harvest greater wallet share. As a result, the mobile marketing market size tied to component services is projected to outpace overall market growth, even as software retains lead share.

By Solution Type:
location intelligence ascendsLocation intelligence holds a mid-teen fraction of the mobile marketing market size and is poised for a 21.3% CAGR, eclipsing other solution clusters by 2031. Enhanced stacks blend GPS, Bluetooth beacons, and venue Wi-Fi, pinpointing shopper dwell zones with sub-metre accuracy. Moment-specific offers then outperform generic coupons on redemption and basket value metrics. QR codes re-emerge as bridge technology between shelf and screen; a 2025 soft-drink promotion in Berlin used under-cap serialised codes to funnel consumers into a mobile game with instant rewards.
Push alerts remain indispensable for their superior open rates, but orchestration engines throttle frequency against predicted fatigue to prevent opt-outs. As retailers embed rich media into these alerts, location signals further sharpen timing, deepening engagement, and raising spending per user. Providers that integrate mapping APIs, analytics, and creative tooling within one interface widen their moat and expand their share within the wider mobile marketing market.
By Distribution Channel:
social media scale and affiliate agilitySocial media accounted for roughly one-third of global 2025 spending, thanks to unmatched reach and auction formats that reward creative novelty. Short-form video surges, prompting weekly asset refresh instead of quarterly cycles. Affiliate channels, reimbursed strictly on delivered sales or installs, record the fastest growth because variable-cost structures appeal to finance chiefs amid macroeconomic uncertainty. A 2024 Paris fashion house paired nano-influencers with exclusive discount links, doubling conversion relative to flat-fee posts while capping downside risk.
Messaging-led commerce also gains momentum as brands integrate product catalogues directly into chat threads, compressing the path to purchase. As auction algorithms favour creators who sustain high engagement, advertisers diversify into micro-communities to maintain efficiency. This dynamic keeps the mobile marketing market diversified across paid social, affiliate, and messenger ecosystems, cushioning against policy-driven shocks from any single platform.
By Enterprise Size:
large budgets meet agile challengersLarge enterprises still delivered 59.10% of 2025 revenue because scale secures premium data partnerships and beta-release ad formats. Yet subscription-priced AI suites narrow capability gaps for small and medium businesses, automating copywriting, bidding, and segmentation. In 2025, a Buenos Aires artisanal coffee chain used text-to-design tools to localise ads across four neighbourhoods, achieving return on ad spend previously associated with national chains. Lower entry barriers invite more merchants, broadening the sales funnel for vendors in the mobile marketing market.
Enterprise-grade features such as brand safety and cross-channel orchestration trickle down into SME-tier products, while usage-based pricing avoids upfront capex. Conversely, large organisations invest in private data clean rooms to comply with global privacy rules, reinforcing their need for custom professional services. This bifurcation sustains distinct growth lanes yet keeps overall competition intense.
By Deployment Mode:
cloud momentum with regulated caveatsCloud delivery dominates new deployments because instant scalability and auto-updates match campaign seasonality and regulatory flux. Banking and public health sectors still opt for hybrid topologies, keeping personally identifiable information on-premises while routing event streams to the cloud for analytics. A 2024 public hospital network in Singapore adopted this model, cutting queue latency for appointment reminders without moving patient records off-site.
Edge workloads also rise as 5G network slices enable creative swaps within milliseconds, aligning compute location with campaign logic. Vendors offering flexible schemas that pivot between full cloud, hybrid, and edge stand to capture cross-sector demand, deepening their footprint in the mobile marketing market.
By End-user Industry:
retail dominance and healthcare surgeRetail and e-commerce delivered nearly 24.96% of 2025 revenue, leveraging purchase histories to serve one-to-one offers during peak sales. Marketplace operators turn loyalty IDs into deterministic graphs, lifting return on ad spend. Healthcare posts the fastest forecast CAGR as patient demand for self-service portals climbs; CVS Health’s 2025 super-app blends prescription refills, vaccination scheduling, and AI-curated tips, generating zero-party data for future personalisation .
Media and entertainment firms apply usage analytics to reduce churn, while banks bind devices to accounts to balance security with convenience. These sector-specific needs diversify demand drivers, keeping the mobile marketing market resilient to cyclical shocks in any single vertical.
Geography Analysis
North America Mobile Marketing Market
North America generated 37.60% of 2025 revenue, underscoring its role as a test bed for ad-tech innovation. State privacy amendments accelerate first-party data programs, leading to higher match rates and compliant identity graphs. Event-grade location platforms emerge ahead of the 2028 Los Angeles Olympics, merging ticketing, concessions, and sponsor messaging into unified mobile flows. Trials during the 2024 football playoffs demonstrated that dynamic offers aligned with concession wait times raised per-capita spend without adding foot traffic, showing operational upside beyond media value. Venture investment remains steady as publishers race to integrate privacy-safe IDs, supporting the broader mobile marketing market.
APAC Mobile Marketing Market
Asia-Pacific is forecast to post a 19.2% CAGR, reflecting the compounding effect of 5G speed, super-app ecosystems, and social commerce norms. A 2024 cosmetics campaign inside a leading Southeast Asian super-app combined augmented-reality try-ons with in-chat checkout, shrinking purchase journeys to under 60 seconds and tripling unit sales. In India, vernacular voice search expands reach, prompting platform owners to launch speech-driven ad formats for low-literacy segments. These innovations confirm that adoption curves depend on cultural habits as much as technology readiness. Rapid smartphone replacement cycles and low data costs further expand the mobile marketing market.
Europe Mobile Marketing Market
Europe’s stringent privacy statutes restrict cookie-based reach, but retailers counter by monetising loyalty programs through closed-loop retail media networks. A 2025 Dutch grocery chain launched a self-service portal where suppliers buy sponsored product tiles that extend into the chain’s mobile wallet, enabling end-to-end attribution within days. Nordic countries, although smaller, record the continent’s highest per-user mobile engagement, proving that privacy-respecting personalisation thrives when consumer trust is secured. Regulatory clarity dampens short-term growth yet fosters long-term stability, supporting steady expansion of the mobile marketing market across the region.
Regulatory Landscape
Mobile marketing is shaped by a tightening mix of platform policy and privacy and competition rules that affect identity, targeting, and advertising transparency. In the European Union, the Digital Markets Act (Regulation (EU) 2022/1925) and the Digital Services Act (Regulation (EU) 2022/2065) impose gatekeeper and platform obligations that interact with GDPR and the ePrivacy Directive for mobile identifiers, SDK data collection, and consent flows. In April 2026, the European Commission published its DMA review report (COM(2026) 178), which keeps compliance requirements high for large platforms involved in mobile ad distribution and measurement.
Enforcement and guidance are also increasingly focused on app-level data processing and standardized consent strings. France’s CNIL issued an updated recommendation on mobile application data processing in April 2025 (Deliberation No 2025-024), clarifying expectations for app publishers and SDK providers around consent, tracking, and data minimization. Industry compliance infrastructure has evolved in parallel, including IAB Europe’s move to TCF v2.3 (with a March 2026 transition milestone reflected in platform policy guidance such as Google AdMob), which pushes advertisers, publishers, and intermediaries to strengthen consent management and auditability across in-app supply chains.
Value Chain Analysis
The mobile marketing value chain begins with data and identity inputs (first-party app events, consent signals, device tokens, and location signals where permitted), moves into campaign planning and creative (brands, agencies, and creative automation suites), and then connects to buying and delivery infrastructure (DSPs, ad exchanges/SSPs, mediation layers, and platform-owned networks). On the supply side, publishers, app developers, and mobile gaming studios provide inventory, while OEMs and carriers can influence reach through device distribution and messaging channels (SMS/MMS and emerging rich messaging), with addressability ultimately depending on permissions granted or withheld by end users.
Value capture and friction concentrate in measurement, mediation, and transparency. App inventory can move through long programmatic paths where the same impression is resold multiple times, raising fees and increasing duplication. That has driven supply path optimization programs that consolidate spend toward fewer, more direct routes. OEM-level distribution partnerships also create upstream control points outside standard in-app auctions; for example, AVOW’s July 2025 partnership with HONOR to integrate Dynamic Preloads during out-of-box device setup (via Google Play Auto Install) gives app marketers access to a high-intent moment before typical app store discovery and paid media competition.
Competitive Landscape
Global platform incumbents defend their share through proprietary operating systems, while specialised mid-cap vendors differentiate on feature depth. Competition increasingly pivots on data governance rather than raw inventory access; suppliers offering privacy-preserving analytics and creative automation in one console achieve higher renewal rates. Strategic partnerships rise: a 2024 alliance between a leading creative-cloud provider and a productivity-software giant injects real-time campaign insights into everyday office suites, reducing approval cycles and increasing asset throughput [2].
Telcos leverage 5G edge capabilities to serve premium ad slots tied to carrier first-party data, hinting at a future where network operators influence the advertising stack. Meanwhile, device manufacturers internalise ad sales; Apple began selling premium inventory inside Apple News in March 2025, signalling intent to capture more value in-house. Regulatory rulings also reshape structure: an April 2025 US court order seeks structural remedies for Google’s ad-tech stack, raising prospects of asset divestiture[3].
Market entry costs stay moderate because cloud-native architectures compress infrastructure expenses, yet switching costs remain high due to data lock-in. Vendor roadmaps converge around server-side tracking, consent management and AI-assisted creative, leading to functional parity at the feature layer. As differentiation narrows, service quality, ecosystem partnerships and compliance certifications drive buyer choice, maintaining robust rivalry within the mobile marketing market.
Mobile Marketing Industry Leaders
-
Alphabet Inc. (Google)
-
Meta Platforms Inc.
-
Apple Inc. (Apple Advertising)
-
Microsoft Corporation
-
Amazon.com Inc. (Amazon Ads)
- *Disclaimer: Major Players sorted in no particular order
Mobile Marketing Market Companies Covered in this Report
- Alphabet Inc. (Google)
- Meta Platforms Inc.
- Apple Inc. (Apple Advertising)
- Microsoft Corporation
- Amazon.com Inc. (Amazon Ads)
- Twitter/X Corp.
- Snap Inc.
- Pinterest Inc.
- Verizon Communications Inc. (Yahoo Advertising)
- ATandT Inc.
- InMobi Pte Ltd
- AppLovin Corporation
- GroundTruth
- Criteo S.A.
- Airship
- Adobe Inc.
- Oracle Corporation
- Salesforce Inc.
- Publicis Groupe (Phonevalley)
- AdColony Inc.
- MoPub (AppLovin Exchange)
Market Opportunities and Future Outlook
A key opportunity area is privacy-compliant addressability and measurement infrastructure that reduces dependence on deprecated cross-site identifiers while keeping mobile campaigns attributable. Standardization efforts around automation and protocols reinforce this direction: in March 2026, IAB Tech Lab launched an Agent Registry and positioned agentic standards (including workstreams such as Agentic Bid and Agentic Mobile in its 2026 roadmap) to make automated buying and verification more interoperable across the open ecosystem. Vendors that bring consent management, server-side event collection, and lift or incrementality tooling into one workflow are being pulled into larger budgets as marketers shift from user-level tracking to compliant, probabilistic measurement.
Another visible whitespace is high-intent mobile surfaces and commerce-linked creatives that shorten the path from engagement to purchase, particularly within super-app ecosystems, retail apps, and messaging-led journeys. In regulated markets, clearer app guidance also directs investment toward compliant SDK governance and data minimization programs, with CNIL’s April 2025 mobile app recommendation providing a concrete example of regulator-driven requirements for app publishers and SDK providers to upgrade consent architecture and documentation. Separately, emerging conversational and AI-driven consumer touchpoints are opening incremental mobile inventory, including early 2026 moves toward advertising programs on AI assistants, which increases demand for creative formats, brand-safety controls, and measurement approaches tailored to these new surfaces.
Recent Industry Developments in Mobile Marketing Market
- July 2026: Meta quietly launched Pocket, a mobile app that generates interactive AI experiences, initially reported as a soft launch in Brazil. The app expands Meta-adjacent mobile engagement surfaces and creates additional inventory and data signals that can feed performance marketing and creative testing workflows.
- June 2026: Google, Meta, Moloco, and Unity announced a definitive investment agreement in AppsFlyer, backing a major independent mobile measurement platform. The transaction highlights the strategic premium on neutral attribution and measurement infrastructure as signal loss and platform privacy controls increase pressure on ROI proof.
- April 2025: A United States federal ruling ordered structural remedies for Google’s ad-tech stack. The decision raised the prospect of changes to how mobile inventory and ad-tech services are bundled, influencing negotiation leverage across publishers, intermediaries, and buyers.
Mobile Marketing Market Report Scope and Research Methodology
Market Definition and Coverage
This market is defined as the revenue earned from technologies and services used to deliver marketing messages and ads to consumers on smartphones and tablets, across channels such as in-app, mobile web, SMS/MMS, push notifications, and location-aware outreach.
Scope exclusions: We exclude desktop-only digital advertising, connected TV advertising, device hardware sales, and standalone marketing analytics tools that do not activate campaigns on mobile endpoints.
Segments Covered in This Report
- By Component
- Platform
- Services
- By Solution Type
- Mobile Web
- SMS and MMS
- Location-Based Marketing / Geofencing
- In-App and In-Game Advertising
- Push Notification and Rich Media
- QR-Code and Proximity Marketing
- Emerging (AR/VR, Beacons, 5G Edge)
- By Distribution Channel
- Social Media Marketing
- Affiliate Marketing
- Omni-Channel / Retail Apps
- Content and Influencer Marketing
- Online Public Relations
- Email and SMS Campaigns
- In-Game / Esports
- By Enterprise Size
- Large Enterprises
- Small and Medium Enterprises (SMEs)
- By Deployment Mode
- Cloud
- On-Premises
- By End-user Industry
- Retail and E-commerce
- Media and Entertainment / OTT
- BFSI
- Healthcare and Life Sciences
- Travel, Tourism and Hospitality
- Telecommunications
- Automotive
- Education
- Others (Government, Utilities)
- By Geography
- North America
- United States
- Canada
- Mexico
- South America
- Brazil
- Argentina
- Rest of South America
- Europe
- Germany
- United Kingdom
- France
- Italy
- Spain
- Rest of Europe
- Asia-Pacific
- China
- Japan
- South Korea
- India
- Rest of Asia-Pacific
- Middle East and Africa
- United Arab Emirates
- Saudi Arabia
- South Africa
- Rest of Middle East and Africa
- North America
Data Sources, Market Sizing, and Validation
Desk Research
Desk work starts by mapping what "mobile-delivered" marketing spend looks like in practice, and where it sits inside broader advertising and mar-tech spend. For sizing inputs, we use public sources such as ITU indicators on mobile connections, World Bank macro series, OECD digital economy publications, and US FCC and EU Commission releases, since these provide context on data access and privacy constraints.
We also review company annual reports, 10-K style filings, investor decks, and credible press coverage to track product mix shifts across in-app, messaging, and mobile web formats. Where available, patent databases are checked to sense where ad-tech and messaging automation capabilities are moving, and a paid subscription for company financials and intelligence is referenced to standardize peer comparisons. The examples of sources listed here are not exhaustive, and many other public documents were used for collection, cross-checking, and clarification.
Primary Interviews and Surveys
Primary work was used to pressure-test what counts as mobile marketing revenue, how budgets split by channel, and how pricing changes with inventory quality and targeting limits. We spoke with a mix of platform-side, agency-side, and brand-side roles across APAC, EMEA, and the Americas, so the model can reflect different mobile usage patterns, privacy rules, and typical ad load norms.
Distribution of primary research fieldwork respondents
| Company type | Respondent position | Region |
|---|---|---|
| Top tier: 26% | CXOs: 18% | APAC: 42% |
| Mid tier: 53% | Functional/Unit leaders: 32% | EMEA: 34% |
| Smaller Players: 21% | Managers: 50% | Americas: 24% |
Market-Sizing & Forecasting
Sizing begins with a top-down reconstruction of mobile-first marketing spend by region, where mobile usage indicators, digital ad intensity, and mobile channel penetration are used to build a realistic demand pool. The totals are then corroborated using selective bottom-up checks, such as sampled channel spend ranges from interviews, and sanity checks on implied average pricing and volumes for major mobile formats.
Key model inputs include smartphone and mobile internet penetration, time spent in apps versus mobile web, the share of digital ad budgets allocated to mobile endpoints, messaging and push opt-in behavior (which affects reachable inventory), and pricing progression assumptions for in-app and mobile web placements. For forecasting, scenario analysis is used so the outlook can flex based on privacy-policy enforcement, retail and commerce advertising intensity, and macro ad-spend cycles, which were also discussed with primary respondents. When bottom-up signals are incomplete for a country or channel, gaps are filled using proxy ratios from comparable markets and then rebalanced so regional totals remain consistent.
Data Validation & Update Cycle
We run multi-step checks so the final numbers do not depend on a single dataset or one interview stream. Outputs are compared with independent signals such as mobile ad share within digital, mobile usage growth, and pricing direction for major formats, and then any abnormal jumps are reviewed before sign-off.
A second analyst reviews assumptions and math flow, and we re-contact sources when the model shows inconsistencies that cannot be explained by seasonality, currency timing, or known policy changes. Reports are refreshed annually, with interim updates when material events occur, and a fresh final pass is completed right before delivery so the view is current.
Mordor Intelligence's Mobile Marketing Market Size Compared With Other Published Estimates
Published market values for mobile marketing do not always line up because the market can be scoped in more than one reasonable way, and because different teams pick different timing and pricing assumptions. The biggest differences usually come from what is counted as mobile marketing, how media spend versus software and managed services are treated, and which year is used as the starting point.
The main gap comes from whether estimates fold in wider digital advertising that only partially reaches mobile users, where Mordor Intelligence counts spend only when delivery is clearly tied to smartphone or tablet endpoints across in-app, mobile web, messaging, push, and location-aware outreach. In addition, some figures anchor on a different base year, apply faster price growth in high-value inventory, or use broader currency conversion timing, which can move the total even if the growth story is similar.
Benchmark comparison
| Source | Market Size | Gaps in Research Methodology |
|---|---|---|
| Mordor Intelligence | USD 30.30 B (2026) | |
| Global Consultancy A | USD 30.78 B (2025) | Uses a 2025 base year and may treat parts of broader mobile advertising and adjacent digital spend as mobile marketing, which can shift totals depending on channel mapping and currency timing. |
| Research Publisher B | USD 30.23 B (2026) | Often applies a wider channel list and a longer forecast frame, and the estimate can differ based on how platform services versus pure media placement are bundled in the value calculation. |
Taken together, the spread is explained more by scope and counting rules than by disagreement on demand direction. By keeping inclusions tied to mobile-delivered activation signals and then checking the result with pricing and allocation inputs from interviews, the final number stays transparent and repeatable for planning.
Key Questions Answered in the Report
What is the current size of the mobile marketing market?
The mobile marketing market size stands at USD 30.3 billion in 2026 and is projected to reach USD 66.31 billion by 2031.
Which region is forecast to grow fastest?
Asia-Pacific is expected to post a 19.2% CAGR through 2031, driven by 5G availability, super-app ecosystems and widespread digital wallets.
Which is the fastest growing region in Mobile Marketing Market?
Asia-Pacific is estimated to grow at the highest CAGR over the forecast period (2026-2031).
How are privacy regulations changing campaign strategy?
Marketers are prioritising first-party identifiers and server-side tracking, replacing user-level reports with lift-based dashboards that meet regional compliance standards.
Why are retail media networks gaining traction in Europe?
They offer closed-loop attribution that connects impressions directly to till receipts, letting suppliers verify return on spend without relying on third-party cookies.
Will SMS still matter once RCS encryption becomes standard?
SMS remains essential for critical authentication across heterogeneous devices, although rich communication channels will gradually absorb promotional traffic as security and reach balance out.
How are small businesses competing against larger brands?
Affordable generative-AI creative suites enable small teams to produce, test and iterate high-quality assets rapidly, narrowing historical capability gaps linked to budget scale.