
MMORPG Gaming Market Size and Share
Market Overview
| Study Period | 2020 - 2031 |
|---|---|
| Market Size (2026) | USD 31.02 Billion |
| Market Size (2031) | USD 51.3 Billion |
| Growth Rate (2026 - 2031) | 10.58% CAGR |
| Fastest Growing Market | Asia Pacific |
| Largest Market | North America |
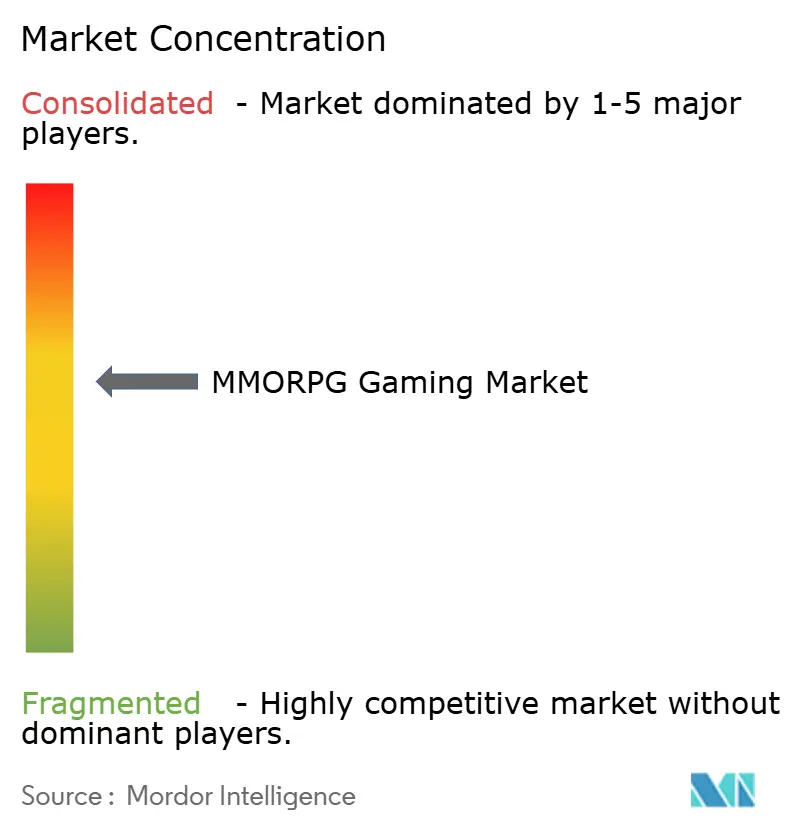
| Market Concentration | Medium |
Major Players *Disclaimer: Major Players sorted in no particular order Image © Mordor Intelligence. Reuse requires attribution under CC BY 4.0. | |
MMORPG Gaming Market Analysis by Mordor Intelligence
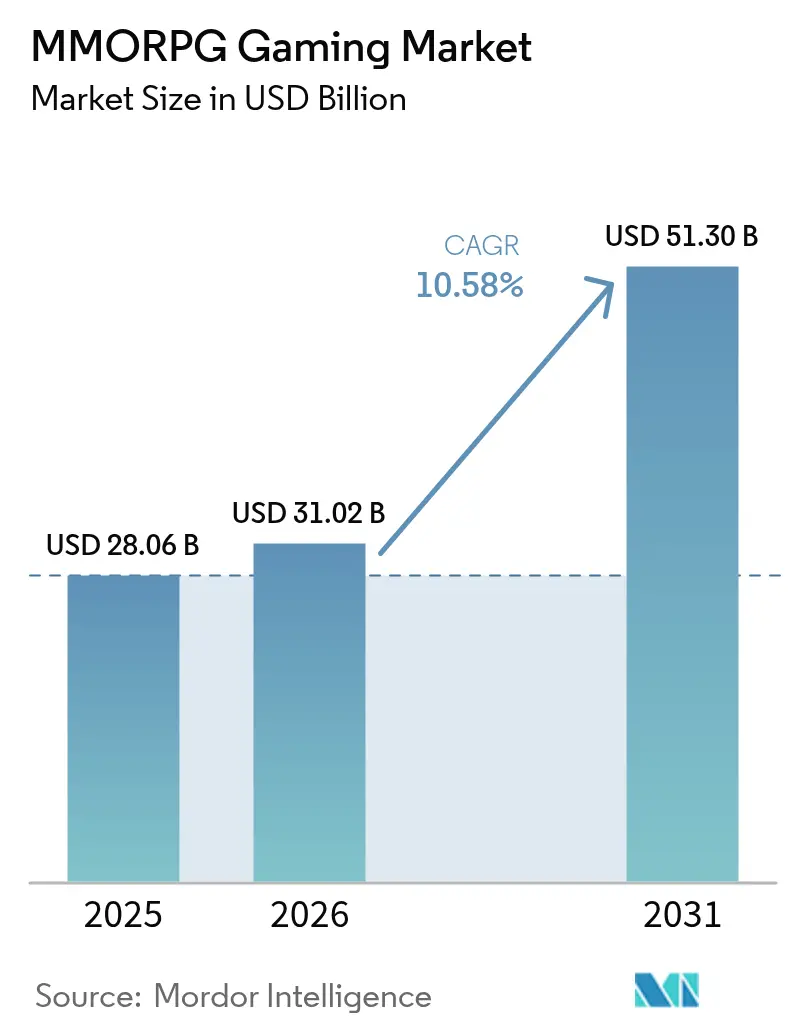
The MMORPG gaming market size is expected to grow from USD 28.06 billion in 2025 to USD 31.02 billion in 2026 and is forecast to reach USD 51.3 billion by 2031 at 10.58% CAGR over 2026-2031. Intensifying cross-platform integration, rapidly maturing mobile hardware, and the shift toward hybrid monetization have moved persistent virtual worlds into the entertainment mainstream. Mobile titles capitalize on ubiquitous 5G connectivity, while AI-enabled dynamic content and player-owned economies powered by blockchain improve lifetime engagement. Publishers increasingly depend on in-game cosmetic sales, season passes, and live-ops events to convert large free player bases into predictable cash flows. Competitive differentiation now hinges on cloud-native architectures that reduce client hardware barriers, real-time analytics that personalize experiences, and government-backed esports programs that legitimize professional play. Together, these forces keep the MMORPG gaming market on a double-digit growth path and widen the addressable audience far beyond the traditional PC enthusiast segment.
Key Report Takeaways
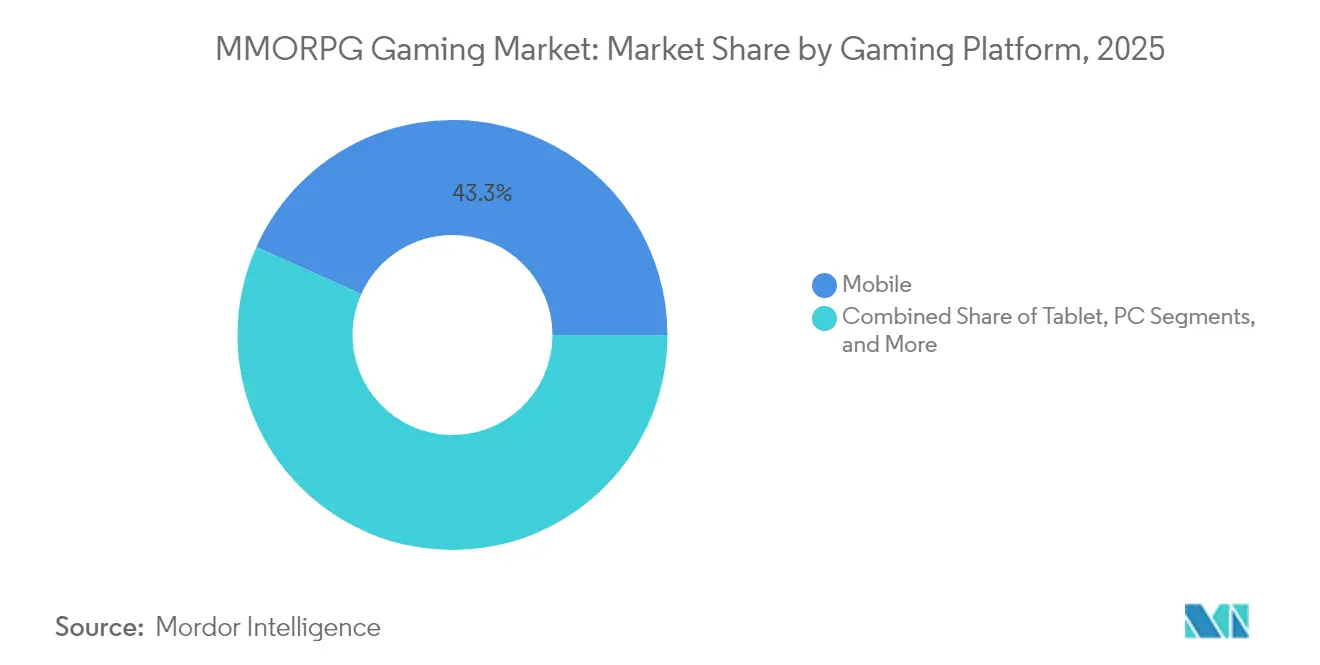
- By gaming platform, mobile led with 43.28% revenue share in 2025 in the MMORPG gaming market, while the same segment is forecast to grow at an 11.12% CAGR through 2031.
- By revenue model, free-to-play captured 57.10% share in 2025 in the MMORPG gaming market; hybrid/season-pass approaches are projected to rise at an 11.2% CAGR to 2031.
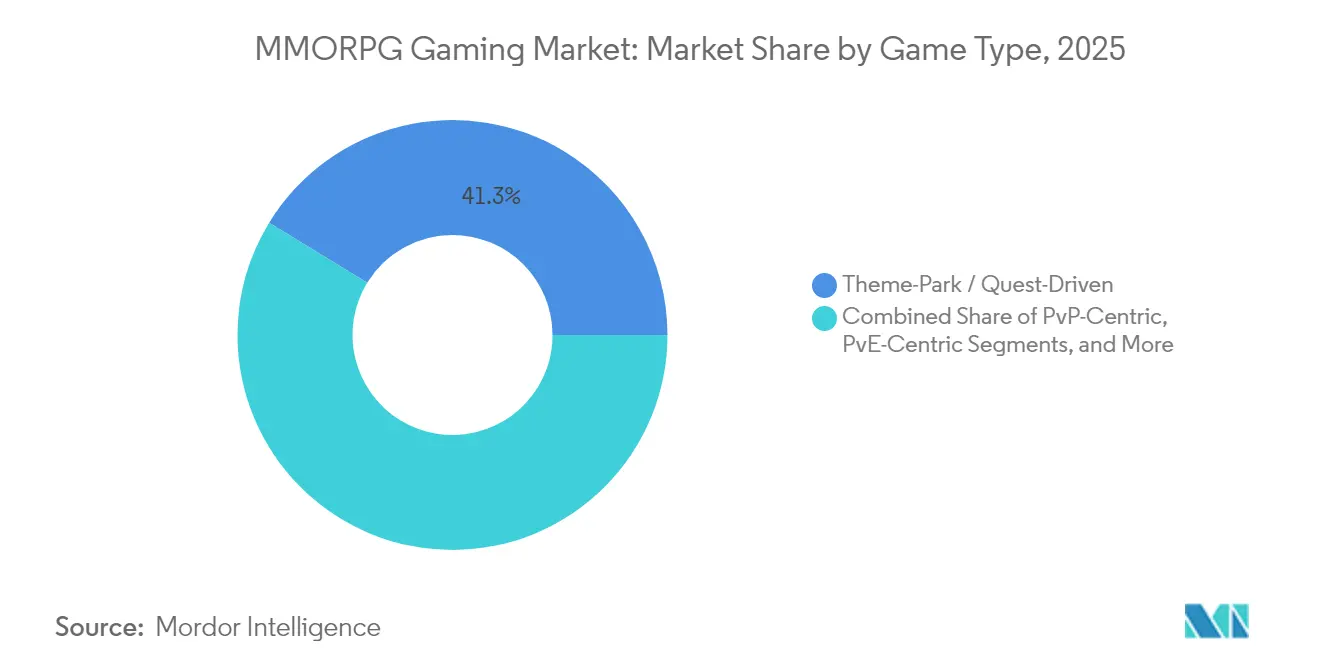
- By game type, theme-park experiences held 41.25% in 2025 in the MMORPG gaming market, while PvP-centric titles are advancing at an 10.72% CAGR to 2031.
- By age group, players aged 18–34 represented 48.05% share in 2025 in the MMORPG gaming market; the below-18 segment is expanding fastest at an 11.05% CAGR through 2031.
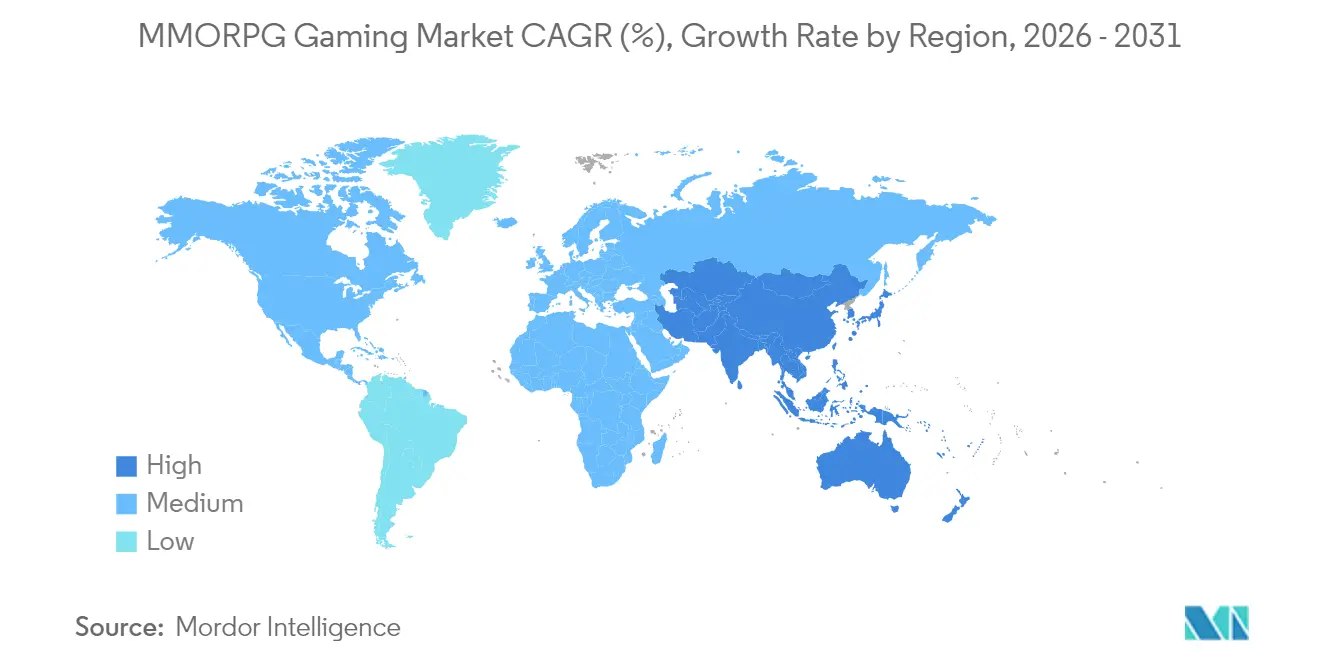
- By geography, North America held 39.10% market share in 2025 in the MMORPG gaming market, but Asia Pacific is expected to post the highest regional CAGR of 10.71% to 2031.
Note: Market size and forecast figures in this report are generated using Mordor Intelligence’s proprietary estimation framework, updated with the latest available data and insights as of 2026.
Global MMORPG Gaming Market Trends and Insights
Drivers Impact Analysis*
| Driver | (~) % Impact on CAGR Forecast | Geographic Relevance | Impact Timeline |
|---|---|---|---|
| Rapid smartphone and internet penetration | +2.1% | Asia Pacific, Latin America, MEA | Medium term (2-4 years) |
| Technological advancements in cloud gaming and 5G | +1.8% | Global (early gains in South Korea, China, US) | Medium term (2-4 years) |
| In-game monetization and micro-transaction success | +2.3% | Global | Short term (≤ 2 years) |
| Cross-platform play and social connectivity | +1.4% | Global | Short term (≤ 2 years) |
| Blockchain-based player-owned virtual economies | +0.9% | North America, Europe, select APAC markets | Long term (≥ 4 years) |
| Government-led esports development programs | +1.2% | Saudi Arabia, India, South Korea, China | Medium term (2-4 years) |
| Source: Mordor Intelligence | |||
Rapid smartphone and internet penetration in emerging markets
Extensive 5G roll-outs and lower-cost Android devices now put persistent online worlds in the hands of first-time gamers across India, Brazil, and Indonesia. Publishers prioritize lightweight clients, edge-served assets, and scalable back-end microservices to accommodate variable bandwidth. Local telecom subsidies further reduce data costs, driving daily log-ins among mobile-first teens. The MMORPG gaming market leverages this demographic shift with simplified onboarding flows and regional payment rails such as PIX in Brazil and UPI in India. As handset replacement cycles shorten, GPU-equipped mid-tier phones begin supporting console-grade visuals, encouraging cross-play between handheld and PC cohorts while expanding total addressable players.[1]Xsolla, “Level Up Your Checkout With Crypto.com Pay,” xsolla.com
Technological advancements in cloud gaming and 5G
Server-side rendering paired with 5G latency below 30 ms enables large-scale real-time combat once restricted to desktop rigs. NVIDIA’s cloud infrastructure, adopted by WEMADE for its MIR series, streams ray-traced scenes and AI-driven boss logic to mobile screens without perceptible lag. Edge nodes distribute shard traffic, so thousands of concurrent users occupy a single seamless map. Publishers now release experimental vertical slices to gauge demand before committing capex, reducing sunk risk. Cloud’s elastic scaling also tempers peak-hour server costs, improving gross margins even as daily active users rise.
In-game monetization and micro-transaction success
Cosmetic skins, housing décor, and seasonal passes create recurring touchpoints that keep average revenue per paying user high without splitting the player base behind hard paywalls. Xsolla reports crypto-enabled checkouts cut payment abandonment in half and drive 30% higher first-purchase conversion versus card-only flows. AI-driven segmentation tailors bundles to individual spend propensity, nudging lapsed users with limited-time “welcome back” offers. Regionalizing price tiers for currencies such as INR and BRL safeguards purchasing power parity and sustains goodwill in inflation-prone markets.
Government-led esports development programs
Saudi Arabia’s USD 70 million Esports World Cup and India’s public-funded National Esports Championship legitimize MMORPG arena formats on broadcast stages.[2]International Olympic Committee, “Olympic Esports Games 2025 Saudi Arabia,” olympics.com Public-private investments in training facilities and prize pools boost viewership and merchandise sales. Publishers that integrate observer modes and ranked ladders early secure tournament slots, translating pro-scene hype into grassroots adoption. With federal ministries treating competitive gaming as a strategic industry, visa and sponsorship hurdles for international athletes are easing.
Restraints Impact Analysis*
| Restraint | (~) % Impact on CAGR Forecast | Geographic Relevance | Impact Timeline |
|---|---|---|---|
| High development and maintenance costs | -1.7% | Global | Medium term (2-4 years) |
| Online fraud, account hacking and botting | -0.8% | China, Eastern Europe, Global hotspots | Short term (≤ 2 years) |
| Regulatory scrutiny on loot boxes | -1.1% | Europe, Australia, select US states | Short term (≤ 2 years) |
| Energy-consumption backlash for always-on servers | -0.6% | Europe, North America | Long term (≥ 4 years) |
| Source: Mordor Intelligence | |||
High development and maintenance costs
Triple-A MMORPGs now demand photo-real assets, cinematic orchestration, and multi-device UX, pushing budgets well above USD 120 million. Continuous content drops, customer support, and live-ops tooling inflate opex. Smaller studios offset fixed costs with cloud credits or white-label backend platforms, trading margin for scalability. Publishers in low-cost labor hubs, notably Vietnam and the Philippines, undercut Western rivals, but localization and brand building remain expensive. Strategic partnerships with engine vendors such as Epic and Unity provide technical uplift yet introduce revenue-share clauses that narrow profit windows.
Regulatory scrutiny on loot boxes and monetization
Belgium’s outright ban and the Netherlands’ gambling classification forced several publishers to disable loot boxes or exit those markets altogether. The Federal Trade Commission now evaluates whether probability disclosure alone protects minors.[3]Federal Trade Commission, “Business Guidance Concerning Loot Boxes,” ftc.gov To pre-empt class actions, developers embed parental dashboards that cap daily spending and require explicit opt-in for randomized rewards. Europe’s GDPR also complicates monetization by constraining behavioral profiling, prompting studios to shift toward deterministic season pass content with transparent value propositions.
*Our forecasts treat driver/restraint impacts as directional, not additive. The impact forecasts reflect baseline growth, mix effects, and variable interactions.
Segment Analysis
By Gaming Platform: Mobile builds the backbone of cross-play adoption
Mobile platforms accounted for 43.28% of the MMORPG gaming market share in 2025 and are set to expand at an 11.12% CAGR to 2031, reinforcing their position as the growth engine of the overall MMORPG gaming market. The high-end silicon now standard in mid-tier smartphones renders 60 fps play at 1080p, narrowing the experiential gap with consoles. Publishers deploy adaptive bitrate streaming to sustain performance on variable networks, while haptic feedback APIs bring tactile combat cues once limited to controllers. Cloud renders heavy post-processing, slashing thermal load and widening battery runtime.
PC and console ecosystems continue serving graphics purists and peripheral-heavy raid communities; however, cross-progression keeps these cohorts connected to their mobile guildmates. Gamepad overlays and detachable controllers bridge input divides, letting phone users tank or heal in parity with desktop teammates. As regulators tighten app-store billing rules, web-based launchers and progressive web apps emerge, ensuring uninterrupted monetization pipelines for the MMORPG gaming market.


By Revenue Model: Hybrid systems harmonize access and monetization
Free-to-play titles captured 57.10% of MMORPG gaming market size in 2025, validating accessibility as the dominant acquisition lever. Yet hybrid constructs, permanent free base game plus optional season pass, are climbing at 11.2% CAGR, illustrating player readiness to pay for tiered value as long as competitive balance remains intact. Publishers stagger cosmetic tiers, battle pass missions, and premium story arcs so non-spenders still feel progression momentum, protecting community health.
Subscription models endure in lore-rich franchises where committed fans equate monthly fees with stable server quality and rich support. Buy-to-play persists mainly in Europe, where consumer law limits micro-transaction randomness, but such games often layer DLC passes post-launch. Payment analytics flag churn risk when cumulative cosmetic costs surpass perceived ownership value, informing discount cadence and bundle design across the MMORPG gaming industry.
By Game Type: Structured narratives hold ground as competitive sandboxes surge
Theme-park designs retained 41.25% revenue share in 2025, underpinning the familiarity curve for late-adopters and casual questers. Their curated pathways shorten learning curves and ensure story cohesion. However, PvP-centric sandboxes are the fastest-growing slice at 10.72% CAGR, boosted by streamer exposure and esports brackets that transform skilled players into aspirational idols.
Emergent systems let guilds shape physics-based fortresses and dictate trade lanes, amplifying social stakes. AI-generated side quests respond to faction politics in real time, ensuring fresh objectives for both warmongers and farmers. PvE-exclusive dungeons still lure progression-focused veterans seeking cooperative ambience without ranking anxiety. Sophisticated match-making blends skill insight with latency data, balancing fairness against queue speed to retain diverse cohorts inside the MMORPG gaming market.
By Age Group: Emerging youths reshape engagement blueprints
Players aged 18–34 comprised 48.05% share in 2025, anchoring revenue with proven wallet depth. Yet the under-18 bracket, poised to grow at 11.05% CAGR, now molds design priorities. Teen-friendly chat filters, parental dashboards, and bite-sized daily objectives match shorter attention spans and school schedules. Skins inspired by social media influencers outsell high-fantasy armor, revealing pop-culture synergies.
Older cohorts aged 35–49 exhibit the highest average revenue per paying user but resist randomized monetization, favoring subscription bundles that deliver defined value. Accessibility features, font scaling, color-blind palettes, and simplified rotations, court the 50+ audience without diluting challenge for hardcore raiders. Generational interplay inside the MMORPG gaming market deepens social fabric, as family guilds become a mainstream phenomenon.
Geography Analysis
North America generated 39.10% of global revenue in 2025, buoyed by high disposable income and a robust PC-console installed base. Publishers monetize here through deluxe collectors’ tiers and cosmetic ancillaries priced above global averages. Regulatory oversight centers on youth data privacy and loot-box transparency, pushing studios toward plain-text probability disclosures and ESRB-aligned rating labels. Cloud availability from coast-to-coast reduces latency friction, sustaining the region’s premium ARPU leadership.
Asia Pacific is forecast to register a 10.71% CAGR, the steepest among major regions, propelled by smartphone ubiquity and state-sponsored esports arenas. China’s approval-queue volatility drives publishers to stagger launches under local partners. South Korea leverages 1 Gbps fiber penetration to pioneer 1000-player raids, while Japan’s console loyalists still prefer hybrid monetization over gacha extremes.
Europe maintains moderate uptake despite strict loot-box edicts that reduce monetization elasticity. Multi-language localization lifts time-to-market costs, but EU cross-border payment APIs simplify revenue repatriation. Currency instability and lower ARPU restrain Latin America and MEA today, yet rising 5G coverage and fintech wallets unlock new conversion funnels. Publishers progressively price in local fiat and reward watch-to-earn promos to sidestep macro volatility.

Regulatory Landscape
Regulatory Landscape: Monetization and minor-protection regimes are tightening across major MMORPG markets. The UK ASA issued a February 26, 2026 enforcement notice requiring loot box disclosures in app store listings, with monitoring starting May 26, 2026. In Europe, PEGI updates effective June 2026 assign a 16+ rating to games with paid random items, and a separate June 2026 update prompts storefront disclosures and age-appropriate configurations. In India, MeitY notified the Promotion and Regulation of Online Gaming Rules 2026 on April 22, 2026, creating the Online Gaming Authority of India with effect from May 1, 2026. France published Decret n 2026-60 on February 4, 2026 to enable an experimental framework for monetizable digital objects in online games. Taken together, these developments push MMORPG operators toward clearer disclosures, tighter controls for minors, and higher governance for monetizable digital items across regions.
Competitive Landscape
The MMORPG gaming market shows moderate concentration, with Tencent, NetEase, and Activision Blizzard anchoring roughly half of global revenues. Vertical integration across IP creation, distribution, and payment processing shields these incumbents from margin compression. Consolidation continues: mid-tier studios are scooped up for proprietary engines or regional footholds.
Technological moats deepen as leaders deploy generative AI to craft side quests and NPC dialogue on demand. WEMADE’s Asterion boss leverages NVIDIA ACE to adapt tactics dynamically, setting a bar for reactive PvE encounters. Blockchain integrations birth tokenized guild treasuries, transferring economy stewardship to players and diluting publisher gatekeeping. Cross-platform parity remains the decisive feature: titles that synchronize progression across mobile, PC, and console sustain wider daily active user funnels and higher lifetime value.
Independent challengers exploit cloud toolchains and storefront-agnostic web clients to reach audiences without platform tax burdens. Strategic alliances with hyperscalers like Google Cloud grant elastic compute, while retail giant tie-ups such as Walmart-Unity’s in-game commerce APIs enable physical goods sales that diversify revenue. As AI lowers content-creation costs, niche MMOs can iterate faster, though user-acquisition spending still sidelines many without venture backing.
MMORPG Gaming Industry Leaders
Activision Blizzard, Inc.
Electronic Arts Inc.
Ubisoft Entertainment SA
Nexon Co., Ltd.
Tencent Holdings Ltd.
- *Disclaimer: Major Players sorted in no particular order

Market Opportunities and Future Outlook
Market Opportunities and Future Outlook: The regulatory push toward transparent monetization and age-appropriate configurations creates room for compliant storefronts and checkout flows. PEGI and ASA actions increase the importance of disclosures and entitlements, especially for mobile MMORPGs where app store compliance can constrain release timelines. Region-specific payments such as UPI in India and PIX in Brazil provide an opportunity to localize checkout flows to local rails while supporting consumer-protection expectations. On the supply side, AI-assisted production and cloud-native live ops help studios scale operations. NCSOFT's March 2026 acquisition of a 70 percent stake in German mobile platform JustPlay for KRW 301.6 billion, and its December 2025 investment to take a 67 percent stake in Indygo Group, including Vietnam-based Lihuhu, point to a strategy focused on mobile-scale live ops and a broader MMORPG portfolio. Tencent's January 2026 cloud and AI partnerships for MMORPG development also highlight an approach for scalable managed backends and analytics, while Kubernetes-based auto-scaling approaches discussed in industry venues around Ragnarok Online 3 underscore available tooling for high concurrency.
Recent Industry Developments
- July 2026: Nexon announced it will take over PC publishing for Blizzard Entertainment's Overwatch in South Korea, effective August 12, 2026. The deal strengthens Nexon's position in Korean PC distribution and live operations, and shows a model where a local operator manages account services and commercialization for a global franchise.
- June 2025: WEMADE unveiled MIR5's Asterion, an AI-driven boss built on NVIDIA ACE designed to evolve tactics in response to player behavior. The announcement points to deeper use of real-time AI inference to differentiate PvE encounters and extend content longevity without proportionally increasing manual content production.
- April 2024: Tencent highlighted cloud and AI partnerships for MMORPG development at a major industry event. The message emphasized cloud-native backends, analytics, anti-fraud, and cross-platform account systems to support scalable live ops.


Research Methodology Framework and Report Scope
Market Definition and Coverage
For this study, the market covers revenues generated from massively multiplayer online role-playing games where players interact in persistent online worlds, across PC, console, and mobile. Revenue includes player spending and publisher earnings that are directly tied to MMORPG gameplay access and in-game experiences.
Scope exclusions: We exclude offline role-playing games, single-player RPG-only titles, and non-RPG MMO genres where role-play progression is not a core loop.
Segmentation Overview
- By Gaming Platform
- Mobile
- Tablet
- Gaming Console
- PC
- By Revenue Model
- Free-to-Play (F2P)
- Subscription-Based
- Buy-to-Play (B2P)
- Hybrid and Season Pass
- By Game Type
- Sandbox / Open World
- Theme-Park / Quest-Driven
- PvP-Centric
- PvE-Centric
- By Age Group
- Below 18 Years
- 18-34 Years
- 35-49 Years
- 50+ Years
- By Geography
- North America
- United States
- Canada
- South America
- Brazil
- Mexico
- Argentina
- Rest of South America
- Europe
- United Kingdom
- Germany
- France
- Italy
- Russia
- Rest of Europe
- Asia Pacific
- China
- India
- Japan
- South Korea
- Australia and New Zealand
- Rest of Asia Pacific
- Middle East and Africa
- Middle East
- Saudi Arabia
- United Arab Emirates
- Turkey
- Rest of Middle East
- Africa
- South Africa
- Nigeria
- Egypt
- Rest of Africa
- Middle East
- North America
Data Sources, Market Sizing, and Validation
Desk Research
Desk work was used to frame the revenue pool and the demand signals that explain MMORPG spend patterns by region and platform. Public sources were reviewed to understand broadband and 5G readiness, device install base, and digital spending behavior, which act as guardrails for this market.
Sources used include public datasets and releases such as ITU connectivity indicators, World Bank macro series, OECD digital economy notes, national telecom regulators, and platform policy pages from major app storefronts. We also referred to company filings and investor decks, developer conference presentations, reputable press, and app ranking snapshots to understand monetization shifts such as subscriptions plus in-game purchases. Where needed, a paid subscription for company financials and news, and a patent database, were used to validate timelines on live-ops tooling and content delivery practices. These desk sources are not exhaustive, and additional public references were checked for data collection, validation, and clarification.
Primary Interviews and Surveys
Primary work focused on validating what portion of overall gaming spend is attributable to MMORPG play time and monetization, then pressure-testing regional assumptions. We spoke with publishers, studios, platform-side experts, payment and monetization specialists, and community or esports operators across APAC, EMEA, and the Americas to close gaps that desk research could not resolve cleanly.
Distribution of primary research fieldwork respondents
| Company type | Respondent position | Region |
|---|---|---|
| Top tier: 27% | CXOs: 13% | APAC: 45% |
| Mid tier: 51% | Functional/Unit leaders: 37% | EMEA: 29% |
| Smaller Players: 22% | Managers: 50% | Americas: 26% |
Market-Sizing & Forecasting
Sizing starts with a top-down build where total digital game revenue is reconstructed by platform and region, then filtered into an MMORPG share using genre mix signals and expert-validated participation assumptions. After that demand pool is set, selective bottom-up checks are applied, such as sampling leading title revenues where public cues exist, and validating implied ARPPU and payer mix ranges against interview inputs.
Key inputs in the model include monthly active player directionality, payer conversion expectations, average revenue per paying user trends, the split between subscriptions and in-game purchases, and platform fee and tax effects that shift net revenue recognition. We also track practical market indicators like cross-platform adoption, cadence of content updates that affects retention, and regulatory or policy changes that can impact loot mechanics and monetization. Where direct title-level disclosures are missing, gaps are handled by using regional benchmarks for payer rates and spend bands, then rebalanced so totals remain consistent with platform and macro constraints.
For forecasting, scenario analysis is used around monetization intensity and retention, with the central case aligned to expert consensus on live-ops maturity and mobile MMORPG traction. Year-by-year projections are then sanity-checked so growth does not exceed feasible player base expansion and spending capacity in each region.
Data Validation & Update Cycle
Outputs are checked through triangulation across independent signals, including platform policy changes, connectivity indicators, and observed shifts in monetization mix from interviews and public disclosures. If a region shows an unusual jump, the assumptions are reviewed, the driver is traced back to the input, and experts are re-contacted when the variance cannot be explained.
Before sign-off, the model goes through multi-step analyst reviews where formulas, currency handling, and year mapping are rechecked, and where implied ARPPU and payer shares are compared against practical ranges. Reports are refreshed annually, with interim updates when material events occur, and a final pre-delivery review pass is completed so clients receive the latest updated view.
Mordor Intelligence's Mmorpg Gaming Market Estimate Compared With Other Published Estimates
Published market numbers for MMORPGs can vary because each publisher draws the line differently on what counts as an MMORPG, which revenue streams are included, and how mobile and cross-platform titles are treated. Differences also show up when the same year is reported in gross versus net terms, or when currency conversion timing is not handled consistently.
The table shows a spread around the 2026 value, and in Mordor Intelligence's model the count is limited to MMORPG revenues across PC, console, and mobile tied directly to gameplay access and in-game monetization, rather than bundling in adjacent MMO genres or broader gaming services revenue.
Benchmark comparison
| Source | Market Size | Gaps in Research Methodology |
|---|---|---|
| Mordor Intelligence | USD 31.02 B (2026) | |
| Trade Journal A | USD 27.40 B (2026) | Often reported using conservative payer conversion and ARPPU ranges, and may net out more platform fees or exclude mobile-first MMORPGs with hybrid monetization. |
| Global Consultancy B | USD 34.90 B (2026) | May include broader MMO revenue (not strictly MMORPG progression loops) or add indirect revenues like ecosystem services, which lifts totals beyond game-specific spend. |
Taken together, the comparison suggests that most gaps are created by genre boundaries and by whether revenues are counted gross or net of platform and tax effects. By tying the model to repeatable drivers like payer mix, ARPPU, and platform splits, the estimate stays traceable to inputs that can be reviewed and updated as the market shifts.


Key Questions Answered in the Report
How big is the MMORPG gaming market in 2026?
The market generated USD 31.02 billion in 2026 and is projected to rise to USD 51.3 billion by 2031.
Which platform contributes most to MMORPG revenue?
Mobile titles accounted for 43.28% of global revenue in 2025, the largest among all platforms.
What monetization model is growing fastest?
Hybrid approaches that blend free access with optional season passes are expanding at an 11.2% CAGR through 2031.
Which region is set to grow the fastest?
Asia Pacific is forecast to post the highest regional CAGR at 10.71% to 2031, led by China, South Korea, and India.
How does blockchain influence MMORPG design?
Tokenized economies enable player-owned assets and reduce fraud, while smart contracts automate revenue sharing for user-generated content.
Page last updated on:


