
Mining Lubricants Market Size and Share
Market Overview
| Study Period | 2020 - 2031 |
|---|---|
| Market Volume (2026) | 1.79 Billion liters |
| Market Volume (2031) | 2.01 Billion liters |
| Growth Rate (2026 - 2031) | 2.30 % |
| Fastest Growing Market | Asia Pacific |
| Largest Market | Asia Pacific |
| Market Concentration | Medium |
Major Players *Disclaimer: Major Players sorted in no particular order Image © Mordor Intelligence. Reuse requires attribution under CC BY 4.0. | |
Mining Lubricants Market Analysis by Mordor Intelligence
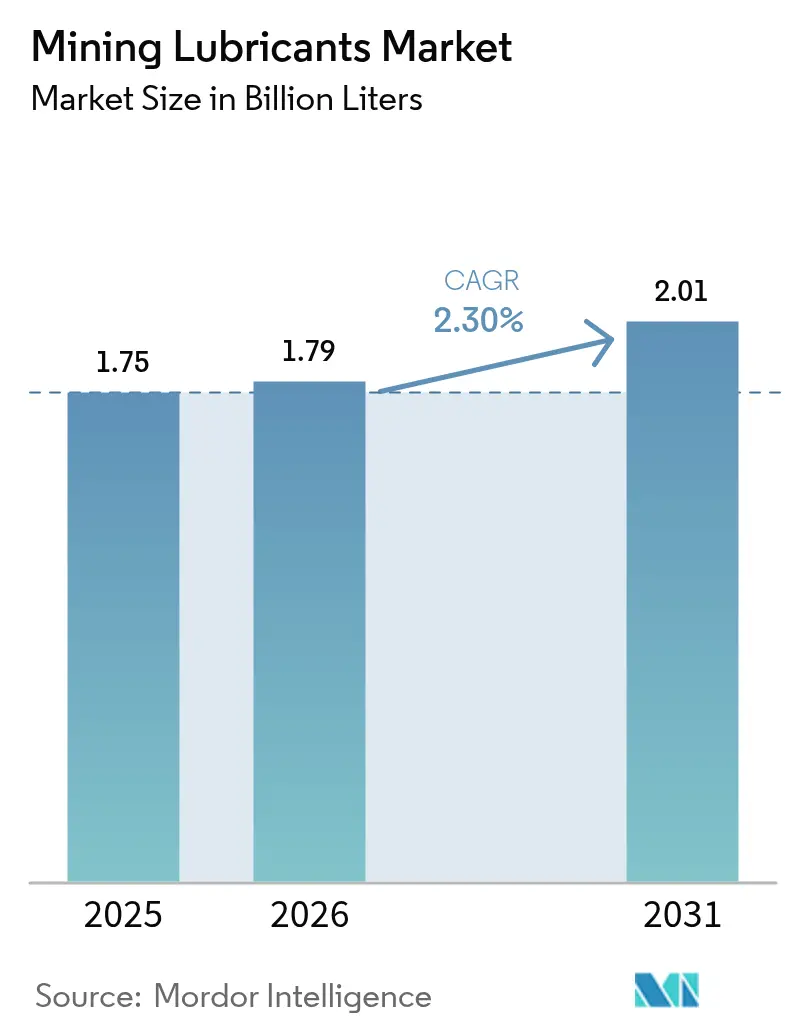
The Mining Lubricants Market size was valued at 1.75 billion liters in 2025 and estimated to grow from 1.79 billion liters in 2026 to reach 2.01 billion liters by 2031, at a CAGR of 2.30% during the forecast period (2026-2031). This steady trajectory reflects rising mining output balanced by wider use of efficient centralized lubrication systems, longer drain intervals, and premium synthetic formulations that moderate volumetric consumption. Demand is anchored in autonomous haulage fleets that require always-on, sensor-guided lubrication, while environmental rules in fragile biomes accelerate the adoption of biodegradable oils. Coal-rich mine expansions in Asia-Pacific and North America underpin baseline volumes, but real-time condition monitoring that cuts unnecessary changeouts tempers growth. Competitive strategies therefore tilt toward value-added services, predictive maintenance support, and higher-performance fluids over pure volume sales.
Key Report Takeaways
- By base stock, mineral oil commanded 66.58% of the mining lubricants market size in 2025, whereas synthetic oils record the quickest 3.03% CAGR to 2031.
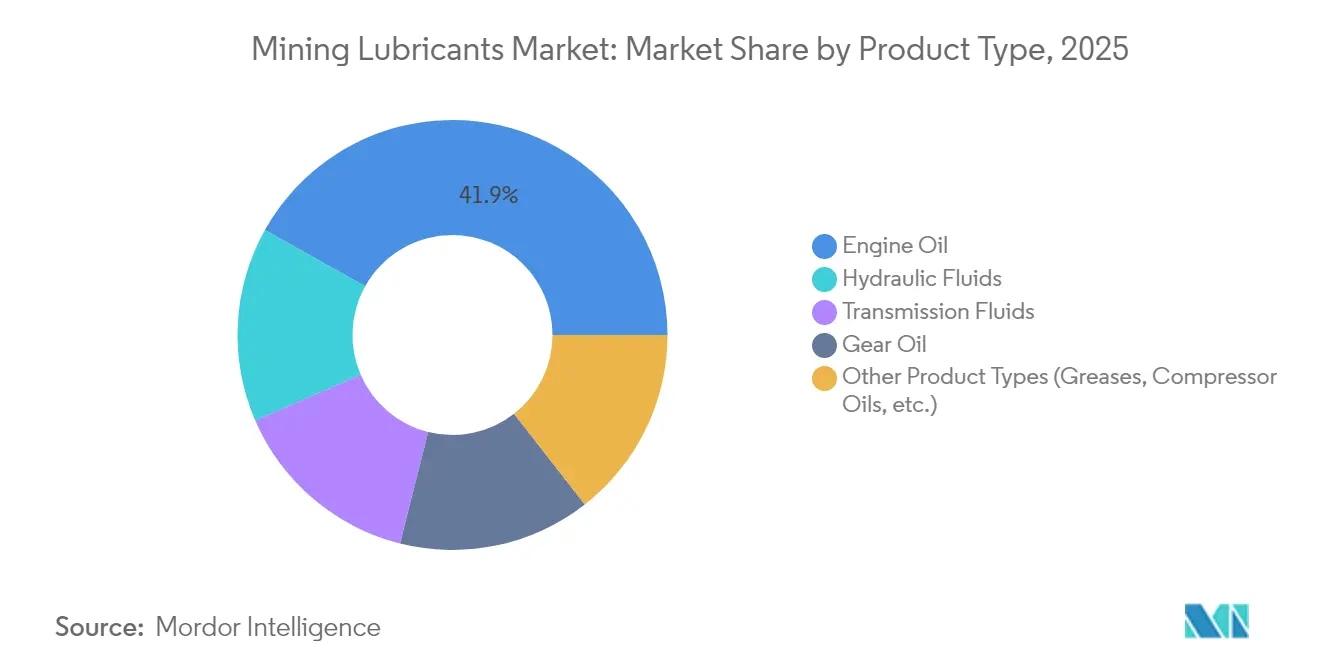
- By product type, engine oil led with 41.88% revenue share in 2025, while hydraulic and transmission fluids together advance at a 2.91% CAGR over the same period.
- By geography, Asia-Pacific held 39.28% of the mining lubricants market share in 2025; the region is projected to post the fastest 3.68% CAGR through 2031.
Note: Market size and forecast figures in this report are generated using Mordor Intelligence’s proprietary estimation framework, updated with the latest available data and insights as of 2026.
Market Trends and Insights
Drivers Impact Analysis of Mining Lubricants Market*
| Driver | (~) % Impact on CAGR Forecast | Geographic Relevance | Impact Timeline |
|---|---|---|---|
| Expansion of coal-rich mining activities | +0.8% | Asia-Pacific, North America | Medium term (2-4 years) |
| Rapid capacity additions in hard-rock mines | +0.6% | Global, concentrated in Australia, Chile | Medium term (2-4 years) |
| Modern, high-horsepower equipment boosting lube intensity | +0.5% | Global, led by North America, Australia | Long term (≥ 4 years) |
| Autonomous haulage requiring smart centralized lubrication | +0.4% | North America, Australia | Long term (≥ 4 years) |
| Environmental push for biodegradable lubricants in fragile biomes | +0.3% | Global, emphasis on Arctic, rainforest regions | Medium term (2-4 years) |
| Source: Mordor Intelligence | |||
Expansion of Coal-Rich Mining Activities
Coal mine expansions extend fleet operating hours and raise lubricant loads as producers in Australia, China, India, and the United States keep thermal-coal output stable despite decarbonization pressure. Australia doubled mining-sector investment to lift iron ore and coal capacity, reinforcing volume demand for heavy-duty engine oils and greases used in draglines and haul trucks[1]. Canadian oil-sands production climbed to 1.9 million b/d in late-2024, and debottlenecking projects raised upgrader capacity to 600,000 b/d, spurring lubricant needs for extreme-temperature and high-contamination conditions. Bigger equipment in coal pits relies on high-performance lubricants with longer service intervals to cut unscheduled stoppages. Yet global coal demand uncertainties tied to power-sector decarbonization may cap the longevity of this driver.
Rapid Capacity Additions in Hard-Rock Mines
New copper, gold, and rare-earth pits deploy automated, high-pressure equipment operating deeper underground, intensifying lubricant complexity. Operators install sensor-laden hydraulic shovels and high-ratio gearboxes that necessitate synthetic oils with superior thermal stability. Liebherr’s zero-emission excavation roadmap, targeting fossil-free systems by 2030, illustrates the shift to electric and hybrid drive trains that still depend on tailored lubricants for transmissions and bearing sets. Predictive-maintenance platforms feed real-time friction and temperature data to optimize change intervals, reducing waste while safeguarding uptime. As hard-rock expansions proliferate in Chilean copper belts and Western Australian goldfields, specialized lubricants that manage high loads and temperature spikes command premium pricing.
Modern, High-Horsepower Equipment Boosting Lube Intensity
Ultra-class haul trucks now exceed 4,400 hp, exemplified by Cummins’ QSK95 engine, amplifying sump volumes and operating temperatures. MTU’s Series-4000 engines deliver 15% productivity gains and 12% fuel savings but demand oils with heightened oxidation resistance. Higher horsepower drives adoption of synthetic lubricants that retain viscosity and film strength under thermal shock. Equipment builders increasingly specify semi-synthetic or full-synthetic formulations, accelerating premiumization of the mining lubricants market. The need to maintain emission-compliant combustion also raises detergent and dispersant requirements in engine oils, reinforcing the technology gulf between conventional mineral fluids and advanced synthetics.
Autonomous Haulage Requiring Smart Centralized Lubrication
Driverless trucks and drills rely on automated, centralized lubrication units fitted with IoT sensors that meter precise dosages during operation. These systems remove workers from hazardous zones, enhance consistency, and allow lubrication while equipment runs, reducing downtime. Data analytics platforms analyze vibration, load, and oil-condition metrics to predict lube replenishment, extending component life and aligning service with production schedules. As mines roll out autonomous fleets in Australia’s Pilbara and Nevada’s gold belts, demand shifts toward longer-life greases and oils capable of functioning for months without manual checks.
Restraints Impact Analysis of Mining Lubricants Market*
| Restraint | (~) % Impact on CAGR Forecast | Geographic Relevance | Impact Timeline |
|---|---|---|---|
| Crude-price volatility inflating base-oil costs | -0.4% | Global | Short term (≤ 2 years) |
| Group-II base-oil supply tightness from refinery rationalization | -0.3% | Global, acute in Europe, Asia | Medium term (2-4 years) |
| Longer drain-intervals from real-time condition monitoring | -0.5% | North America, Europe, Australia | Long term (≥ 4 years) |
| Source: Mordor Intelligence | |||
Crude-Price Volatility Inflating Base-Oil Costs
Lubricant producers face margin pressure when crude prices spike since Group-II base stocks track petroleum benchmarks. Shell’s conversion of a German hydrocracker to 300,000 t/y of Group-III base oils improves regional supply resilience and trims carbon emissions by 620,000 t/y, but cost pass-throughs to mine operators remain inevitable[2]. Miners offset volatility by adopting condition-based maintenance that cuts oil use, pressuring suppliers to balance pricing with value-added technical support. Premium synthetics partially hedge margin swings through higher per-liter value.
Longer Drain Intervals from Real-Time Condition Monitoring
Inline viscometers such as Cambridge Applied Systems’ SPL571 constantly measure oil degradation, allowing operators to extend drains safely and cut lubricant purchases. Predictive platforms that integrate vibration and ferrography analytics help mines avert failures and optimize oil life, with savings sometimes exceeding USD 1 million per shovel annually. While these gains elevate demand for high-performance formulations able to survive longer cycles, they also structurally curb volumetric sales, compelling suppliers to focus on service contracts and performance guarantees.
*Our forecasts treat driver/restraint impacts as directional, not additive. The impact forecasts reflect baseline growth, mix effects, and variable interactions.
Mining Lubricants Market Segment Analysis
By Base Stock:
Synthetic Oils Erode Mineral DominanceMineral oils retained 66.58% mining lubricants market share in 2025 owing to cost advantages and established supply. Synthetic variants, however, accelerate at a 3.03% CAGR to 2031 as high-horsepower machinery, deeper pits, and ambient extremes outstrip mineral capabilities. The synthetic slice of the mining lubricants market size benefits from stable viscosity, oxidation resistance, and extended drains that reduce service downtime. Chevron’s heavy-duty synthetic and semi-synthetic rollout underscores OEM endorsement for longer-life fluids that deliver fuel efficiency gains. Bio-based lubricants remain a niche but grow where environmental permits require stringent biodegradability, particularly in Arctic, Amazon, and island mines.
The premium nature of synthetics narrows the cost differential versus mineral alternatives as drain intervals stretch, improving lifecycle economics. Coupled with autonomous haulage, synthetics’ superior film retention lowers bearing failures, justifying higher upfront price and tilting procurement toward performance-based contracts that reward uptime.


By Product Type:
Engine Oils Lead, Specialized Fluids AccelerateEngine oils captured 41.88% of the mining lubricants market size in 2025 because almost all haul trucks, loaders, and shovels run high-output diesel engines. Rising horsepower and tighter NOx limits require formulations with elevated detergent, anti-wear, and soot-control properties. Cummins’ 4,400-hp QSK95 powerplant specifies low-SAPS synthetics, illustrating OEM demand for premium oils that safeguard turbocharger bearings and control liner polishing.
Hydraulic fluids and transmission oils record the briskest 2.91% CAGR to 2031 as equipment complexity escalates. Tele-remote drills and electric-drive trucks use high-precision hydraulic and gear systems that need fluids with shear-stable viscosity improvers, water-tolerance, and copper-corrosion inhibitors. Greases for centralized systems rise alongside autonomous haulage, with calcium-sulfonate complexes favored for water-wash resistance. Bio-hydraulic oils gain share in environmentally sensitive zones where spill penalties rise.
Geography Analysis
APAC Mining Lubricants Market
Asia-Pacific’s 39.28% mining lubricants market share in 2025 reflects massive mineral output in Australia, Indonesia, and India. Ongoing investment keeps iron-ore and coal exports flowing from the Pilbara and Kalimantan, sustaining demand despite China’s property slowdown. The Reserve Bank of Australia noted a doubling of mining capital expenditures that underpin lubricant volumes. Shell’s grease plant in Thailand tripled to 15,000 t/y, becoming Southeast Asia’s largest and anchoring regional supply. ExxonMobil’s 20,000 b/d base-oil expansion in Singapore supplies advanced EHC grades and bolsters feedstock security. While China’s import pull eases, India’s urban growth helps compensate, anchoring a 3.68% CAGR through 2031.
North America Mining Lubricants Market
North America remains technologically advanced, with autonomous fleets in Canadian oil sands and US copper pits pushing uptake of IoT-linked lubrication. Shell-Whitmore’s joint venture offers turnkey reliability solutions spanning greases, oils, and automated delivery hardware, enhancing operational uptime for mine operators. Record 1.9 million b/d oil-sands production in 2024 and upgrader capacity hikes translate into steady lubricant demand across extreme cold operations. Environmental scrutiny encourages biodegradable fluids in regions adjacent to waterways, fostering niche synthetic and bio-oil uptake.
Europe Mining Lubricants Market
Europe’s smaller mining footprint limits volume but leads in environmental compliance, driving early adoption of EU Ecolabel-certified lubricants. Shell’s German base-oil project will meet 40% of domestic demand and 9% of EU requirements, easing Group-III supply tightness and cutting emissions. Scandinavian and Iberian mines fit advanced condition monitoring that extends drain intervals, underscoring the shift from litres sold to uptime delivered. The region’s focus on circularity and carbon cuts positions high-performance synthetics and bio-oils for growth despite sluggish overall mining output.

Regulatory Landscape
Mining lubricant formulations and handling are increasingly shaped by chemicals regulation and environmental-performance labels, particularly where spill and runoff risks are high. In the European Union, REACH (EC No 1907/2006) drives substance registration and SVHC disclosure, while the EU Ecolabel lubricant criteria (with the European Commission user manual updated in July 2024) provides a procurement and permit-alignment pathway for biodegradable and low-toxicity products used near waterways and sensitive habitats.
Regulators and standards bodies are also tightening scrutiny of specific additive chemistries and particulate restrictions that can affect mining-grade hydraulics, greases, and total-loss applications. The OECDs June 2025 report on PFAS and alternatives in hydraulic oils and lubricants reflects an intensifying focus on PFAS-related risk management and substitution discussions, complemented by ECHA workstreams under REACH. At the supplier level, updated compliance documentation has become more visible in the market, for example CONDATs February 2026 REACH compliance statement supporting customer due diligence and tender requirements for regulated sites.
Value Chain Analysis
The mining lubricants value chain starts with base oil production (primarily Group I/II/III) and additive supply (detergents, dispersants, anti-wear, EP, VI improvers), followed by blending, quality testing, packaging, and distribution to mines through direct supply contracts, distributors, and on-site service models. Because finished lubricants typically contain about 75% to 98% base oil, base oil availability and pricing feed quickly into mining lubricant costs and sourcing decisions, especially for premium synthetics that rely on Group III and PAO feedstocks.
Two recurring bottlenecks show up in procurement patterns, concentrated base-oil supply corridors and uneven regional additive distribution coverage. ILMA flagged a base-oil supply crisis in May 2026, and industry reporting linked the February 28, 2026 Strait of Hormuz disruption to reduced availability of Persian Gulf-origin Group III base oils in importing markets. Additive and specialty supply is also being reinforced through new distribution tie-ups, such as ProFluids May 2025 exclusive North American distribution partnership with Yasho Industries for grease and lubricant additives, and Kangtais June 2025 distribution agreement with Redox across Australia and New Zealand, which improves local access to engine, gear, transmission, and industrial additive packages used in mining-grade formulations.
Competitive Landscape
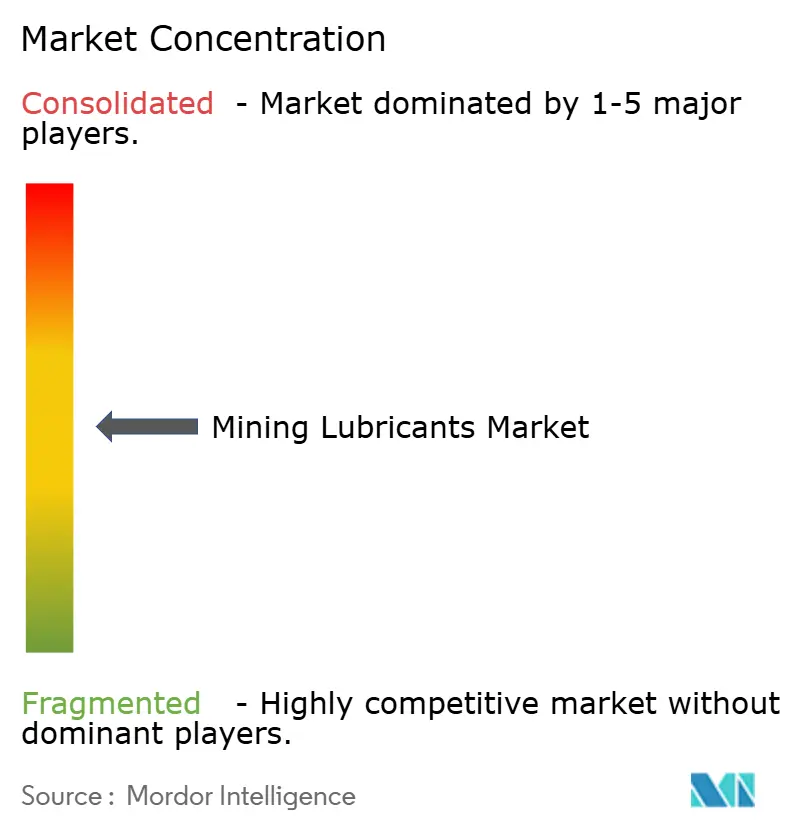
The mining lubricants market features moderate fragmentation. Shell, BP (Castrol), ExxonMobil, TotalEnergies, and Chevron leverage vertical integration from base-oil refining to finished-lube blending and on-site technical services. Shell’s Whitmore venture widens rail and haulage coverage with combined grease know-how and distribution reach. BP’s review of its Castrol unit signals portfolio reshaping toward e-mobility fluids and high-margin industrial lubes. TotalEnergies expands its Quartz heavy-duty range with biodegradable variants targeting EU mines.
Technology is the chief battleground: IoT-enabled condition-monitoring platforms, cloud-based oil analytics, and biodegradable formulations create differentiation. Suppliers bundle lubricant supply with vibration analysis, training, and inventory management, shifting contracts from commodity purchases to performance guarantees. Base-oil security shapes cost leadership; ExxonMobil’s Singapore expansion and Shell’s German project both insulate operations from Group-II/III tightness, stabilizing margins and supporting premium product rollout. New entrants focusing on bio-based oils carve out specialized niches but face scale barriers in global distribution.
Mining Lubricants Industry Leaders
-
ExxonMobil Corporation
-
BP p.l.c.
-
Chevron Corporation
-
Shell plc
-
TotalEnergies
- *Disclaimer: Major Players sorted in no particular order
Mining Lubricants Market Companies Covered in this Report
- BP p.l.c.
- Chevron Corporation
- China Petrochemical Corporation (Sinopec)
- Engen Petroleum (PTY) LTD
- Exxon Mobil Corporation
- Freudenberg
- FUCHS
- Gulf Oil International
- Idemitsu Kosan Co.,Ltd.
- LUKOIL
- Petro-Canada Lubricants Inc.
- PetroChina Company Limited
- Quaker Houghton
- Shell plc
- Suncor Energy Inc.
- TotalEnergies
- Valvoline
Market Opportunities and Future Outlook
Opportunities are centered on performance-backed, compliance-ready lubricants and service models that reduce downtime while meeting tighter environmental and chemical documentation requirements. As mines expand autonomous and centralized lubrication systems, including in Australias Pilbara, suppliers that bundle lubricants with oil analysis, sensor-enabled replenishment, and reliability programs can differentiate beyond price per liter. The shift from time-based changes to condition-based lubrication, supported by in-line monitoring and management frameworks such as ICML 55.1, also creates room for premium engine oils, shear-stable hydraulic fluids, and water-resistant greases specified around measurable cleanliness and wear targets, such as ISO 4406 cleanliness codes used for hydraulics and high-speed gear systems.
A second opportunity is the accelerated move toward biodegradable and environmentally acceptable lubricants for operations near sensitive water and soil environments, where spill-risk management and permit conditions shape product selection. The EU Ecolabel lubricant criteria and heightened attention to PFAS chemistry, highlighted by the OECD in 2025 and supported by ECHA-related REACH processes, are pushing mines and suppliers toward documented substitution pathways and clearer SVHC declarations. Real market activity supporting this shift includes the industry focus on EAL-compliant greases and bio-derived thickener systems, alongside suppliers publishing updated compliance statements such as CONDATs February 2026 REACH communication, which helps procurement teams validate chemistry and regulatory fit across multi-site mining operations.
Recent Industry Developments in Mining Lubricants Market
- March 2026: CITGO Petroleum Corporation launched Mystik JT-6 Heavy Duty SynBlend 460 Moly Plus #2 grease for severe-duty applications, positioning the product for mining and construction equipment where shock loading and wear protection are critical. The launch expands supplier offerings in high-load greases used on pins, bushings, and centralized lubrication points, supporting uptime-focused maintenance programs.
- July 2025: Shell Lubricants completed the acquisition of a 100% equity stake in Raj Petro Specialities Pvt. Ltd. from Brenntag Group. The deal broadened Shells product and manufacturing footprint in specialty lubricants and improves its ability to serve industrial end users, including mining customers seeking tailored formulations and local supply reliability.
- March 2024: ExxonMobil continued progressing its approximately INR 900 crore (USD 110 million) investment program to establish a lubricant manufacturing facility in the Isambe Industrial Area of Raigad under the Maharashtra Industrial Development Corporation. The project strengthens regional blending and supply capacity for finished lubricants, supporting shorter lead times and improved service coverage for industrial demand centers that include mining.
Mining Lubricants Market Report Scope and Research Methodology
Market Definition and Coverage
For this study, the mining lubricants market covers lubricants used to reduce wear, heat, and friction in mining equipment during extraction, hauling, crushing, and processing activities, across surface and underground operations.
Scope exclusions: This sizing excludes fuels, coolants, hydraulic system components, and general industrial lubricants used outside mining sites.
Segments Covered in This Report
- By Base Stock
- Mineral Oil
- Other Base Stocks (Synthetic Oils, Bio-based, etc.)
- By Product Type
- Engine Oil
- Gear Oil
- Hydraulic Fluids
- Transmission Fluids
- Other Product Types (Greases, Compressor Oils, etc.)
- By Geography
- Asia-Pacific
- China
- Japan
- India
- South Korea
- ASEAN Countries
- Rest of Asia-Pacific
- North America
- United States
- Canada
- Mexico
- Europe
- Germany
- United Kingdom
- France
- Italy
- Spain
- Russia
- NORDIC Countries
- Rest of Europe
- South America
- Brazil
- Argentina
- Rest of South America
- Middle East and Africa
- Saudi Arabia
- South Africa
- Rest of Middle East and Africa
- Asia-Pacific
Data Sources, Market Sizing, and Validation
Desk Research
Desk work started with building a demand map linked to mining activity, equipment usage, and lubricant consumption patterns by region. Public sources were used to anchor the basic numbers and definitions, including USGS mineral production statistics, Energy Information Administration diesel and industrial energy series, national mining ministries and geological surveys, and customs trade data portals for base oils and additives.
To tighten assumptions, we reviewed company annual reports and investor presentations for lubricant and industrial product exposure, along with mining association publications and updates from safety and environmental regulators that affect lubricant specifications and disposal rules. Patent databases were referenced selectively to track shifts toward synthetic and biodegradable formulations in harsh duty cycles. A paid subscription for company financials and news was used to cross-check operating footprint changes and major mine expansion signals. These sources are illustrative only, and many other references were used to collect, verify, and clarify data points.
Primary Interviews and Surveys
Primary discussions were held with lubricant suppliers, base oil and additive participants, distributors, and maintenance teams responsible for equipment uptime at mine sites. We used these inputs to confirm drain intervals, the typical product mix (engine, gear, hydraulic, and greases), and how consumption varies with fleet utilization, ore throughput, and climate. Since the work is global, feedback was balanced across APAC, EMEA, and the Americas so regional operating practices and compliance needs were captured.
Distribution of primary research fieldwork respondents
| Company type | Respondent position | Region |
|---|---|---|
| Top tier: 34% | CXOs: 14% | APAC: 41% |
| Mid tier: 52% | Functional/Unit leaders: 40% | EMEA: 34% |
| Smaller Players: 14% | Managers: 46% | Americas: 25% |
Market-Sizing & Forecasting
Sizing was built using a top-down approach where mining activity indicators were translated into a lubricant demand pool, then filtered through realistic usage rates. Key inputs included active mine counts and production trends by major minerals, installed base and utilization of heavy equipment fleets, lubricant change intervals and average sump capacities, shift intensity, and the pace of synthetic and biodegradable adoption in sensitive locations.
After regional totals were formed, we used selective bottom-up approximations to keep the model anchored, including sampled price per liter by product type, channel checks on typical annual consumption per large mine, and supplier side sanity checks on category shares. Where direct data was thin for smaller mining countries, we filled gaps using proxy relationships to mineral output and equipment intensity, followed by expert review to avoid over-smoothing.
For forecasts, scenario analysis was applied around mine investment cycles and utilization swings, then guided by expert consensus on variables such as metals price outlook, regulatory pressure on biodegradables, and maintenance strategies that extend drain intervals. This kept the outlook explainable in practical terms, without relying on any single hard-to-obtain dataset.
Data Validation & Update Cycle
Checks were run at multiple steps so the final values stayed consistent with real-world mining signals. Outputs were compared against independent indicators such as mining production growth, equipment shipment commentary, lubricant formulation trends, and trade movements for base oil and additives where relevant.
If a country or product type showed an unusual spike or drop, we revisited the drivers, rechecked assumptions, and recontacted a few respondents when the variance could not be explained by seasonality or known mine closures. Before sign-off, the model and the written insights went through a second analyst review to catch logic gaps and unit or currency inconsistencies. Reports are refreshed annually, with interim updates when material events occur, and a final pre-delivery pass is completed so clients receive the latest updated view.
Mordor Intelligence's Mining Lubricants Market Size Measured Against Other Published Estimates
Published market sizes for mining lubricants can vary widely because studies do not always measure the same scope, even when the title sounds identical. Differences usually come from the unit of measure, the mix of product categories included, and how price and demand are converted into a single yearly value.
Greases and other minor lubricant types are counted inside Mordor Intelligence's scope only when they are used directly in mining equipment maintenance, which is one reason the spread shows up when other publishers roll in adjacent industrial lubrication use. Other common gap drivers are the assumed rate of synthetic shift, how drain interval extensions are modeled, and whether currency timing and inflation are applied consistently across regions.
Benchmark comparison
| Source | Market Size | Gaps in Research Methodology |
|---|---|---|
| Mordor Intelligence | USD 1.79 B (2026) | |
| Global Consultancy A | USD 4.00 B (2024) | Uses a revenue model that appears to include broader heavy equipment lubrication spend and mixes value with volume reporting, which can inflate totals when mining and non-mining equipment use are not cleanly separated. |
| Industry Publisher B | USD 3.15 B (2025) | Base year and price assumptions are set around faster premiumization, and the market definition is presented at a higher level, which can pull in a wider product mix and more aggressive ASP progression. |
The comparison shows that the biggest differences come from scope alignment and how volume is translated into value across regions and lubricant types. By tying the model to mine activity, equipment utilization, and practical consumption rules, our estimate stays traceable to inputs that can be checked and updated in a repeatable way.
Key Questions Answered in the Report
What is the current Mining Lubricants Market size?
The market stood at 1.79 billion liters in 2026 and is projected to reach 2.01 billion liters by 2031.
Which region leads the mining lubricants market?
Asia-Pacific leads with 39.28% market share and is forecast to grow at a 3.68% CAGR through 2031.
Which base stock segment is growing fastest?
Synthetic oils expand at a 3.03% CAGR as high-horsepower and autonomous equipment demand longer-life, high-performance fluids.
Why are drain intervals lengthening in mining applications?
Real-time condition monitoring and predictive maintenance systems provide precise oil-health data, enabling safe extension of drain intervals and reducing lubricant waste.