
Mineral Processing Equipment Market Size and Share
Market Overview
| Study Period | 2020 - 2031 |
|---|---|
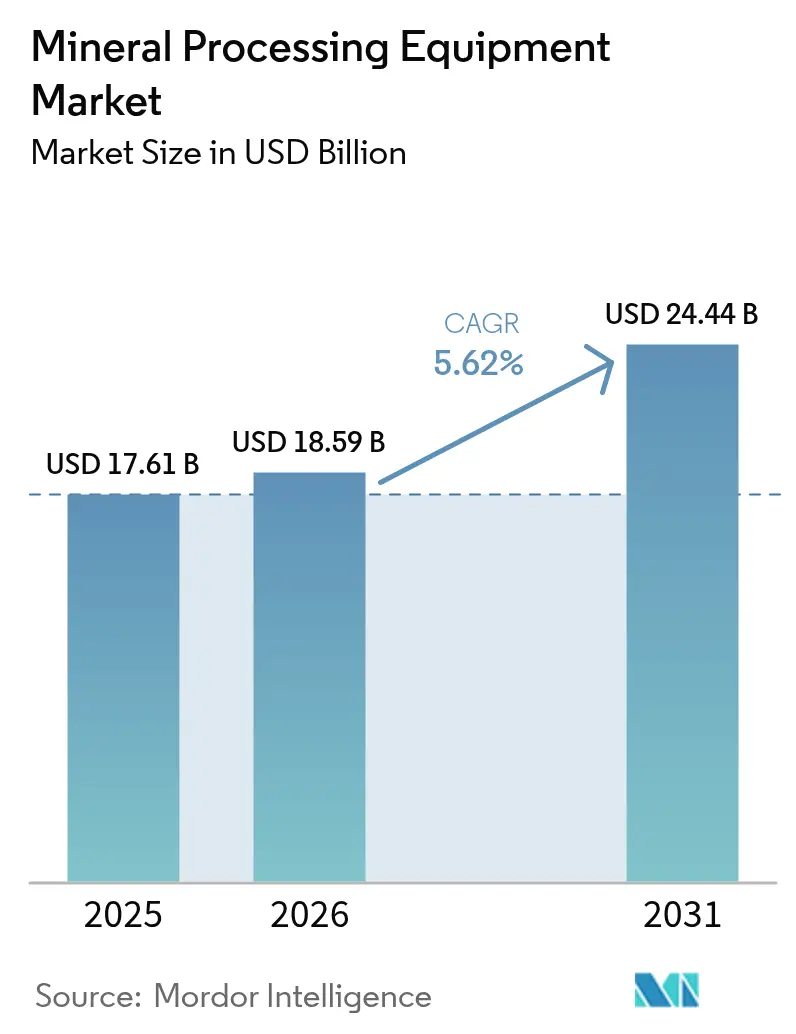
| Market Size (2026) | USD 18.59 Billion |
| Market Size (2031) | USD 24.44 Billion |
| Growth Rate (2026 - 2031) | 5.62 % |
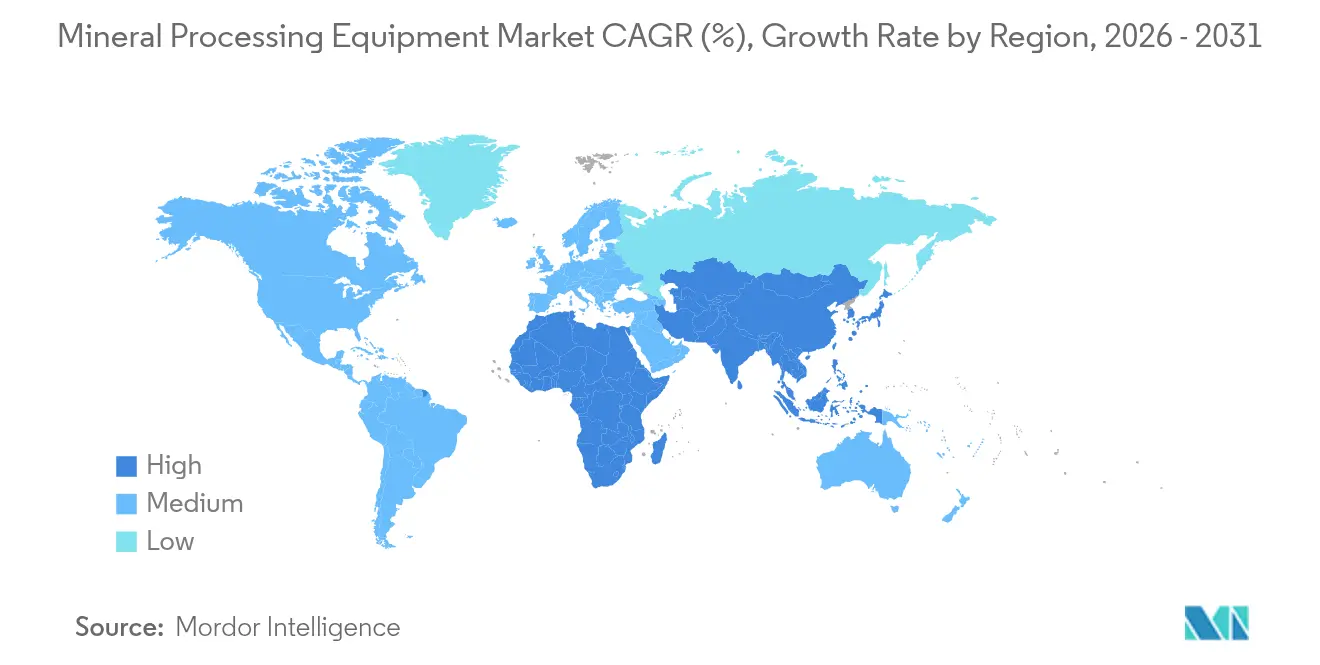
| Fastest Growing Market | Middle East and Africa |
| Largest Market | Asia-Pacific |
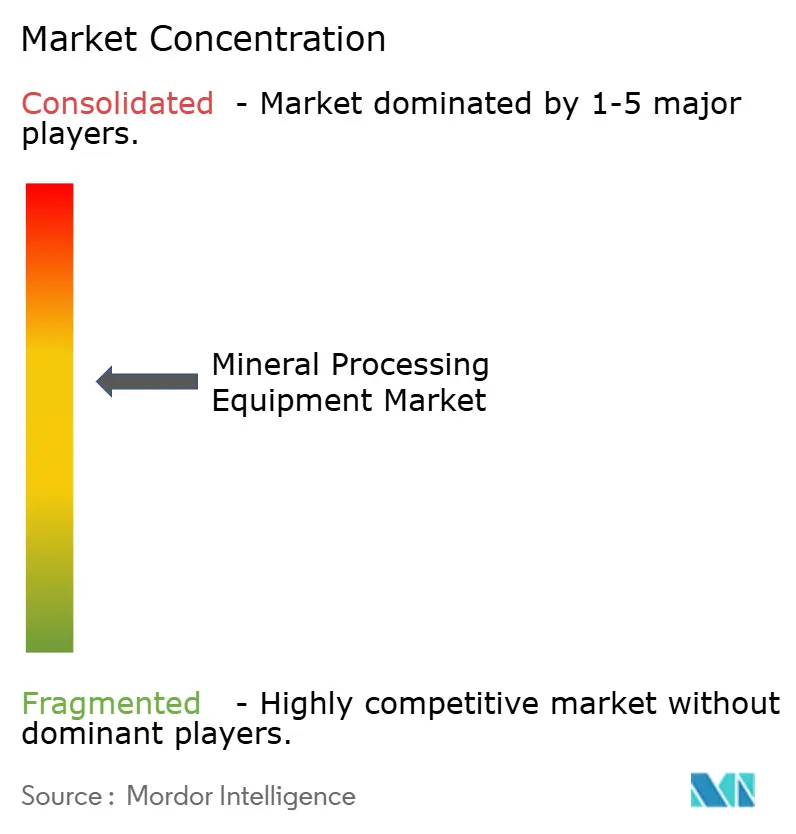
| Market Concentration | Medium |
Major Players *Disclaimer: Major Players sorted in no particular order Image © Mordor Intelligence. Reuse requires attribution under CC BY 4.0. | |
Mineral Processing Equipment Market Analysis by Mordor Intelligence
The Mineral Processing Equipment market size was valued at USD 17.61 billion in 2025 and estimated to grow from USD 18.59 billion in 2026 to reach USD 24.44 billion by 2031, at a CAGR of 5.62% during the forecast period (2026-2031). Continuous ore-grade decline, the energy-transition metals boom, and tightening environmental standards reinforce multi-year investment cycles favoring higher-capacity, digitally enabled plants. Growing demand for lithium, nickel, and rare earth elements pushes equipment orders toward finer-grinding, precision-separation, and advanced dust-control systems. Producers prioritize energy efficiency to reduce cost per tonne and Scope 1 emissions, elevating technologies such as high-pressure grinding rolls (HPGRs) and column flotation. Aftermarket services gain strategic importance as remote mine operators seek guaranteed uptime and predictive maintenance. Supply-chain nationalism adds urgency to domestic processing capacity in North America, Europe, and Asia, further broadening the mineral processing equipment market opportunity.
Key Report Takeaways
- By mineral mining sector, the “Others” category commanded 89.55% share of the mineral processing equipment market size in 2025, whereas lithium processing equipment is expected to expand at a robust 13.58% CAGR to 2031.
- By equipment, crushers and mills held 32.72% of the mineral processing equipment market share in 2025, while flotation cells are projected to record the fastest 5.88% CAGR through 2031.
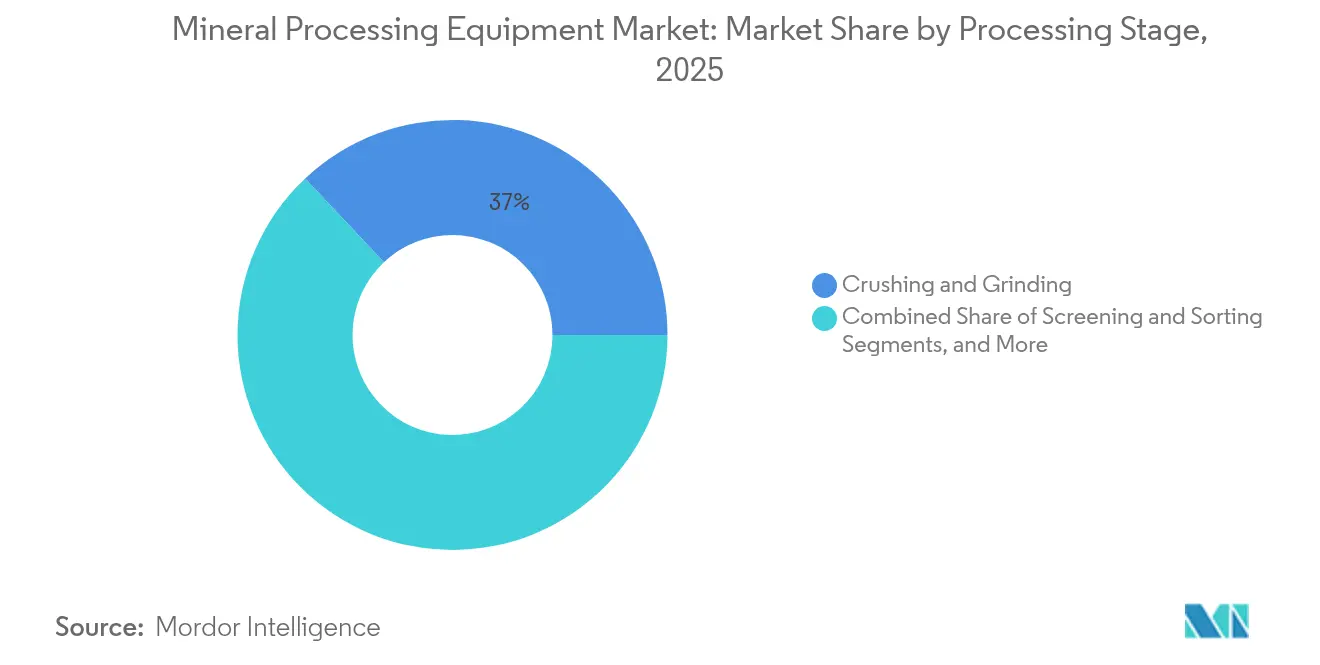
- By processing stage, crushing and grinding accounted for 37.02% of the mineral processing equipment market share in 2025, yet concentration processes are slated to grow at a 5.67% CAGR over the forecast period.
- By end-user industry, mineral and ore mining companies controlled 57.95% of the mineral processing equipment market share in 2025, while recycling and secondary metals processors are set to advance at a 6.05% CAGR through 2031.
- By geography, Asia-Pacific dominated the mineral processing equipment market with a 67.92% revenue share in 2025, while the Middle East and Africa region is forecast to register the highest 9.82% CAGR to 2031.
Note: Market size and forecast figures in this report are generated using Mordor Intelligence’s proprietary estimation framework, updated with the latest available data and insights as of 2026.
Market Trends and Insights
Drivers Impact Analysis of Mineral Processing Equipment Market*
| Driver | (~) % Impact on CAGR Forecast | Geographic Relevance | Impact Timeline |
|---|---|---|---|
| EV-Battery Metal Boom (Lithium, Nickel) | +2.1% | Global, concentrated in Asia-Pacific and South America | Medium term (2-4 years) |
| Shift to Finer-Grade Ores Driving High-Capacity Crushers | +1.8% | Australia, Chile, South Africa | Long term (≥ 4 years) |
| CAPEX Surge in African Critical-Mineral Projects | +1.2% | Sub-Saharan Africa | Medium term (2-4 years) |
| Digital-Twin Adoption for Plant-Wide Optimization | +0.9% | North America, Europe, advanced Asia-Pacific | Short term (≤ 2 years) |
| Green-Steel Initiatives Increasing Pelletizing Demand | +0.7% | Europe, North America, select Asia-Pacific | Long term (≥ 4 years) |
| AI-Based Ore-Sorting Reducing Downstream Energy Use | +0.6% | Early adoption in developed markets | Medium term (2-4 years) |
| Source: Mordor Intelligence | |||
EV-Battery Metal Boom (Lithium, Nickel)
Soaring demand for battery-grade inputs drives a pronounced shift in the Mineral Processing Equipment market. Lithium projects require specialized roasting, leaching, and crystallization circuits able to deliver 99.5%+ purity levels, prompting new orders for Metso’s pCAM and calciner packages[1]“Advanced Lithium Processing Solutions,”, Metso Corporation, metso.com. Nickel laterite processing equally benefits larger autoclaves, sulfuric-acid leach reactors, and downstream solvent-extraction units. OEMs with high-temperature, high-pressure design credentials command premium margins as investors fast-track integrated battery-metal hubs in Australia, Indonesia, and Chile. The resulting capacity build-out sustains double-digit equipment demand even when bulk-commodity spending moderates. Suppliers also integrate ESG reporting modules that trace cradle-to-gate emissions for each tonne of battery metal.
Shift to Finer-Grade Ores Driving High-Capacity Crushers
Copper, gold, and iron ore head grades continue to fall, obliging plants to process larger tonnages to maintain metal output. HPGR circuits yield 20-40% energy savings and finer product size distributions that elevate downstream flotation recovery, as demonstrated by Weir Group’s ENDURON installs [2].“ENDURON HPGR Energy Savings,”, Weir Group, global.weir Mines in Australia and Chile retrofit primary crushers with 20,000 t/h nameplate capacities, complemented by real-time particle-size analyzers that close the control loop. This cascading effect lifts demand for screens, cyclones, and dewatering equipment sized for higher slurry volumes. Suppliers that provide integrated comminution-to-classification packages capture added service revenue, reinforcing the Mineral Processing Equipment market’s focus on high-throughput, low-specific-energy solutions.
CAPEX Surge in African Critical-Mineral Projects
Record capital expenditure in cobalt, graphite, and rare-earth projects positions Sub-Saharan Africa as the fastest-growing export base for advanced concentrators. Kumba Iron Ore’s UHDMS plant shows how local miners adopt density-based separation to upgrade low-grade feeds [3]“Kumba’s UHDMS Plant Commissioning,”, Anglo American, angloamerican.com. Angola’s Longonjo rare-earth venture requires multi-stage magnetic and gravity modules to meet 99%+ NdPr specifications, opening scope for specialized European OEMs. Infrastructure build-outs—rail spurs, bulk-handling ports, and grid upgrades—enable mega-projects that justify full-line plant purchases. Political-risk premiums remain, yet OEMs mitigate exposure through local service partnerships and flexible vendor-financing terms, ensuring sustained Mineral Processing Equipment market momentum.
Digital-Twin Adoption for Plant-Wide Optimization
ABB and other control-system vendors increasingly embed high-resolution digital twins that mirror every valve, pump, and sensor in real time. Remote-operation centers in Perth and Santiago supervise multiple mines simultaneously, reducing fly-in-fly-out labor spend and safety incidents. Digital twins also support autonomous reagent dosing in flotation, enabling precise pH and frother control for complex polymetallic ores. Cybersecurity architecture remains a barrier; nevertheless, standardized OPC-UA and IEC 62443 frameworks accelerate broader rollouts. Consequently, software revenue becomes a sticky annuity stream inside the Mineral Processing Equipment market.
Restraints Impact Analysis of Mineral Processing Equipment Market*
| Restraint | (~) % Impact on CAGR Forecast | Geographic Relevance | Impact Timeline |
|---|---|---|---|
| ESG-Driven Capital Rationing for Green-Field Mines | -1.4% | Europe and North America | Short term (≤ 2 years) |
| Tightening Particulate-Matter Emission Norms | -1.1% | Global, intensity varies | Medium term (2-4 years) |
| Skilled-Workforce Shortages in Remote Regions | -0.8% | Australia, Canada, parts of Africa | Long term (≥ 4 years) |
| Geopolitical Supply-Chain Nationalism on Key Spares | -0.6% | United States–China corridors | Short term (≤ 2 years) |
| Source: Mordor Intelligence | |||
ESG-Driven Capital Rationing for Green-Field Mines
Institutional investors apply stringent ESG filters, slowing approvals for new mines and delaying linked plant orders. Greenfield iron ore and copper projects in Canada now require upfront carbon-neutral processing designs, adding up to 20% to installed costs. Extended permitting cycles compress near-term demand for crushers and mills, even as retrofit orders for dust-suppression and water-recycling systems rise. OEMs respond with modular, relocatable plants that minimize land disturbance and shorten environmental reviews, preserving a pipeline of smaller, faster-moving purchase orders within the Mineral Processing Equipment market.
Tightening Particulate-Matter Emission Norms
The U.S. Environmental Protection Agency’s New Source Performance Standards mandate <0.05 kg/t PM10 thresholds on screening and conveying circuits, driving investment in high-efficiency baghouses and enclosure systems [4]“PM10 Emission Limits for Crushers,”, U.S. Environmental Protection Agency, epa.gov. Similar rules in Canada and the EU further pressure operators to retrofit. Compliance accelerates demand for smart fan-control and filter-condition monitoring, though capital diversion from expansion projects can temper broader market growth. Suppliers that bundle emission-control guarantees with uptime contracts achieve differentiation, sustaining premium pricing within the Mineral Processing Equipment market.
*Our forecasts treat driver/restraint impacts as directional, not additive. The impact forecasts reflect baseline growth, mix effects, and variable interactions.
Mineral Processing Equipment Market Segment Analysis
By Mineral Mining Sector:
Lithium Drives TransformationLithium’s meteoric 13.58% CAGR through 2031 underscores structural change inside the mineral processing equipment market. Although bulk commodities under the “Others” banner still generated 89.55% of the mineral processing equipment market size in 2025, battery-metal plants are specifying calcination kilns, solvent-extraction mixers, and crystallizers built for ultra-low impurity thresholds. The Mineral Processing Equipment market captures investor enthusiasm as automakers seek secure, traceable supply chains. Traditional iron-ore and copper flows maintain large volumes; however, their single-digit growth contrasts sharply with double-digit expansion in critical mineral circuits.
Continued head-grade decline in copper and gold extends capex cycles for HPGR, fine-grinding, and flash-flotation gear. Though small in tonnage, rare-earth element circuits demand complex multi-stage separation that commands high unit pricing, lifting margin contribution. Suppliers thus allocate R&D toward hydrometallurgy and selective leaching, balancing legacy bulk-commodity exposure with high-growth specialty segments.


By Equipment:
Flotation Innovation AcceleratesCrushers and mills represented the largest 32.72% slice of the mineral processing equipment market size in 2025, yet advanced flotation cells booked the quickest 5.88% CAGR through 2031. Plants processing complex lead-zinc or nickel ores adopt automated air-flow and froth-camera systems to sustain grade. Integrated skid-mounted flotation modules shorten delivery to six months, suiting fast-track lithium projects.
Downstream, high-rate thickeners and paste-fill plants address tailings dam risk, while smart slurry pumps with wear-performance sensors extend the mean time between overhauls. Therefore, the Mineral Processing Equipment market share mix tilts gradually toward separation and tailings handling, reflecting heightened water stewardship and value-recovery priorities.
By Processing Stage:
Concentration Gains MomentumCrushing and grinding held 37.02% of the mineral processing equipment market size in 2025, underlining their indispensable role in mineral liberation. Nevertheless, concentration stages comprising flotation, magnetic, and gravity separation are forecast to log a 5.67% CAGR through 2031, outpacing comminution growth through 2030. AI-enabled sensor-based ore sorting removes 10-15% waste before energy-intensive milling, improving site emissions metrics and plant throughput.
Enhanced dewatering and filtration complete the flowsheet revamp, delivering stackable dry tails that meet tougher global safety codes. Coupled with digital twin orchestration, these advances elevate circuit-wide net recovery, justifying premium capex even amid volatile commodity pricing. Integrated suppliers can furnish “mine-to-mill-to-market” optimisation and secure durable customer lock-in across processing stages.
By End-User Industry:
Recycling EmergesMineral/Ore Mining Companies still generated 57.95% of the mineral processing equipment market size in 2025. Yet secondary-metal processors show the sharpest 6.05% CAGR through 2031, as governments legislate circular economy mandates. Urban ore plants for spent EV batteries need shredders, hydromet reactors, and cobalt-nickel precipitators engineered for high-impurity feeds. Contract processors handle multi-client concentrates, driving demand for rapid-switch hoppers and flexible control logic.
As steelmakers trial low-carbon direct-reduced iron modules, scrap-based feed blends open new channels for compact pelletizing lines and hot-briquetted iron equipment. End-user boundaries blur: miners invest in recycling to secure ESG credits, while recyclers explore upstream sourcing. Such cross-pollination diversifies revenue sources and underpins steady Mineral Processing Equipment market expansion.
Geography Analysis
APAC Mineral Processing Equipment Market
Asia-Pacific, with 67.92% of 2025 turnover, remains the nucleus of the mineral processing equipment market. China’s vast smelting and refining backbone absorbs crushers, mills, and filtration packages on an unparalleled scale. Australian iron-ore majors commit to 700+ Mt/y capacity, sustaining HPGR and screening upgrades, while Indonesian nickel laterite projects specify autoclaves and acid-plant tie-ins. India’s Production-Linked Incentive scheme for critical minerals and mining code reforms stimulates greenfield lithium and graphite developments that underpin incremental equipment demand in 2025-2030.
The Americas and EMEA Mineral Processing Equipment Market
The Middle East and Africa deliver the fastest 9.82% CAGR through 2031, as Saudi Arabia, Namibia, and Angola deploy sovereign capital to monetize phosphate, copper, and rare-earth resources. Solar-powered desalination plants feed water-intensive concentrators, cutting unit opex. Ma’aden’s mega-phosphate complex exemplifies integrated mine-to-fertilizer flows, capturing service contracts for pumps, thickeners, and rotary dryers. Localized maintenance hubs in Durban, Muscat, and Tema mitigate logistics delays, favoring OEMs that invest in on-ground technicians. North America and Europe record mid-single-digit growth rates anchored by supply-chain security agendas. United States federal grants fast-track domestic lithium-hydroxide refineries, benefitting calciner and crystallizer specialists. The EU’s Critical Raw Materials Act subsidizes rare-earth separation and battery recycling, boosting column-flotation and hydromet plant orders. South America’s lithium triangle retains momentum, although water-use restrictions in the high Andes propel the adoption of direct-lithium-extraction (DLE) modules that consume less brine. Geopolitics, ESG imperatives, and resource nationalism jointly reshape regional equipment procurement patterns, sustaining broad-based Mineral Processing Equipment market growth.
Mordor Intelligence provides coverage of the mineral processing equipment market across other key regional markets. Detailed country-level analysis extends to Japan, Mexico, Oman, Egypt, Morocco, South Africa, Italy, Brazil, Saudi Arabia, and Australia incorporating local coverage and market participation, as required.

Regulatory Landscape
Regulation for mineral processing equipment is shaped by emissions control, machinery safety, and mine-site equipment approval regimes. In the United States, air-emission compliance for crushing, grinding, and screening operations is governed under EPA New Source Performance Standards, including 40 CFR Part 60 Subpart OOO for nonmetallic mineral processing plants and Subpart LL for metallic mineral processing plants, both of which drive adoption of monitored dust-control systems and documented calibration practices for control devices. Mine-site equipment safety and approvals are also influenced by MSHA requirements under 30 CFR Chapter I Subchapter B, covering testing and approval pathways for mining products such as electric motor-driven equipment and related safety systems.
In Europe, machinery safety requirements relevant to processing and sorting equipment include CEN standards such as EN 1009-5:2020, applied for specific machine safety requirements in cleaning, recycling, and sorting equipment. Separately, Regulation (EU) 2025/14 (adopted in December 2024) establishes EU type-approval and market surveillance requirements for non-road mobile machinery circulating on public roads, with transition provisions extending through January 29, 2036, which affects OEM conformity planning for mobile and transported processing assets. In June 2026, MSHA finalized a rule removing outdated flame-resistance approval requirements for conveyor belts in underground coal mines (effective July 27, 2026), reflecting ongoing modernization of mine safety compliance frameworks that can affect component specifications and procurement documentation.
Value Chain Analysis
The mineral processing equipment value chain runs from upstream inputs, including castings and forgings, wear alloys, motors, gearboxes, hydraulics, sensors and automation, and filtration media, through OEM design, manufacturing, and factory acceptance testing, and then into EPC/EPCM-led plant engineering and site integration, commissioning, and lifecycle service. Partnerships with engineering and EPCM firms remain a major route to market for large concentrator and beneficiation packages because those firms consolidate procurement across comminution, separation, and dewatering circuits, while OEMs differentiate through proprietary process know-how, digital control layers, and performance guarantees.
Downstream, the aftermarket, including spares, wear parts, relines, rebuilds, field service, and remote monitoring, is strategically important as operators focus on uptime and cost-per-ton control under higher utilization and harder-to-process ores. Project schedules can hinge on delivery lead times and the availability of critical components and consumables, with reported 9 to 12 month equipment delivery delays impacting certain critical mineral processing projects in 2025. That has supported demand for local service hubs, multi-year service agreements, and supply-chain localization strategies, especially for grinding media, mill linings, filtration consumables, and automation spares used in high-throughput circuits.
Competitive Landscape
The Mineral Processing Equipment market features a moderate concentration with major players like FLSmidth expanding its digital suite by integrating advanced process control into its Knelson Gravity concentrators, allowing mine-wide reconciliation dashboards. Metso continues to deploy modular hydrogen-fuel-ready roasting systems, capturing early-mover advantage in low-carbon battery-metal flowsheets. Sandvik’s Rock Processing division benefits from a growing installed base of hybrid surface drills equipped with in-pit ore-grading sensors.
Weir Group leverages its Motion Metrics payload-optimization platform to upsell spare-part kits, lifting lifecycle margin per machine. Epiroc’s May 2024 acquisition spree adds underground automation capabilities, positioning the firm for fleet-agnostic digital contracts. Emerging competitors such as TOMRA, Eriez, and Glencore Technology focus on niche separation and ore-sorting niches, using performance guarantees to displace incumbents in brownfield expansions.
Strategic collaborations intensify: OEMs partner with cloud providers for secure telemetry infrastructure, and with chemical suppliers to co-develop reagent-plus-equipment packages for complex ores. Sustainability credentials act as new battlegrounds; vendors publish cradle-to-gate carbon footprints and offer refurbishment programs that extend equipment life cycles. While price competition persists in mature crusher lines, differentiation pivots toward throughput guarantees, remote-support SLAs, and comprehensive training for local technicians—further consolidating customer relationships inside the mineral processing equipment market.
Mineral Processing Equipment Industry Leaders
FLSmidth A/S
Komatsu Ltd
Sandvik AB
Weir Group
Metso Corporation
- *Disclaimer: Major Players sorted in no particular order
Mineral Processing Equipment Market Companies Covered in this Report
- FLSmidth A/S
- Metso Corporation
- Komatsu Ltd.
- Sandvik AB
- The Weir Group PLC
- ThyssenKrupp AG
- TAKRAF GmbH
- CITIC Heavy Industries Co., Ltd.
- Terex Corporation
- Wirtgen GmbH
- Multotec (Pty) Ltd
- FEECO International, Inc.
- McLanahan Corporation
- Tenova S.p.A.
- Haver & Boecker Niagara GmbH
- Derrick Corporation
- Eriez Manufacturing Co.
- Astec Industries, Inc.
- Sotecma S.L.

Market Opportunities and Future Outlook
Decarbonization, water constraints, and ore complexity are shifting equipment demand beyond conventional comminution toward integrated flowsheets that reduce energy intensity per tonne and improve water recovery. A clear opportunity sits in dewatering and filtration upgrades tied to tailings risk reduction and water stewardship, consistent with OEM emphasis on multi-year filtration lifecycle service agreements (for example, Metso signed two multi-year Life Cycle Services agreements totaling EUR 60 million in June 2026 for Larox PF filter support across copper and lead/zinc operations). Suppliers that bundle equipment, process control, and service SLAs across concentration and dewatering stages can fit these purchasing patterns.
Digitalization and electrification are also broadening the addressable scope around processing plants, including sensors, advanced process control, and remote operations that help stabilize recovery on variable feed. Practical battery-electric equipment deployment in demanding mining environments (for example, Normet reported successful daily-cycle deployment of SmartDrive battery-electric machines at Oyu Tolgoi in Mongolia in June 2026) supports mine electrification programs that often coincide with upgrades to crushers, pumps, ventilation, and plant control architectures. Circularity and reprocessing add another demand pool, with large miners reporting meaningful output linked to circularity initiatives, such as Vale disclosing 26 million tonnes of iron ore produced in 2025 from circularity initiatives, which keeps interest in retrofit-friendly separation, classification, and dewatering packages for tailings and stockpile re-treatment.
Recent Industry Developments in Mineral Processing Equipment Market
- July 2026: FLSmidth was awarded a multi-year contract to supply complete mill lining solutions for a gold mine in the Australia South-East Asia (ASEA) region. The award strengthens FLSmidth's consumables and service-led positioning in comminution, where liner performance and changeout planning directly influence plant availability.
- June 2026: Sandvik signed an agreement to acquire Italy-based Diemme Filtration, a specialist in high-performance filter presses for mining, with plans to form a new Filtration division within Rock Processing. The move broadens Sandvik's exposure to tailings management and water recovery needs, aligning its portfolio more tightly with dewatering demand across modern concentrator flowsheets.
- May 2026: FLSmidth received an order of around DKK 300 million to supply key technologies for a BHQ iron ore beneficiation project in South Asia, including HPGRs, stirred media mills, and flotation technology. The order underscores continued investment in high-intensity beneficiation circuits designed to process lower-grade, harder-to-upgrade ores while emphasizing energy-efficient comminution and recovery-focused separation.


Mineral Processing Equipment Market Report Scope and Research Methodology
Market Definition and Coverage
This market covers equipment used to process mined ore into usable mineral products, from primary size reduction to separation and related processing steps. Revenue is measured as equipment sales plus associated supply.
Scope exclusions: We exclude upstream mining tools used only for drilling, blasting, or hauling, and we also exclude standalone plant construction and civil works services.
Segments Covered in This Report
- By Mineral Mining Sector
- Bauxite
- Copper
- Iron
- Lithium
- Nickel
- Rare-earth Elements
- Gold and Precious Metals
- Others
- By Equipment
- Crushers and Mills
- Screens and Separators
- Feeders and Conveyors
- Drills and Breakers
- Thickening and Clarification
- Flotation Cells
- Magnetic and Gravity Separators
- Pumps and Valves
- Filtration and Dewatering
- By Processing Stage
- Crushing and Grinding
- Screening and Sorting
- Concentration (Flotation/Separation)
- Dewatering
- Material Handling
- By End-User Industry
- Mineral/Ore Mining Companies
- Contract Processing Plants
- Recycling and Secondary Metals
- Aggregates and Construction
- Geography
- North America
- United States
- Canada
- Rest of North America
- South America
- Brazil
- Chile
- Rest of South America
- Europe
- Germany
- United Kingdom
- France
- Italy
- Rest of Europe
- Asia-Pacific
- China
- India
- Australia
- Japan
- South Korea
- Rest of Asia-Pacific
- Middle East and Africa
- United Arab Emirates
- Saudi Arabia
- Turkey
- Egypt
- South Africa
- Rest of Middle East and Africa
- North America
Data Sources, Market Sizing, and Validation
Desk Research
Desk research was used to build the starting structure for the model and to set realistic ranges for equipment demand by region and by mineral activity. We referred to public mining and industrial datasets and publications such as USGS mineral commodity summaries, the World Bank commodity and macro indicators, UN Comtrade trade statistics, and EITI country disclosures where mining project pipelines are discussed.
To link equipment demand with on-ground activity, we also reviewed sources such as national geological surveys and mining ministries, peer-reviewed papers on comminution and separation flowsheets, and selected customs and tender notices that signal new plant builds and retrofits. Company annual reports, investor presentations, and reputable industry press were used to cross-check capacity additions, capex spending tone, and delivery lead times. Where helpful, paid subscriptions that provide company financials and intelligence, and patent databases, were used to confirm product focus areas and timing of technology rollouts. These are illustrative examples only, and many other sources were also consulted for data collection, validation, and clarification.
Primary Interviews and Surveys
Primary work focused on validating what gets purchased, when it gets replaced, and how pricing moves across major equipment groups such as crushers and mills, screens and separators, and other processing equipment. We spoke with a mix of equipment-focused executives, operations and maintenance leaders at mining sites, and managers involved in project planning and procurement, then used the inputs to tighten assumptions by mineral activity and region.
For a global market like this, the checks were spread across APAC, EMEA, and the Americas so differences in project cycles, local processing strategies, and import reliance could be reflected without overfitting any single geography.
Distribution of primary research fieldwork respondents
| Company type | Respondent position | Region |
|---|---|---|
| Top tier: 27% | CXOs: 18% | APAC: 41% |
| Mid tier: 55% | Functional/Unit leaders: 39% | EMEA: 34% |
| Smaller Players: 18% | Managers: 43% | Americas: 25% |
Market-Sizing & Forecasting
Sizing starts with a top-down build where mining and processing activity is reconstructed using mineral production and project signals, then translated into equipment demand using typical plant flowsheets and replacement cycles. Once the demand pool is created, it is converted into value using representative price bands by major equipment classes and by region, and then adjusted for mix shifts.
To keep the totals practical, we corroborated the model with selective bottom-up approximations such as sampled equipment shipment volumes from disclosures, channel checks on lead times, and ASP x unit ranges for high-value items like crushers, mills, and separators. Inputs that shaped the model included capex intensity trends for new processing capacity, ore grade and comminution intensity (which affects crushing and grinding loads), adoption of energy-efficient circuits like HPGR-driven upgrades, aftermarket versus new-build mix, and commodity-driven investment cycles for minerals such as copper, iron, lithium, nickel, and rare earths.
Forecasting relies on scenario analysis, since project approvals and commodity prices can swing, and expert views help set realistic timing for expansions and deferred projects. Where information was thin for smaller countries or niche minerals, we used proxy indicators like regional mineral output and import patterns to fill gaps, and then the results were rechecked with interview feedback before finalizing.
Data Validation & Update Cycle
Validation is done by triangulating model outputs against independent signals such as regional mining capex direction, equipment import patterns, and the observed pace of plant expansions and refurbishments. Outliers are investigated, and when a number looks too high or too low, the related assumptions like replacement rate, price band, or project timing are revisited before sign-off.
A multi-step analyst review is followed so the logic, calculations, and scope treatments stay consistent across regions and equipment categories. Reports refresh annually, and interim updates are triggered when material events occur, such as sharp commodity price changes, major project approvals, or supply constraints that can delay deliveries. Right before delivery, we run a fresh pass to incorporate the latest public signals and interview-based checks so clients receive an updated view.
Mordor Intelligence's Mineral Processing Equipment Market Sizing Compared With Other Published Estimates
Published market numbers for mineral processing equipment can look far apart because each study draws the line around equipment types and processing stages differently, then applies its own price and cycle assumptions. We also see gaps when some estimates treat mining activity as a straight proxy for equipment sales without checking replacement timing and retrofit demand.
The main gap comes from whether crushing and grinding-only packages are counted on their own or bundled with adjacent categories like broader mining machinery and full plant engineering value, which can move the totals a lot. Some forecasts also bake in aggressive commodity upcycles or use fixed exchange rates, which can inflate or compress the USD value depending on the year selected. By keeping the scope centered on processing equipment groups and pressure-testing price progression and replacement cycles through interviews, Mordor Intelligence keeps the 2026 number tied to an equipment-demand pool that can be explained and repeated.
Benchmark comparison
| Source | Market Size | Gaps in Research Methodology |
|---|---|---|
| Mordor Intelligence | USD 18.59 B (2026) | |
| Trade Journal A | USD 7.42 B (2025) | This figure reflects a narrower combined category focused on crushing, screening, and processing equipment, and it can exclude broader separation and process equipment value that is counted in full mineral processing flowsheets. |
| Industry Publisher B | USD 13.14 B (2024) | Some summaries fold in aggregate applications and apply a slower project cycle with less emphasis on battery-mineral processing buildouts, which changes the implied volume and pricing mix versus a mining-led demand pool. |
The spread in published values mainly follows scope and conversion choices, especially what is included beyond core plant equipment and how pricing is stepped forward by region. When the scope is kept consistent and the key variables are tied back to observable mining and processing activity, the resulting market size becomes easier to reconcile and track year to year, which helps decision-makers plan with fewer surprises.


Key Questions Answered in the Report
How large is the Mineral Processing Equipment market in 2026?
The Mineral Processing Equipment market size stands at USD 18.59 billion in 2026 and is forecast to reach USD 24.44 billion by 2031.
Which region dominates demand for mineral processing equipment?
Asia-Pacific leads with 67.92% revenue share, driven by China’s large-scale processing capacity and Australia’s high-throughput iron-ore operations.
What equipment category is growing the fastest?
Flotation cells post the quickest 5.88% CAGR because falling ore grades require more efficient separation to maintain metal recovery.
Why is lithium processing equipment in high demand?
Battery-metal supply chains need ultra-pure feedstock, prompting lithium projects to invest in specialized roasting, leaching, and crystallization circuits.
How are ESG regulations affecting equipment purchases?
Stricter particulate-matter and carbon-emission rules drive investment in dust-control, energy-efficient grinding, and water-recycling systems, influencing overall capex decisions.
Page last updated on:


 Your data is secure and never sold or shared.


