
Military Transport Market Size and Share
Market Overview
| Study Period | 2020 - 2031 |
|---|---|
| Market Size (2026) | USD 24.14 Billion |
| Market Size (2031) | USD 32.23 Billion |
| Growth Rate (2026 - 2031) | 5.92 % |
| Fastest Growing Market | Asia-Pacific |
| Largest Market | North America |
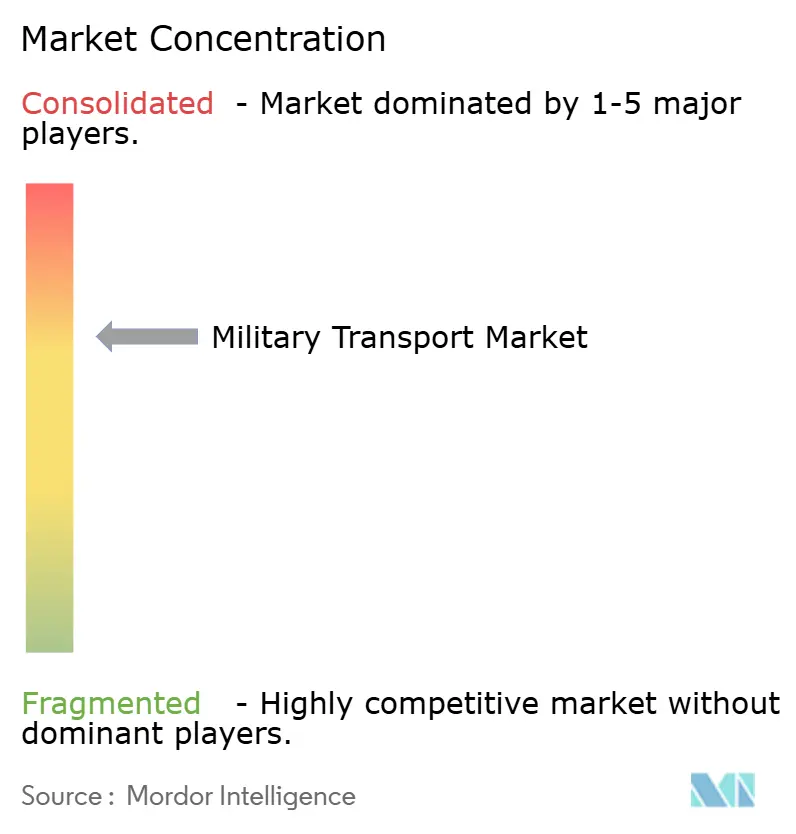
| Market Concentration | Medium |
Major Players *Disclaimer: Major Players sorted in no particular order Image © Mordor Intelligence. Reuse requires attribution under CC BY 4.0. | |
Military Transport Market Analysis by Mordor Intelligence
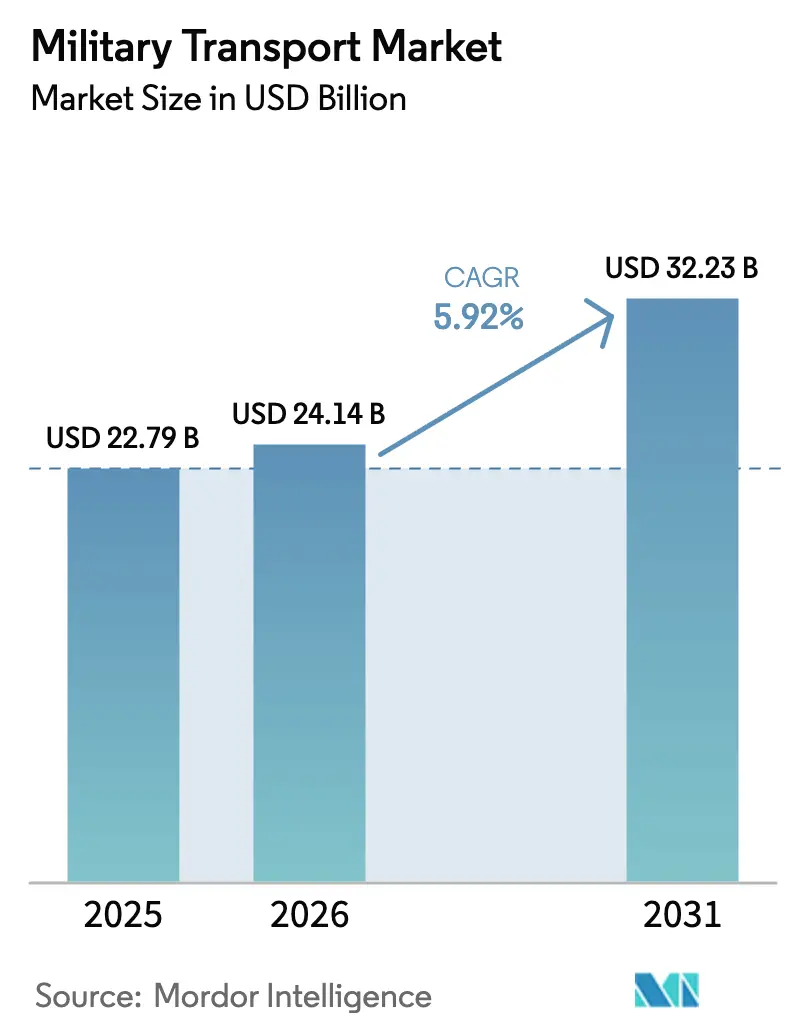
The military transport market size in 2026 is estimated at USD 24.14 billion, growing from 2025 value of USD 22.79 billion with 2031 projections showing USD 32.23 billion, growing at 5.92% CAGR over 2026-2031. Fleet recapitalization, hybrid-electric propulsion adoption, and AI-enabled maintenance software accelerate the pace of military upgrades to logistics platforms. Programs such as the US Army’s USD 214.8 million FMTV A2 procurement and Germany’s USD 165 million A400M upgrade reflect how governments are replacing aging vehicles and aircraft while embedding digital health-monitoring systems to cut downtime. The military transport market benefits from expanding humanitarian operations—exemplified by 8.7 million kg of aid moved to Gaza via the US Joint Logistics Over-the-Shore pier—which showcases demand for flexible lift assets. Consolidation is reshaping supplier dynamics, with Leonardo’s EUR 1.7 billion (USD 1.96 billion) Iveco Defence takeover and Rheinmetall’s USD 950 million Loc Performance acquisition broadening European and US product portfolios.
Key Report Takeaways
- By platform, ground transport vehicles held 42.12% of the military transport market share in 2025 and are forecast to register the highest segment CAGR at 9.52% through 2031.
- By application, cargo and equipment transport commanded a 45.73% revenue share in 2025; humanitarian and disaster relief represents the highest-growth application, with a 7.06% CAGR to 2031.
- By propulsion technology, hybrid-electric propulsion is the single fastest-growing propulsion category, expanding at a 10.63% CAGR through 2031 while conventional systems keep the largest 91.12% share of the military transport market size in 2025.
- By end user, the army end-user segment accounted for 48.23% of the military transport market size in 2025, whereas the air force segment records the highest service-level CAGR at 6.95% to 2031.
- By geography, North America remained the largest market with a 32.12% share in 2025, while Asia-Pacific posts the highest regional CAGR at 7.18% through 2031.
Note: Market size and forecast figures in this report are generated using Mordor Intelligence’s proprietary estimation framework, updated with the latest available data and insights as of 2026.
Market Trends and Insights
Drivers Impact Analysis of Military Transport Market*
| Driver | ( ~ )% Impact on CAGR Forecast | Geographic Relevance | Impact Timeline |
|---|---|---|---|
| Growing global demand for strategic and tactical airlift capabilities | +1.8% | Asia-Pacific and Europe | Medium term (2-4 years) |
| Operational shift toward rapid deployment in decentralized warfare environments | +1.2% | Indo-Pacific and Eastern Europe | Short term (≤ 2 years) |
| Modernization and recapitalization of aging military transport fleets | +0.9% | North America and Europe | Long term (≥ 4 years |
| Rising frequency of global humanitarian and disaster relief missions | +0.7% | Conflict-prone regions worldwide | Medium term (2-4 years) |
| Increased adoption of dual-use transport platforms with civil certification pathways | +0.6% | North America, Europe, Asia-Pacific | Long term (≥ 4 years) |
| Integration of AI-driven predictive maintenance to optimize life-cycle costs | +0.5% | Technology-intensive militaries | Medium term (2-4 years) |
| Source: Mordor Intelligence | |||
Growing Global Demand for Strategic and Tactical Airlift Capabilities
Japan’s decision to add 13 KC-46A tankers and 17 CH-47 Block II Chinooks underscores rising lift requirements for Indo-Pacific missions.[1] China promotes its Y-20B airlifter to states like Nigeria, expanding competition beyond traditional suppliers. A decade of A400M Atlas service with the RAF validates the platform’s 37-ton payload and 8,900 km unrefuelled range for combat and humanitarian tasks. Demand is reinforced by multinational exercises that move heavy equipment across long distances, compelling air forces to enlarge their fleets. These procurements steadily widen the addressable base for maintenance, training, and ground-support contracts within the military transport market.
Operational Shift Toward Rapid Deployment in Decentralized Warfare Environments
Doctrine now centers on agile units able to disperse and re-aggregate quickly across multiple domains. The US Army’s Next Generation Tactical Vehicle-Hybrid offers Silent Drive and Watch modes, permitting covert convoy movement and on-board power generation. Australia’s Talisman Sabre exercise, involving 35,000 personnel from 19 countries, highlighted how US watercraft supported littoral logistics quickly. China integrates high-speed rail into mobilization plans, reducing transit times for brigades traversing vast distances.[2] Such concepts push demand for versatile platforms that load and unload quickly, reinforcing procurement pipelines for tactical trucks, tilt-rotors, and mobile port equipment within the military transport market.
Modernization and Recapitalization of Aging Military Transport Fleets
The US Marine Corps is spending USD 360 million to extend 360 MV-22B Ospreys to the 2050s through the ReVAMP program, a blueprint other services emulate for legacy aircraft. Poland’s C-295M upgrade contract enhances NATO interoperability with new avionics and SATCOM links. The US Air Force is pivoting to cargo-aircraft recapitalization now that tanker modernization has entered maturity. Such long-cycle investments create sustained replacement demand and spur contiguous orders for simulators, spares, and digital twins across the military transport market.
Rising Frequency of Global Humanitarian and Disaster-Relief Missions
Military lift assets now deploy as first responders to conflict and climate emergencies. India executed multiple evacuations—Operation Ajay, Kaveri, and Ganga—between 2024 and 2025, demonstrating how air and sea transport underpin national crisis diplomacy. Despite rough seas, the US Gaza pier delivered 8.7 million kg of aid within 20 days, proving afloat offload concepts for contested littorals. New Zealand’s USD 1 billion enhanced sealift vessel will incorporate a well dock to speed aid delivery across the Pacific. Humanitarian operations enlarge the mission set for cargo aircraft, landing platform docks, and tactical trucks, strengthening revenue visibility in the military transport market.
Restraints Impact Analysis of Military Transport Market*
| Restraint | ( ~ )% Impact on CAGR Forecast | Geographic Relevance | Impact Timeline |
|---|---|---|---|
| Supply chain vulnerabilities affecting aerospace-grade material availability | −0.8% | Western manufacturers | Short term (≤ 2 years) |
| Budgetary shifts toward unmanned systems amid rising defense inflation | −0.6% | North America and Europe | Medium term (2-4 years) |
| Limited global shipyard capacity for large roll-on/roll-off vessel construction | −0.4% | Global | Long term (≥ 4 years) |
| Stricter emission regulations delaying upgrades of legacy propulsion systems | −0.3% | Europe and North America | Long term (≥ 4 years) |
| Source: Mordor Intelligence | |||
Supply Chain Vulnerabilities Affecting Aerospace-Grade Material Availability
Material shortages undermine production schedules for aircraft, trucks, and naval hulls that demand aerospace-grade aluminum, titanium, and rare-earth alloys. The Pentagon has listed 280 critical material dependencies, many tied to Chinese supply chains, exposing programs that rely on specialty metals and electronic components. European manufacturers are adopting dual-sourcing and accepting longer lead times, with Airbus revising A400M delivery calendars while Rheinmetall buys US suppliers to secure titanium feedstock and machining capability. Semiconductor scarcity exacerbates the problem; lead times for military-grade chips have stretched from 12 weeks to more than 52 weeks, forcing avionics engineers to redesign boards around whatever parts can be sourced. Mitigation measures such as the US CHIPS Act and the European Critical Raw Materials Act promise fresh capacity. Yet, new foundries and processing plants will not reach volume for at least three years, keeping near-term production risk elevated. These constraints delay the fielding of new lift assets and reduce the annual delivery profile that underpins the military transport market.
Budgetary Shifts Toward Unmanned Systems Amid Rising Defense Inflation
Defense ministries are channeling a larger share of procurement toward autonomous platforms, crowding out funding for traditional transport assets. The US Department of Defense raised unmanned-systems allocations from USD 7.5 billion in FY2021 to USD 10.1 billion in FY2025, a 34.7% jump that outstrips growth in manned programs. Initiatives such as the Army’s Autonomous Ground Resupply trucks and the Navy’s Large Unmanned Surface Vessel directly compete with future tactical truck and sealift vessel buys. Inflation amplifies the squeeze; specialized metals, skilled labor, and certification costs push military transport prices up 8-12% yearly, forcing managers to cut quantities or slip schedules. European trends mirror this pivot, with Germany’s EUR 100 billion (USD 115.57 billion) Sondervermögen and France’s naval budgets steering new money toward unmanned and cyber capabilities rather than conventional amphibious hulls. Successful battlefield performance of drones in Ukraine strengthens political momentum for autonomous logistics, intensifying the budgetary headwinds faced by legacy military transport fleets.
*Our forecasts treat driver/restraint impacts as directional, not additive. The impact forecasts reflect baseline growth, mix effects, and variable interactions.
Military Transport Market Segment Analysis
By Platform Type:
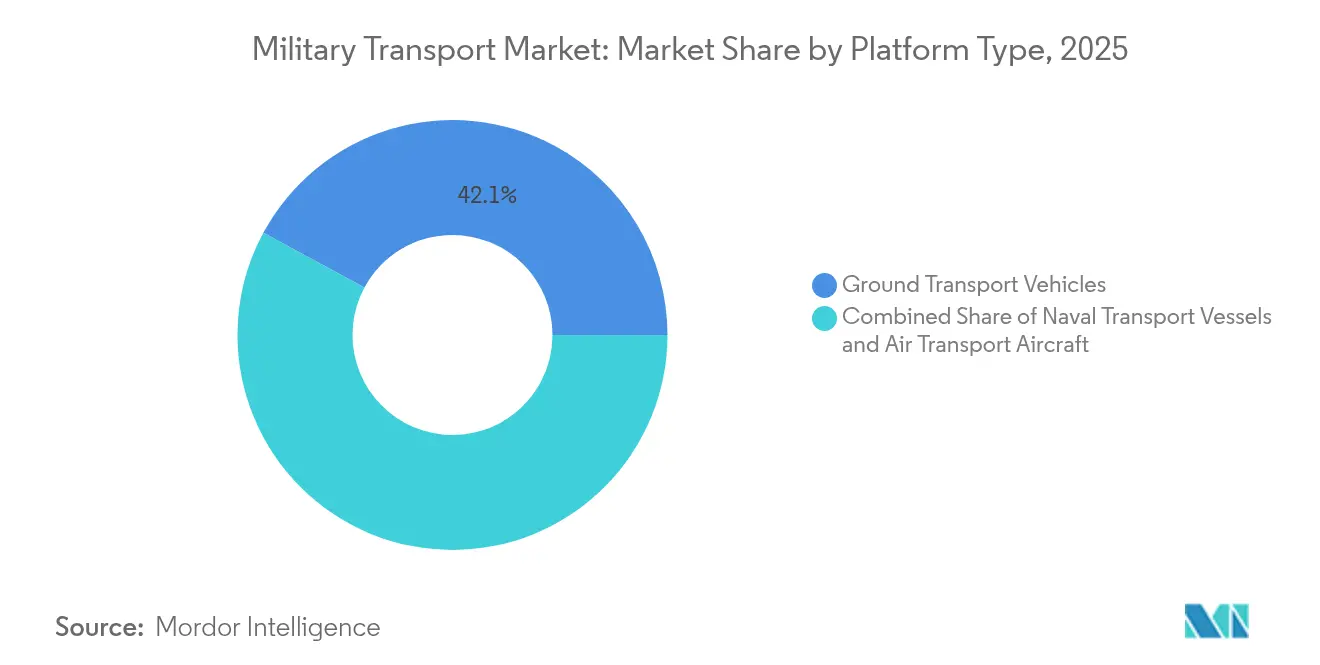
Ground Vehicles Lead Hybrid-Electric RevolutionGround vehicles captured 42.12% of the military transport market share in 2025 while registering the fastest 9.52% CAGR projection to 2031. Programs such as the USD 1.54 billion FHTV V contract and continued FMTV A2 orders are refreshing heavy and medium truck fleets with enhanced payload protection and digital diagnostics. The military transport market size for heavy tactical trucks is primed to rise as armies adopt modular architectures that integrate power distribution units for directed-energy or command-and-control payloads. Hybrid-electric conversions are cascading across light and medium platforms. GM Defense’s Next Generation Tactical Vehicle-Hybrid delivers silent-watch functionality and exportable 120 kW power, supporting sensors and unmanned systems in austere sites. Armored logistics carriers such as Rheinmetall’s TGS-Mil Protected unite NATO Level 3 protection with 4×4 drivetrains optimized for expeditionary ops.
Naval transport vessels continue to evolve through roll-on/roll-off hull forms and enhanced beaching capabilities. India’s 200 m Landing Platform Dock program integrates electric propulsion and 60-day endurance, offering humanitarian assistance scalability for Indo-Pacific settings. Concurrently, airlift platforms such as the A400M Atlas mark milestones that validate multi-domain integration, with Airbus now showcasing a variant able to network swarming drones. These advances widen capability gaps that drive procurement of blended fleets across the military transport market.

By Application:
Humanitarian Missions Drive Fastest GrowthCargo and equipment transport preserved a 45.73% revenue lead in 2025, underpinning the routine movement of ammunition, bridging systems, and armored vehicles worldwide. Within this segment, the C-17 Globemaster and A400M Atlas remain indispensable for outsize loads and austere-strip operations, maintaining robust utilization rates during exercises such as Australia’s Pitch Black and multinational relief sorties.
Humanitarian and disaster-relief missions are expected to grow faster than any other application, recording a 7.06% CAGR to 2031. The Gaza pier operation validated Joint Logistics Over-the-Shore constructs, spurring fresh interest in modular causeways and sealift connectors. India’s evolution from regional responder to global evacuator underscores political value in fast, credible lift. Autonomous casualty evacuation robots, like the Expeditionary Modular Autonomous Vehicle, showcase how unmanned ground systems can shorten the critical care timeline, raising tactical and strategic stakes within the military transport market size for humanitarian tasks. Personnel transport continues to absorb investment, particularly for rotary-wing fleets that hoist troops into dispersed landing zones. Medevac and emergency rescue variants leverage augmented-reality medical displays and secure telemetry links that improve in-flight triage. These upgrade cycles ensure the broader military transport industry addresses complex scenarios ranging from urban search-and-rescue to expeditionary peacekeeping.
By Propulsion Technology:
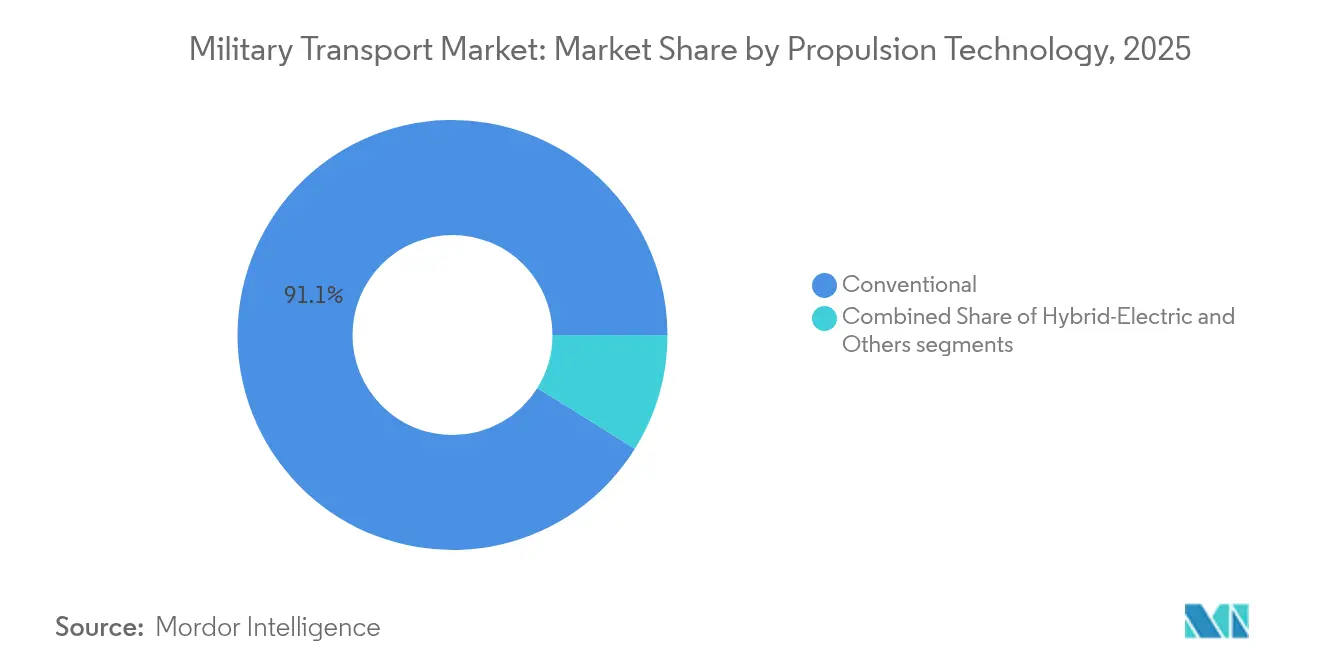
Hybrid-Electric Surge Challenges Conventional DominanceConventional propulsion retained 91.12% of the military transport market in 2025, due to mature supply chains and worldwide diesel distribution networks. Diesel engines and gas turbines remain embedded in doctrine and logistics manuals, emphasizing reliability during high-tempo operations.
Hybrid-electric technology, however, is advancing at a 10.63% CAGR through 2031, injecting stealth and fuel-burn savings into operational concepts. The forthcoming M1E3 Abrams will become the US Army’s first series-production hybrid-electric tank, integrating batteries that support silent surveillance while trimming logistic convoys. GE Aerospace’s megawatt-class demonstrator connects a CT7 turboshaft to an electric motor, illustrating how rotary-wing platforms can gain 20% fuel efficiency without sacrificing hot-and-high performance. The push toward battery-dominant designs is furthered by the service goal of fielding an all-electric non-tactical vehicle fleet before 2035, an initiative that seeds supplier ecosystems across the military transport market.
By End User:
Air Force Growth Outpaces Traditional Army DominanceArmies controlled 48.23% of spending in 2025, reflecting extensive requirements for line-haul trucks, fuel bowsers, and engineering equipment. Recent orders for 240 additional FMTV tactical trucks amplify capacity for both active and National Guard units.
Air forces are forecasted to grow faster, posting a 6.95% CAGR during the period. Japan’s USD 882 million CH-47 purchase and 13 KC-46A acquisition illustrate renewed emphasis on aerial refueling and airlift self-sufficiency. The US Air Force’s planned cargo-aircraft recapitalization will shape future contests between the C-130J, C-390, and potential clean-sheet entrants, enlarging the military transport market size dedicated to fixed-wing fleets. Navies and marines invest in landing platform docks, expeditionary transfer docks, and connector craft to support littoral campaigns. Seabasing strategies rely on large-volume sealift to shuttle munitions, fuel, and disaster-relief stores across archipelagos, pushing demand for afloat medical facilities and roll-on/roll-off ramps. This distribution helps balance service-level spending patterns across the military transport market.
Geography Analysis
North America Military Transport Market
North America held 32.12% of the military transport market in 2025, powered by the United States' USD 214.8 million FMTV A2 truck buy, USD 360 million MV-22B modernization, and multiple aerial refueler programs. Canada is fielding Arctic patrol ships and joint support vessels that strengthen NATO's resilience in the High North. The region's leadership in AI diagnostics and hybrid-electric propulsion positions domestic suppliers to capture export orders, further enlarging the military transport market.
APAC Military Transport Market
Asia-Pacific is projected to be the fastest-growing region at 7.18% CAGR. China inducts next-generation heavy trucks, advances Y-20B airlifter production, and integrates high-speed rail into mobilization doctrine. Japan's multibillion-dollar airlift and helicopter purchases and South Korea's USD 8.8 billion procurement approvals signal a broad commitment to logistics modernization. Historical investment since 2019 shows a steady shift from platform quantity to capability depth, reinforcing growth prospects for the military transport market in the region.
Europe Military Transport Market
Europe maintains robust demand via multinational frameworks and national programs. Germany's EUR 3.5 billion (USD 4.05 billion) vehicle agreement underpins continental logistics readiness. The trilateral Future Mid-Size Tactical Cargo initiative allocates EUR 30 million (USD 34.71 million) to design a C-130 replacement by 2040, demonstrating collaborative innovation. Consolidation moves such as Leonardo's Iveco Defence purchase concentrate expertise and align supply chains, keeping Europe a pivotal contributor to the military transport market.

Regulatory Landscape
Military transport procurement is shaped by defense budget authorizations and appropriations, along with program-structure direction that changes how platforms are contracted and delivered. In the United States, the FY2026 President's Budget documents include USD 17.73 billion for Air Force Aircraft Procurement, with USD 2.8 billion allocated to airlift aircraft, which supports funding visibility for fixed-wing lift, upgrades, and associated mission systems.
Legislative direction is also influencing acquisition models and sustainment timelines for key fleets. The FY2026 NDAA (P.L. 119-60) directed the US Navy to implement a Vessel Construction Manager approach for the Medium Landing Ship program, and it required analysis of alternatives for executive airlift recapitalization while authorizing USD 602 million for VC-25B. Separately, the Department of Defense Appropriations Act, 2026 (P.L. 119-75) provided USD 976 million for six C-130J aircraft for the Air National Guard, showing how annual appropriations can materially affect airlift procurement profiles.
Value Chain Analysis
The military transport value chain runs from raw materials and electronics, to platform design and assembly (ground vehicles, naval sealift, and airlifters). It then extends to mission-system integration (avionics, communications, and digital maintenance tooling), test and certification, and lifecycle support (spares, depot maintenance, training systems, and software upgrades). Program structures increasingly emphasize modularity and upgradeability, which increases the influence of subsystem suppliers and digital sustainment providers alongside prime OEMs.
Recent contracting activity also illustrates how primes coordinate distributed production and sustainment ecosystems across multiple facilities and subcontractors. For example, the US Navy awarded TOTE Services LLC a USD 2.2 billion prime contract for the Medium Landing Ship program, with industrial execution coordinated across partners such as Bollinger Shipyards and Fincantieri Marinette Marine, highlighting how shipyard capacity and tiered subcontracting shape delivery timelines. In airborne transport and enabling capabilities, BAE Systems and Lockheed Martin have explored palletized deployment concepts for the Blizzard uncrewed air system from transport aircraft such as the Airbus A400M and Lockheed Martin C-130, connecting aircraft OEMs, payload developers, and integration specialists around add-on mission kits that operate on existing lift fleets.
Competitive Landscape
The military transport market is moderately concentrated, fortifying leading primes by government ties and multidecade production runs. Partnerships accelerate technology diffusion. Lockheed Martin Corporation and General Dynamics Corporation have pooled solid-rocket motor know-how to buttress the US munitions base. At the same time, Lockheed and Rheinmetall will produce missiles in Europe, ensuring supply autonomy. Joby Aviation’s tie-up with L3Harris on hybrid VTOL aircraft offers an alternate path for vertical lift, challenging legacy helicopter OEMs.
Leonardo’s acquisition of Iveco Defence creates a land-systems powerhouse that rivals US and German incumbents, expanding product breadth from multirole trucks to 8×8 armored carriers. Rheinmetall’s purchase of Loc Performance positions the firm to bid aggressively on the XM30 infantry vehicle and Common Tactical Truck, programs valued at over USD 60 billion.
Military Transport Industry Leaders
-
Lockheed Martin Corporation
-
The Boeing Company
-
BAE Systems plc
-
Airbus SE
-
Oshkosh Defense, LLC (Oshkosh Corporation)
- *Disclaimer: Major Players sorted in no particular order
Military Transport Market Companies Covered in this Report
- Airbus SE
- The Boeing Company
- Lockheed Martin Corporation
- Rostec
- Embraer S.A.
- Leonardo S.p.A.
- Kawasaki Heavy Industries, Ltd.
- Tata Advanced Systems Limited
- Rheinmetall AG
- Oshkosh Defense, LLC (Oshkosh Corporation)
- BAE Systems plc
- General Dynamics Corporation
- Textron Inc.
- Hyundai Rotem Company
- Israel Aerospace Industries Ltd.
- ANTONOV COMPANY (State Concern "Ukroboronprom")
- ND Defense LLC
- Iveco Defence Vehicles (Iveco Group)
Market Opportunities and Future Outlook
A major opportunity centers on fleet-life extension and digital modernization packages for legacy strategic and tactical airlift, where buyers are setting longer sustainment horizons and refresh cycles. The US Air Force Airlift Recapitalization Strategy references keeping the C-5M operational through about 2045 and the C-17A through 2075, while also outlining Next-Generation Airlift (NGAL) planning toward an initial operational capability in FY2041. Together, these timelines support near-to-mid-term demand for avionics refresh, mission computing, training systems, and predictive maintenance across existing fleets, even as long-range replacement concepts progress.
Another whitespace is the expansion of modular, palletized capabilities that turn transport assets into multi-mission platforms, creating incremental demand for containerized launch, command-and-control, and onboard power and data management. Work by BAE Systems and Lockheed Martin on the Blizzard modular uncrewed air system concept, including release from transport aircraft such as the A400M and C-130, supports the shift toward add-on payload ecosystems that can scale without new airframe buys. On the naval side, the US Navy's move to a Vessel Construction Manager model for the Medium Landing Ship program, combined with the USD 2.2 billion TOTE Services prime award, points to active procurement pathways where suppliers of ship modules, connectors, and logistics handling systems can attach to new-build sealift programs tied to dispersed and littoral operations.
Recent Industry Developments in Military Transport Market
- May 2026: Lockheed Martin and Canadian authorities signed two contract amendments for CC-130J Hercules in-service support and RCAF 105 upgrades, valued at USD 462.5 million and USD 684.3 million respectively. This strengthens Canada\'s heavy-lift sustainment program and expands multi-year maintenance and upgrade commitments for regional airlift capability. The actions broaden the maintenance ecosystem and support readiness tooling for key military transport assets.
- April 2026: The Boeing Company deployed the Aircraft Data Reasoner predictive maintenance system to enhance C-17A fleet readiness. The deployment advances predictive health monitoring across a major transport fleet and demonstrates MOSA aligned modernization of heavy-lift aviation. By reducing unscheduled downtime and extending asset life, the program improves mission-capable rates and lifecycle efficiency.
- March 2026: Lockheed Martin secured up to USD 1.9 billion contract for C-130J training systems. The contract expands training and readiness capabilities for the C-130J fleet and reinforces long-term sustainment through enhanced instruction and simulators. This strengthens the supply chain for training, helping personnel readiness align with ongoing modernization targets.
Military Transport Market Report Scope and Research Methodology
Market Definition and Coverage
For this study, the military transport market covers defense-focused platforms and systems used to move troops, equipment, and supplies across land, sea, and air, including acquisition, upgrades, and related integration that directly supports transport missions.
Scope exclusions: We exclude civilian logistics assets used only under commercial contracts, and we do not count general base infrastructure or non-transport combat systems.
Segments Covered in This Report
- By Platform Type
- Ground Transport Vehicles
- Heavy Tactical Trucks
- Light Utility Vehicles
- Armored Logistics and MRAPs
- Naval Transport Vessels
- Roll-on/Roll-off (Ro-Ro) and Sealift Ships
- Landing Platform Docks (LPD/LHD)
- Auxiliary Cargo and Replenishment Ships
- Air Transport Aircraft
- Fixed-Wing
- Rotary and Tilt-Rotor
- Ground Transport Vehicles
- By Application
- Personnel Transport
- Cargo/Equipment Transport
- Emergency Rescue and Medevac
- Humanitarian and Disaster-relief
- By Propulsion Technology
- Conventional
- Hybrid-Electric
- Others
- By End User
- Army
- Navy
- Air Force
- By Geography
- North America
- United States
- Canada
- Mexico
- Europe
- United Kingdom
- France
- Germany
- Spain
- Russia
- Rest of Europe
- Asia-Pacific
- China
- India
- Japan
- South Korea
- Australia
- Rest of Asia-Pacific
- South America
- Brazil
- Rest of South America
- Middle East and Africa
- Middle East
- Saudi Arabia
- United Arab Emirates
- Rest of Middle East
- Africa
- South Africa
- Rest of Africa
- Middle East
- North America
Data Sources, Market Sizing, and Validation
Desk Research
We start with publicly available defense demand signals and fleet context, because transport spending links to readiness needs and recapitalization cycles. Sources used include items such as government budget documents and procurement portals, SIPRI defense spending databases, NATO capability publications, and UN Comtrade trade statistics for relevant vehicle and aircraft categories.
To convert those signals into sizing inputs, we also reference manufacturer annual reports, investor presentations, and reputable defense press for program timing, delivery lots, and modernization roadmaps. Where available, paid subscriptions for company financials and contracts and tenders are used to cross-check awards and contract values before assumptions are set in the model. The examples listed above are illustrative only, and we reviewed many other sources for data collection, validation, and clarification.
Primary Interviews and Surveys
Primary work was used to pressure-test areas that desk sources cannot fully explain, such as realized pricing versus announced contract ceilings and how upgrade content shifts over time. We spoke with a mix of defense procurement and sustainment stakeholders, platform engineering and program roles, and channel participants involved with transport platforms across the major regions, so our assumptions reflect how programs are executed in practice.
Distribution of primary research fieldwork respondents
| Company type | Respondent position | Region |
|---|---|---|
| Top tier: 33% | CXOs: 14% | APAC: 47% |
| Mid tier: 48% | Functional/Unit leaders: 27% | EMEA: 32% |
| Smaller Players: 19% | Managers: 59% | Americas: 21% |
Market-Sizing & Forecasting
Sizing is built using a top-down approach where defense procurement plans, fleet replacement cycles, and program-level demand are reconstructed into platform spend across ground, naval, and air transport. Then we corroborate totals with selective bottom-up checks, including sampled contract values, observed delivery volumes, and a verified average selling price (ASP) by platform class, and we adjust where the two views do not align.
Inputs that matter most include announced and awarded transport procurements, planned fleet recapitalization timelines, upgrade penetration for avionics and mission systems, delivery schedules tied to production capacity, and inflation and foreign exchange treatment for multi-year contracts. For forecasting, scenario analysis is used because defense transport demand is lumpy, and it is shaped by budget cycles, geopolitical events, and platform availability, which do not move smoothly year to year. Where a program has incomplete public detail, gaps are handled using comparable platform benchmarks, validated by interview feedback, and then applied conservatively until better evidence is available.
Data Validation & Update Cycle
We validate outputs by checking internal consistency across program totals, country-level defense budgets, and observed award and delivery patterns, and then we investigate any outliers that break those relationships. Results go through multi-step analyst reviews, and re-contact is triggered when a large contract, cancellation, or delivery slip changes the year-by-year shape.
Reports refresh annually, with interim updates when material events occur, such as major award announcements or shifts in procurement calendars. Before delivery, an analyst performs a fresh pass on key variables so clients receive the most current view while still following the same repeatable steps.
Mordor Intelligence's Military Transport Market Estimate Compared With Other Published Estimates
Published market sizes for military transport often vary because analysts make different choices on what to count as transport, how they time multi-year awards, and how they handle pricing changes across platforms. We keep the process transparent by tying totals back to program activity and fleet needs, and then cross-checking with what buyers and suppliers report in interviews.
A common gap driver is timing and price logic. Some figures take contract ceilings at award date, while others convert currencies using a single-year rate and treat upgrades as full new builds. By updating FX timing and ASP steps around delivery schedules and re-checking anomalies after large awards, the estimate stays closer to the spend that actually lands in-year, a refresh choice applied by Mordor Intelligence.
Benchmark comparison
| Source | Market Size | Gaps in Research Methodology |
|---|---|---|
| Mordor Intelligence | USD 22.79 B (2025) | |
| Global Consultancy A | USD 20.60 B (2025) | Uses conservative procurement conversion by relying on budget allocations only, which can miss funded contract modifications and upgrade packages that are booked outside initial line items. |
| Industry Association B | USD 25.90 B (2025) | Folds broader defense logistics and support services into transport, and applies blended pricing growth that can overstate year-specific spend for big-ticket airlift platforms. |
The spread mainly comes from what is treated as transport spending, and from how award values, upgrades, and currency timing are translated into a single-year USD total. Our approach aims to keep the number traceable to observable program activity and repeatable checks, so decision-makers can understand what is inside the total and why it moves year to year.
Key Questions Answered in the Report
What is the current size and 2031 forecast for the military transport market?
The military transport market size is USD 24.14 billion in 2026 and is projected to reach USD 32.23 billion by 2031, reflecting a 5.92% CAGR.
Which platform category will grow fastest to 2031?
Ground vehicles are forecasted to expand at a 9.52% CAGR as hybrid-electric drivetrains and AI diagnostics enter tactical trucks.
Why is humanitarian transport demand rising?
Increased natural disasters and conflict zones require rapid aid delivery; recent Gaza pier and Indian evacuation missions highlight this trend.
Which region offers the highest growth opportunity through 2031?
Asia-Pacific leads with a 7.18% CAGR, driven by Chinese, Japanese and South Korean modernization programs.
What propulsion technology is attracting the most investment?
Hybrid-electric systems are advancing at a 10.63% CAGR as they improve stealth and fuel efficiency across land, air and sea platforms.