
Military Fiber Optic Cables Market Size and Share
Market Overview
| Study Period | 2020 - 2031 |
|---|---|
| Market Size (2026) | USD 4.09 Billion |
| Market Size (2031) | USD 5.77 Billion |
| Growth Rate (2026 - 2031) | 7.12 % |
| Fastest Growing Market | Asia Pacific |
| Largest Market | North America |
| Market Concentration | Low |
Major Players *Disclaimer: Major Players sorted in no particular order Image © Mordor Intelligence. Reuse requires attribution under CC BY 4.0. | |
Military Fiber Optic Cables Market Analysis by Mordor Intelligence
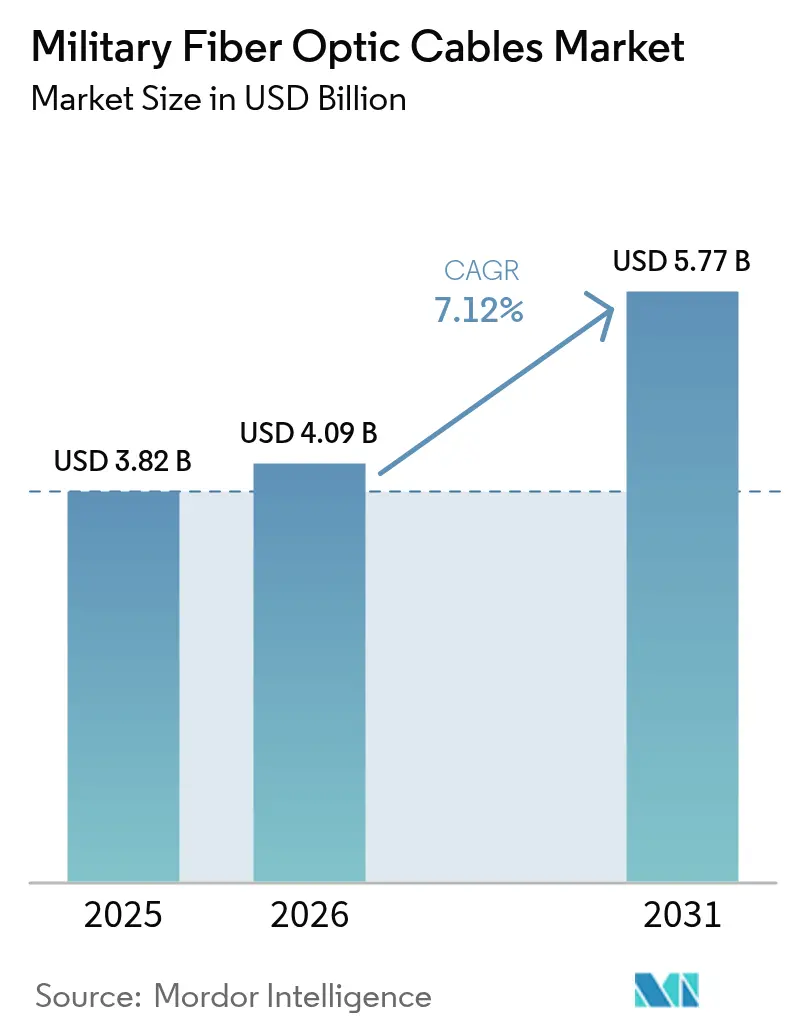
military fiber optic cables market size in 2026 is estimated at USD 4.09 billion, growing from 2025 value of USD 3.82 billion with 2031 projections showing USD 5.77 billion, growing at 7.12% CAGR over 2026-2031. Growth reflects the swift replacement of copper links with fiber solutions that withstand electromagnetic interference while carrying far higher data loads. Investments in fiber-optic drones, directed-energy weapons, and 5G-enabled tactical networks are reshaping battlefield connectivity, prompting armies to refit legacy platforms with high-bandwidth optical backbones. Defense ministries also view fiber as a hedge against jamming and cyber risks, since light-based signals resist interception and radiate no electromagnetic signature. Procurement spending is further supported by multi-domain sensor fusion programs that push data rates above 100 Gbps on ships, vehicles, and aircraft.
Key Report Takeaways
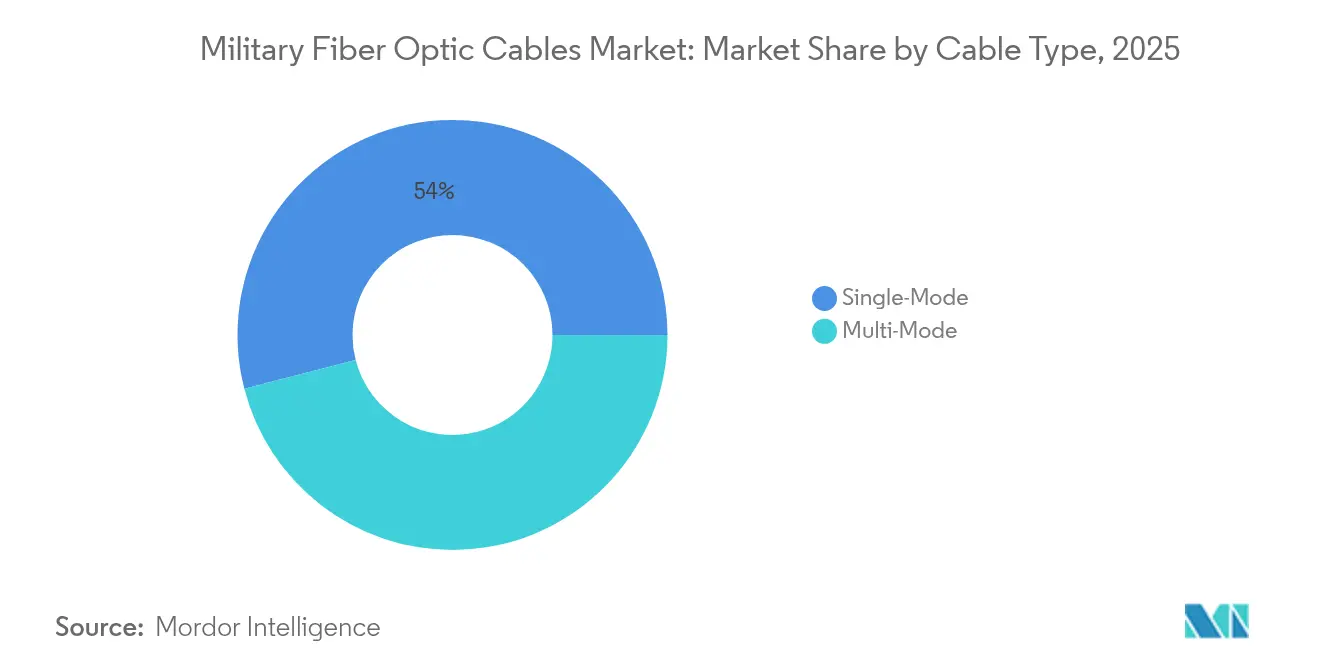
- By cable type, single-mode fiber led with 54.02% of the military fiber optic cables market share in 2025; multi-mode is forecasted to grow at an 8.43% CAGR through 2031.
- By material, glass fiber accounted for 90.10% share of the military fiber optic cables market size in 2025, while plastics show a 10.02% CAGR outlook to 2031.
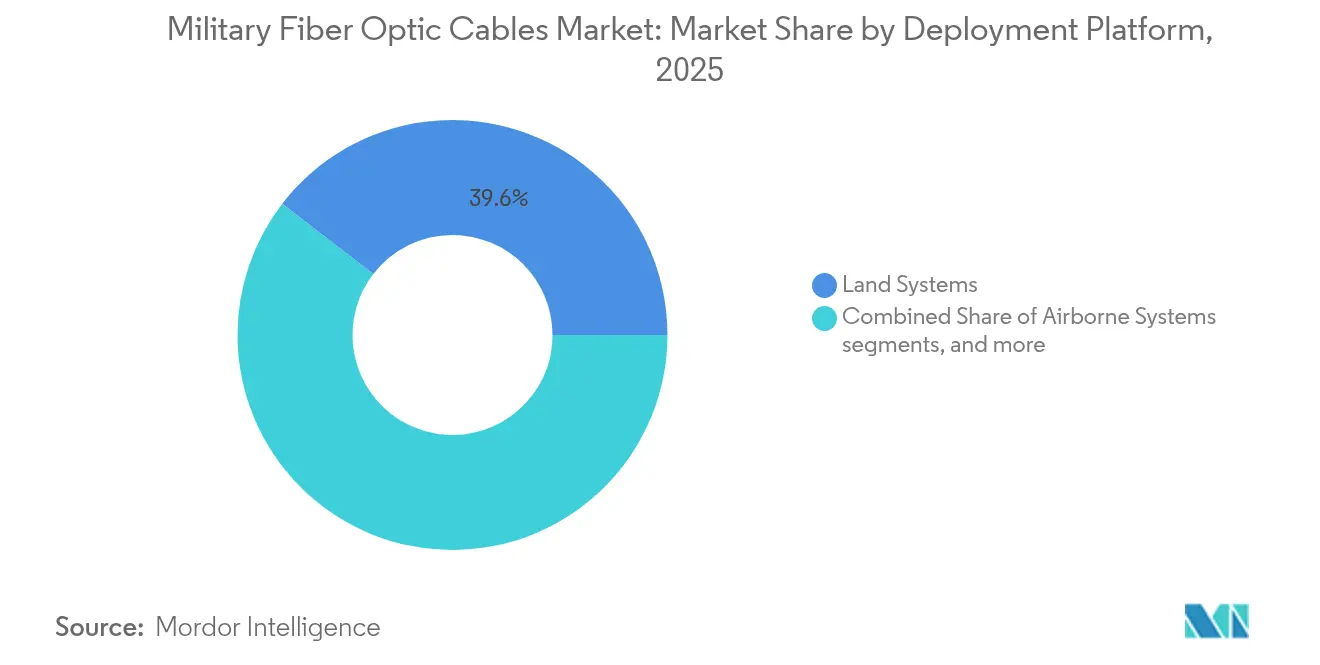
- By deployment platform, land systems captured 39.55% of 2025 revenue; naval and sub-sea assets are set to advance at a 10.01% CAGR to 2031.
- By installation environment, harsh-environment armored cables held a 42.10% share in 2025; underwater installations are projected to expand at a 9.76% CAGR.
- By application, C3ISR represented 42.25% revenue in 2025; directed-energy weapons are advancing at an 11.05% CAGR through 2031.
- By geography, North America commanded 34.10% of 2025 revenue, while Asia-Pacific posts the fastest 9.05% CAGR to 2031.
Note: Market size and forecast figures in this report are generated using Mordor Intelligence’s proprietary estimation framework, updated with the latest available data and insights as of 2026.
Market Trends and Insights
Drivers Impact Analysis of Military Fiber Optic Cables Market*
| Driver | (~) % Impact on CAGR Forecast | Geographic Relevance | Impact Timeline |
|---|---|---|---|
| Battlefield demand for loss-less, EMI-immune data links | +2.1 | Global, with concentration in active conflict zones and NATO countries | Short term (≤2 yrs) |
| Militarisation of 5G tactical networks | +1.8 | North America, Europe, advanced Asia-Pacific militaries | Medium term (≈3-4 yrs) |
| Surge in ISR sensor density | +1.2 | Global, with emphasis on naval and airborne platforms | Medium term (≈3-4 yrs) |
| Directed-energy weapons integration | +1.9 | North America, advanced Asia-Pacific militaries | Long term (≥5 yrs) |
| Miniaturised rugged fiber terminations | +0.8 | Global, with higher impact in technologically advanced militaries | Medium term (≈3-4 yrs) |
| NATO STANAG shift towards fiber-centric avionics architectures | +1.4 | NATO member countries, with spillover to strategic allies | Medium term (≈3-4 yrs) |
| Source: Mordor Intelligence | |||
Battlefield demand for loss-less, EMI-immune data links
Electronic warfare has saturated modern battlefields, so fiber-optic lines now replace copper to keep signals intact under jamming. Ukrainian forces operate fiber-tethered FPV drones that penetrate 41 km while streaming high-resolution video unaffected by interference. NATO planners observed these results, and the US Army plans 1,100 similar systems to close capability gaps.[1] These combat-proven accelerators accelerate the procurement of rugged micro-fiber reels and quick-deploy connectors for squads and command posts. The military fiber optic cables market benefits directly as each drone uses multi-kilometre spools and replacement kits that must meet MIL-spec pull and bend limits. Demand is reinforced by national mandates to harden forward bases against electronic attack.
Militarisation of 5G tactical networks
Private 5G roll-outs at bases in the United States, Spain, Germany, and Norway depend on dense fiber backhaul that handles multi-gigabit traffic while meeting strict latency and security targets. Spending on defence 5G infrastructure will total USD 1.5 billion during 2024-2027, with roughly one-third flowing to optical cabling and terminations. Programs adopt Open RAN interfaces, so suppliers must certify fibers for diverse radio units and edge clouds. The military fiber optic cables market thus gains sustained orders for single-mode trunk lines, field-deployable indoor/outdoor patch cords, and hardened MPO connectors able to survive fuel spills and vehicle loads.
Surge in ISR sensor density
Modern destroyers, fighters, and armored vehicles now host dozens of cameras, lidars, and passive RF arrays that create multi-terabyte data streams. The US Navy replaced legacy copper on AEGIS cruisers with ship-wide fiber rings after proving they survive vibration, flooding, and shock.[2] Each hull requires thousands of fiber terminations and watertight penetrators, creating a sizeable retrofit market. Similar upgrades appear on airborne early-warning aircraft and wide-area persistent-surveillance drones. As sensor counts rise, operators adopt 100 Gbps Ethernet over OM4 fiber to avoid bottlenecks. The military fiber optic cables market responds with bend-insensitive cores and low-smoke, zero-halogen jackets that comply with naval fire codes.
Directed-energy weapons integration
Fiber lasers stand out for shipborne and ground-based high-energy systems because they deliver excellent beam quality and 40%-plus wall-plug efficiency. Researchers demonstrated coherent beam combining that scales to 100 kW output, paving the way for drone and missile defence modules. These weapons drive demand for specialty fibers doped with erbium or ytterbium, tight-tolerance cleaves, and high-photon-flux connectors. Program offices specify fibers resistant to photodarkening and capable of moving hundreds of watts through small cores without thermal runaway. Suppliers that master these qualifications capture premium margins within the military fiber optic cables market.
Restraints Impact Analysis of Military Fiber Optic Cables Market*
| Restraint | (~) % Impact on CAGR Forecast | Geographic Relevance | Impact Timeline |
|---|---|---|---|
| Field-level repair complexity | -0.9% | Global, remote deployments | Short term (≤ 2 years) |
| Supply chain security vulnerabilities | -1.5% | North America, Europe | Medium term (2-4 years) |
| High lifecycle cost vs copper | -0.5 | Emerging markets and budget-constrained militaries | Short term (≤2 yrs) |
| Vulnerability to bend-loss | -0.4 | Global, with emphasis on land-based armored vehicles | Short term (≤2 yrs) |
| Source: Mordor Intelligence | |||
Field-level repair complexity
Splicing fibers in remote combat zones is labour-intensive and tool-heavy, so cut lines can idle critical sensors. Military trials “crimp & cleave” connectors that install in under three minutes, trading 0.5 dB extra loss for rapid restoration. Training backlogs persist, and shortages of certified technicians slow large-scale roll-outs. Vendors answer with pre-terminated reels and colour-coded boots that reduce human error. While these advances ease the issue, the military fiber optic cables market still faces delayed contracts until armies field enough maintenance teams.
Supply chain security vulnerabilities
Rare-earth doped preforms and radiation-hardened fibers fall under ITAR controls that complicate global sourcing.[3] Geopolitical tensions heighten scrutiny of suppliers, leading to dual-sourcing strategies and higher certification costs. Researchers also warned that adversaries can tamper with optical timing links over hundreds of kilometres, altering frequency references without detection.[4] Procurement agencies now request provenance audits and tamper-evident seals, adding time and expense. These hurdles trim forecast growth for the military fiber optic cables market during the medium term.
*Our forecasts treat driver/restraint impacts as directional, not additive. The impact forecasts reflect baseline growth, mix effects, and variable interactions.
Military Fiber Optic Cables Market Segment Analysis
By cable type – Single-mode fibers anchor long-haul missions
Single-mode lines command the largest military fiber optic cables market share at roughly 54.02% in 2025 and are forecast to maintain a mid-single-digit CAGR through 2031. Their narrow core enables ultra-long links on destroyers, airborne early warning aircraft, and underground fiber trunks interconnecting forward operating bases. A useful consequence is that each single-mode run often carries spare dark fibers, creating latent capacity that future-proofs the investment.
Second, multi-mode occupies a smaller slice today, yet is predicted to outpace overall market growth with an 8.43% CAGR. Cost-effective transceivers, tolerance of wider launch conditions, and recent breakthroughs in radiation-hard multimode fiber suggest wider deployment inside armored vehicles and aircraft cabins. This uptick implies that vendors offering hybrid cable bundles—combining both core types—gain a commercial edge by simplifying logistics for integrators.

By material – Glass fibers remain dominant
Glass commands about 90.10% of the military fiber optic cables market, thanks to its unmatched bandwidth and robustness. Naval architects favour glass for topside and below-decks runs because its thermal window aligns with maritime shock standards. The inferred benefit for suppliers is volume stability: fleet refit cycles assure ongoing demand independent of new-build schedules.
Plastic optical fiber (POF) may hold less than a tenth of the market value, but it is advancing at roughly 10.02% CAGR owing to flexibility and quick field termination. Embedded wear sensors in bearings and hatch seals illustrate niche yet recurring orders. POF’s progress suggests that a diversified materials portfolio gives contractors a hedge against glass-specific geopolitical supply risks.
By deployment platform – Land systems dominate through sheer volume
Land systems account for an estimated 39.55% share of the military fiber optic cables market size in 2025. Army digitisation projects swap copper harnesses for lighter, interference-free fiber, shaving kilograms from weight-constrained vehicles. A direct implication is that every kilogram saved can be re-allocated to armor or battery capacity, reinforcing the preference for optical links.
Naval and subsea platforms are forecast to log the fastest CAGR of 10.01% between 2026 and 2031. Rising concern over seabed-based infrastructure protection triggers investments in hardened undersea cables and autonomous monitoring nodes. Consequently, shipyards increasingly specify armored optical cables at keel-laying rather than the retrofit stage, anchoring future growth.
By installation environment – Armored designs lead sales
Harsh-environment armored cables now hold roughly 42.10% of the military fiber optic cables market share. High-density braid jackets, crush-resistant buffers, and low-smoke coatings enable reliable performance in exploding-wire test rigs and arctic deployments. The practical upshot is that lessons learned here spill into civilian disaster-relief kits, broadening the addressable market for the same rugged designs.
Underwater and submarine installations are projected to notch the highest CAGR, nudging 9.76% through 2031. Long-haul seabed links sustain autonomous sensor nets that flag unauthorised vessel activity. This surge implies that anti-tamper enclosures and real-time integrity-monitoring fibers will emerge as must-have accessories, adding incremental revenue streams for established cable manufacturers.
By application – C3ISR forms the backbone
C3ISR represents roughly 42.25% of the military fiber optic cables market. Network architects value fiber's immunity and capacity when fusing radar, SIGINT, and hyperspectral camera inputs. The immediate corollary is that optical-first design principles move upstream into platform concept phases, locking in fiber costs well before production.
Directed-energy weapons exhibit the steepest growth curve, with a projected 11.05% CAGR. Successful shipboard demonstrations have cemented confidence that fiber lasers can track and neutralise swarms of low-cost drones. Given power-in-aperture needs, every incremental watt of beam power drives additional demand for high-purity, large-mode-area fibers, expanding total military fiber optic cables industry revenue by design.
Geography Analysis
North America Military Fiber Optic Cables Market
North America retained 34.10% revenue in 2025 due to sustained defense budgets and technology leadership. Programs such as the 1,100-unit fiber drone rollout highlight how procurement scales quickly once performance is proven. Research at national laboratories advances coherently combined lasers and bend-insensitive, rugged fibers, securing the region’s technical edge. The military fiber optic cables market size in North America further widens as each new platform standardises on optical backbones.
APAC Military Fiber Optic Cables Market
Asia-Pacific records the fastest 9.05% CAGR to 2031 as India, Japan, South Korea, and Australia step up modernisation. India’s Network For Spectrum contracts worth USD 207 million cover 57,015 km of fiber builds. Regional carriers partner on the ALPHA cable that offers 18 Tbps per pair, giving navies resilient routes. Defense ministries invest in 5G-backed training ranges that depend on dense optical fronthaul. These initiatives raise the military fiber optic cables market profile across the region.
Europe Military Fiber Optic Cables Market
Europe maintains solid demand, led by NATO projects that secure undersea infrastructure and cross-border land routes. The Baltic Sentry mission uses naval drones to patrol pipelines and cables, triggering orders for impact-proof fiber bundles. Sweden and Finland opened a SEK 75 million (USD 7.8 million) three-cable land corridor able to carry 3 Pbps, reinforcing regional resilience. As EU forces converge on common architectures, suppliers with pan-European approvals gain share in the military fiber optic cables market.

Regulatory Landscape
Military fiber optic cables are shaped primarily by defense qualification regimes and performance specifications that determine what can be procured and integrated into platforms. In the United States, procurement eligibility for cables and connectors is anchored in MIL-PRF and MIL-DTL documents managed through the Defense Logistics Agency (DLA) Land and Maritime system, including MIL-PRF-85045 for general fiber optic cable requirements and MIL-DTL-83526 for fiber optic connector designs, with supplier access commonly controlled via the Qualified Products List (QPL) process.
In Europe, defense and aerospace fiber optic standardization is influenced by bodies such as CEN/ASD-STAN (for example, FprEN 4641-001 for optical cables used in defense and aviation environments) and space-grade component governance under ESA ESCC detail specifications. A recent anchor is the February 2026 update (Issue 6) of ESCC 3420/001 for optical fibre cable assemblies based on Mini and MIDI AVIM ferrules, which reinforces compliance-driven design and qualification pathways for suppliers serving high-reliability military and adjacent aerospace programs.
Value Chain Analysis
The value chain begins with preform and specialty glass inputs, including rare-earth dopants for laser and specialty fibers, followed by fiber draw and cabling into rugged constructions such as armored, shipboard, and underwater or submarine applications that align with military specifications such as MIL-PRF-85045. After that, work typically shifts to connectorization and termination (including expanded beam and circular or rectangular families), harness assembly, and qualification testing to MIL-STD environments (shock, vibration, immersion), before platform integrators bring the assemblies into land vehicles, aircraft, naval vessels, and fixed defense installations.
Government contracting and qualification gatekeeping influence downstream distribution and purchasing. DLA-managed listings and service parts ecosystems, including Navy recommended component lists, affect which parts are fielded and replenished, while framework buys and BPAs consolidate spend among pre-qualified manufacturers. Supply chain security has tightened across the chain, with heightened scrutiny of provenance for optical materials and specialty fibers, and procurement documentation increasingly requiring traceability and source verification alongside MIL-spec compliance.
Competitive Landscape
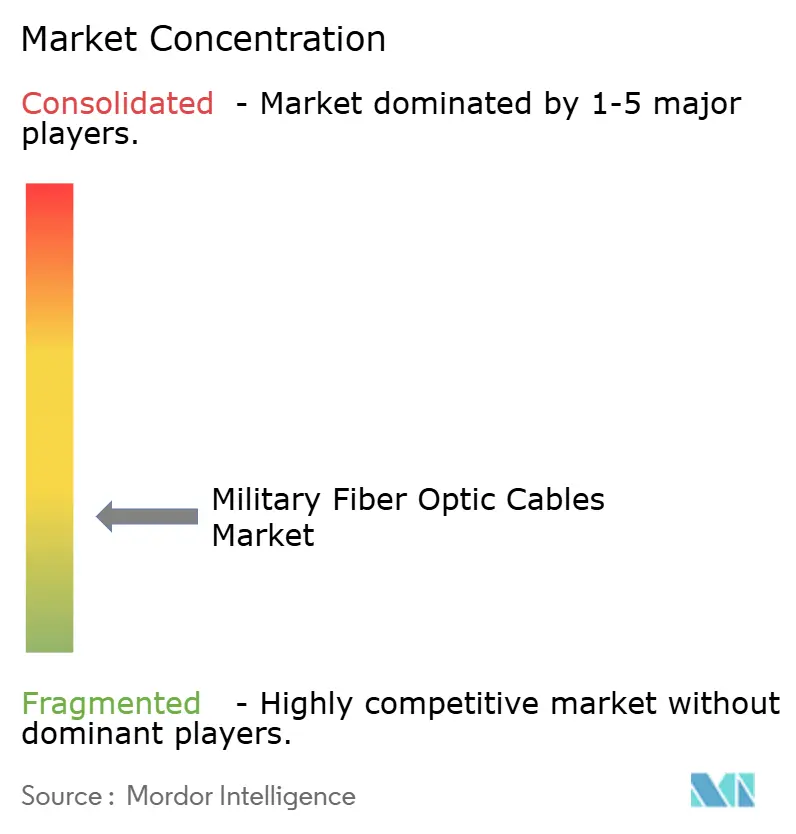
The market is moderately fragmented. Specialist defense cable makers compete with diversified telecom groups that formed dedicated defense divisions. Firms differentiate by certifying products to MIL-DTL-38999 connector mates, shock levels under MIL-STD-810, and high-pressure immersion. Partnerships with prime contractors are critical because optical harnesses integrate deeply into platform architectures. Recent agreements link cable suppliers with avionics, radar, and laser integrators to co-design turnkey assemblies.
Technical innovation is a core lever. W. L. Gore & Associates markets 100 Gbps-rated cable that survives 10,000 flex cycles on combat vehicles while staying under 0.5 dB loss.[6]Competitors explore hermetic expanded-beam termini that clean with a simple wipe and reconnect in seconds. Vendors also add traceability chips that store lifetime bend data to predict failure before mission impact. Such features help win multi-year framework agreements and lift customer switching costs, sustaining margins across the military fiber optic cables market.
Vertical integration is gaining pace. Some fiber producers acquire connector shops and termination houses to offer full harness kits, slashing lead times and simplifying liability. Others invest in radiation test labs to certify batches in-house. These moves improve supply security, counterfeiting control, and customer confidence at a time when tampering risks attract headline attention. The resulting ecosystem raises the entry bar, concentrating value among firms with broad process capabilities.
Military Fiber Optic Cables Industry Leaders
-
Prysmian S.p.A.
-
OFS Fitel, LLC
-
Sumitomo Electric Industries, Ltd.
-
Optical Cable Corporation
-
Gooch & Housego PLC
- *Disclaimer: Major Players sorted in no particular order
Military Fiber Optic Cables Market Companies Covered in this Report
- Prysmian S.p.A.
- OFS Fitel, LLC
- Lynxeo SAS
- Sumitomo Electric Industries, Ltd.
- Optical Cable Corporation
- Corning Incorporated
- Gooch & Housego PLC
- Timbercon, Inc.
- W. L. Gore & Associates, Inc.
- Infinite Electronics, Inc.
- Sterlite Technologies Limited
- TE Connectivity plc
- L3Harris Technologies, Inc.
- Amphenol Corporation
- Radiall LLC
- Rosenberger Hochfrequenztechnik GmbH & Co KG
- Cinch Connectivity Solutions, Inc.
- Fujikura Ltd.
- Leoni AG
- Yangtze Optical Fibre and Cable Joint Stock Limited Company
Market Opportunities and Future Outlook
Source-verified and domestically traceable optical components are emerging as a direct route to commercialization as defense buyers tighten provenance requirements for optical materials and assemblies. Patton Electronics’ June 2026 subcontract award to develop source-secure fiber optic transport modules for US defense applications, using US-made, source-verified components, illustrates this trend and supports near-term whitespace for cable and connectivity suppliers that can document compliant bills of material, qualify to relevant MIL specifications, and support audit requirements across sub-tier sourcing.
Platform-side modernization continues to drive pull-through demand for rugged cabling and terminations as fiber displaces copper for EMI immunity and higher bandwidth, especially in tactical networks and unmanned systems operating in contested electronic warfare. L3Harris disclosed May 2026 capital expenditure tied to fiber-optic programs and the activation of a second production line for fiber-optic tether systems at Palm Bay, Florida by Q1 2026, highlighting a scaling requirement that benefits suppliers of deployable spools, lightweight rugged jackets, and field-repairable terminations. On the procurement side, active US Navy BPAs for fiber optic supplies and services and AFRL postings for integrated optical cable assemblies aligned to 1550 nm laser systems point to contracting channels where qualified cable makers can expand share through rapid delivery, MIL-spec compliance, and secure supply chains.
Recent Industry Developments in Military Fiber Optic Cables Market
- June 2026: Patton Electronics announced it was awarded a subcontract to develop source-secure fiber optic transport modules for US defense applications using US-made, source-verified components. The award reinforces procurement momentum around provenance and trusted sourcing for optical connectivity, tightening requirements on upstream cable and component suppliers supporting defense networks.
- March 2025: Furukawa Electric unified its global optical fiber cable business, including OFS Fitel, LLC, under the new brand name Lightera. The consolidation streamlines go-to-market and operations across a major supplier footprint, supporting scale advantages in qualified fiber and cable supply for defense and aerospace programs.
- June 2024: Safran Electronics & Defense unveiled a laser optical communication solution for armed forces with claimed throughput spanning 5 Gbps to 50 Gbps. Higher-rate optical links on military platforms increase demand for low-loss, ruggedized fiber cabling and precision terminations that maintain performance under vibration, shock, and harsh environmental exposure.
Military Fiber Optic Cables Market Report Scope and Research Methodology
Market Definition and Coverage
This market covers fibre optic cable assemblies and related cable products that are purpose-built for military use, where ruggedization, shielding, and defense-grade qualification are needed to move data or sensing signals in harsh environments.
Scope exclusions: Civil telecom backbone and metro or last-mile fiber rollout projects, plus purely consumer data networking cables, are not counted in this sizing.
Segments Covered in This Report
- By Cable Type
- Single-mode
- Multi-mode
- By Material Type
- Glass Optical Fiber
- Plastic Optical Fiber
- Deployment Platform
- Land Systems
- Airborne Systems
- Naval and Sub-sea Systems
- By Installation Environment
- Tactical Field-Deployable
- Harsh-Environment Armored
- Under-water / Submarine
- By Application
- C3ISR and Tactical Communications
- Radar and Electronic Warfare
- Guided and Directed-Energy Weapons
- On-board Data Networks / Avionics
- Others (Power-over-Fiber, Sensors)
- By Geography
- North America
- United States
- Canada
- Mexico
- South America
- Brazil
- Rest of South America
- Europe
- United Kingdom
- Germany
- France
- Italy
- Russia
- Rest of Europe
- Asia-Pacific
- China
- India
- Japan
- Singapore
- Rest of Asia-Pacific
- Middle East and Africa
- Middle East
- Israel
- United Arab Emirates
- Rest of Middle East
- Africa
- South Africa
- Rest of Africa
- Middle East
- North America
Data Sources, Market Sizing, and Validation
Desk Research
Desk research was used to build the base structure of the market model and to lock in the terminology used in defense cable procurement. We reviewed public sources such as defense procurement portals and contract award notices, government trade and customs statistics for optical fiber cable categories, and defense standard references that indicate qualification and test requirements.
To keep the logic tied to real demand, we also relied on defense budget documents and parliamentary or congressional releases on modernization programs, alongside association and standards body publications on fiber optics and cabling. In addition, we screened company filings, investor presentations, and trusted press to understand capacity moves and program exposure, and we selectively used paid subscriptions for company financials and patent databases where it helped confirm product focus. These are illustrative sources only, and we also checked many other references to fill gaps, validate data points, and clarify assumptions.
Primary Interviews and Surveys
Primary work focused on conversations and surveys with defense supply chain participants such as cable and harness suppliers, platform integrators, and procurement or engineering teams that specify cable requirements. For a global view, inputs were compared across APAC, EMEA, and the Americas, so program timing, qualification lead times, and pricing behavior could be checked against each other and reflected in our assumptions.
Distribution of primary research fieldwork respondents
| Company type | Respondent position | Region |
|---|---|---|
| Top tier: 35% | CXOs: 13% | APAC: 42% |
| Mid tier: 51% | Functional/Unit leaders: 34% | EMEA: 33% |
| Smaller Players: 14% | Managers: 53% | Americas: 25% |
Market-Sizing & Forecasting
Sizing starts with a top-down build that translates defense platform and network modernization activity into a cable demand pool, and then applies adoption and content assumptions for fiber assemblies used in those systems. After that structure is in place, selective bottom-up checks are run using supplier and channel signals, along with sampled price per meter or price per assembly ranges, so totals can be adjusted where the first pass looks off.
Key model inputs include active and planned platform upgrade cycles, procurement timing from contract pipelines, typical cable content by platform and subsystem, mix shifts between single-mode and multimode needs, ruggedization and connectorization intensity, and material and manufacturing cost pressures that influence average selling price. Where direct volume signals are thin, gaps are handled by using proxy indicators such as program counts and installation density, followed by confirmation from subject-matter experts.
Forecasts are built using scenario analysis tied to defense spending direction and program schedules, and the assumptions are stress-tested with interview feedback on delivery lead times and qualification cycles. Growth rates are applied with clear year-by-year logic so the forecast can be reproduced and updated as new program announcements appear.
Data Validation & Update Cycle
Outputs are cross-checked against independent signals such as defense procurement activity, observed pricing movement, and regional modernization pace, so the numbers remain realistic. If a region or year shows an unusual jump, the drivers are rechecked and supporting assumptions are revisited before sign-off.
A multi-step review is followed, where calculations are reviewed by another analyst and any large variances are traced back to the underlying inputs. Reports are refreshed annually, and interim updates are triggered when material events occur, such as major contract wins, program delays, or policy changes. Before delivery, a final check is completed so clients receive the latest updated view we can support.
Mordor Intelligence's Military Fibre Optic Cables Market Size Versus Other Published Estimates
It is normal to see different market size figures for this topic because publishers do not always count the same cable scope, platforms, and qualification levels. Differences also come from the year used, the pricing logic applied to ruggedized assemblies, and how quickly assumptions are refreshed when procurement plans shift.
Some estimates widen the lens by mixing in commercial and space end uses or by counting broader aerospace and defense cabling spend that is not strictly military qualified. In Mordor Intelligence's model, only defense-grade fibre optic cable products tied to military platforms and installations are counted, and civil telecom buildouts and other adjacent cabling pools are kept out, which changes the total even when growth direction looks similar.
Benchmark comparison
| Source | Market Size | Gaps in Research Methodology |
|---|---|---|
| Mordor Intelligence | USD 4.09 B (2026) | |
| Global Consultancy A | USD 1.39 B (2025) | Uses a different base year and a broader end-use split that includes commercial and space categories, which can dilute the military-only spend pool and reduce the stated value for a given year. |
| Industry Publisher B | USD 1.80 B (2024) | Anchors sizing to an earlier year and appears to apply higher-level adoption and price growth assumptions without separating qualification-driven assemblies from more general defense networking cable demand. |
Taken together, the spread mostly reflects scope and timing, not just math. When the counted demand pool is kept tied to military-qualified cable products and checked against program activity and price ranges, the resulting value is easier to trace and update as procurement signals change.
Key Questions Answered in the Report
What is the current size of the Military Fiber Optic Cables market?
The market is valued at USD 4.09 billion in 2026 and is projected to reach USD 5.77 billion by 2031, registering a 7.12% CAGR.
Which region holds the largest share of the Military Fiber Optic Cables market?
North America leads with 34.10% revenue in 2025, driven by sustained defence budgets and rapid technology adoption.
Which segment is growing fastest within the Military Fiber Optic Cables market?
Directed-energy weapons applications show the highest 11.05% CAGR as fiber lasers move toward operational deployment.
Why are single-mode fibers preferred for military backbones?
Single-mode fibers deliver low attenuation over tens of kilometres, resist electromagnetic interference, and support bandwidth beyond 100 Gbps, making them ideal for naval and strategic networks.
What are the main restraints facing the Military Fiber Optic Cables market?
Field-level repair complexity and supply chain security vulnerabilities slow adoption by increasing maintenance burdens and compliance costs.
How are 5G tactical networks impacting demand for military fiber optics?
Private 5G deployments require dense fiber backhaul to meet multi-gigabit throughput and low-latency targets, driving consistent order flow for rugged single-mode cables and connectors.