
Military Electro-optical and Infrared Systems Market Size and Share
Market Overview
| Study Period | 2020 - 2031 |
|---|---|
| Market Size (2026) | USD 9.35 Billion |
| Market Size (2031) | USD 10.77 Billion |
| Growth Rate (2026 - 2031) | 2.87 % |
| Fastest Growing Market | Asia Pacific |
| Largest Market | North America |
| Market Concentration | Medium |
Major Players *Disclaimer: Major Players sorted in no particular order Image © Mordor Intelligence. Reuse requires attribution under CC BY 4.0. | |
Military Electro-optical and Infrared Systems Market Analysis by Mordor Intelligence
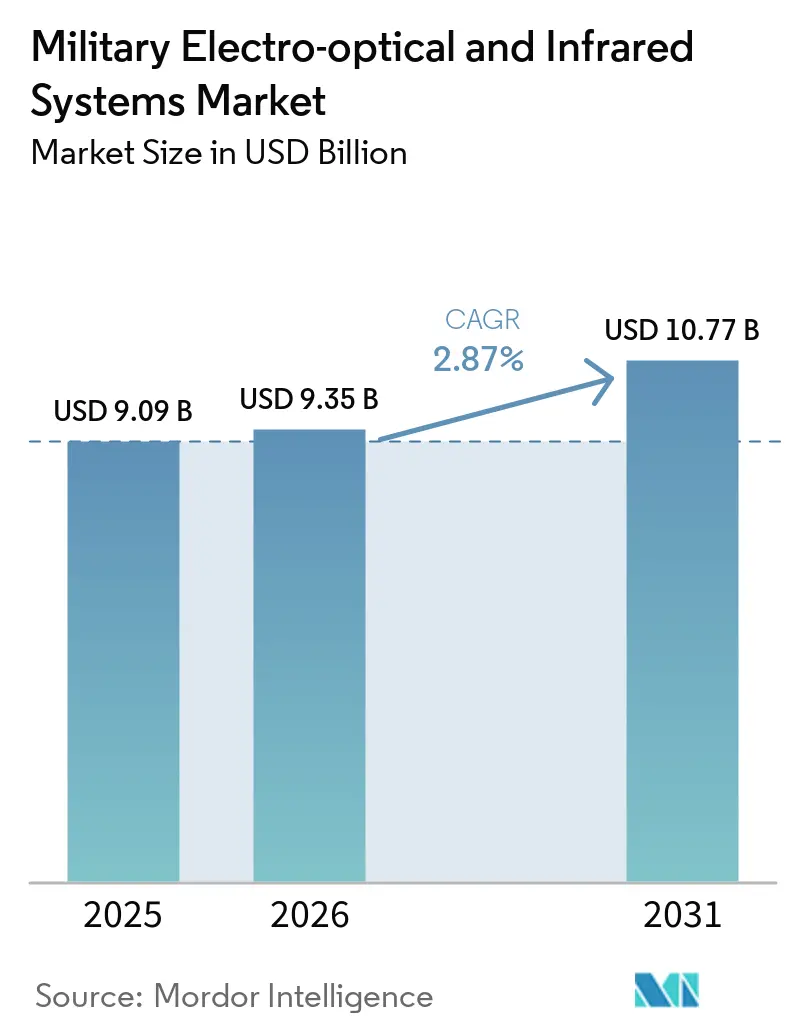
The military electro-optical and infrared (EO/IR) systems market size is expected to grow from USD 9.09 billion in 2025 to USD 9.35 billion in 2026 and is forecast to reach USD 10.77 billion by 2031 at 2.87% CAGR over 2026-2031. Stable top-line growth stems from sustained geopolitical tensions, NATO re-armament, and Indo-Pacific force modernization, all of which keep procurement pipelines for sensors, optics, processors, and integrated payloads active. Elevated defense outlays—USD 2.7 trillion in 2024—continue to pull demand toward advanced long-range targeting, counter-drone, and mast-mounted maritime solutions, while incremental improvements in size, weight, and power (SWaP) broaden adoption in soldier-wearable equipment. Competition remains moderate as entrenched primes defend their share through R&D and long-term contracts. Yet, start-ups employing artificial intelligence (AI) and quantum sensing capture niche programs, nudging the industry toward software-defined capabilities. Regionally, the United States, China, Japan, and key European members drive spending momentum, keeping North America in the lead while Asia-Pacific registers the highest growth.
Key Report Takeaways
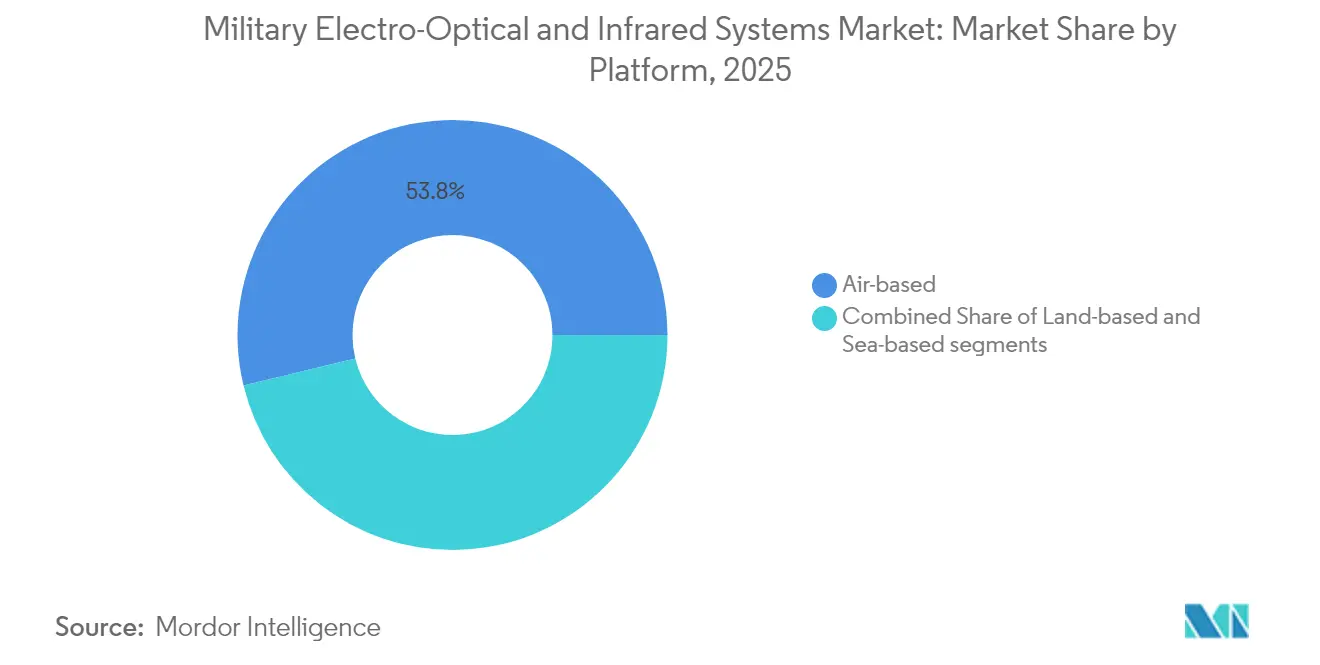
- By platform, air-based systems held 53.78% of the Military EO/IR systems market share in 2025, whereas land-based platforms are set to post a 5.21% CAGR through 2031.
- By component, sensors commanded 32.41% of revenue in 2025; processors are projected to expand at a 3.02% CAGR to 2031.
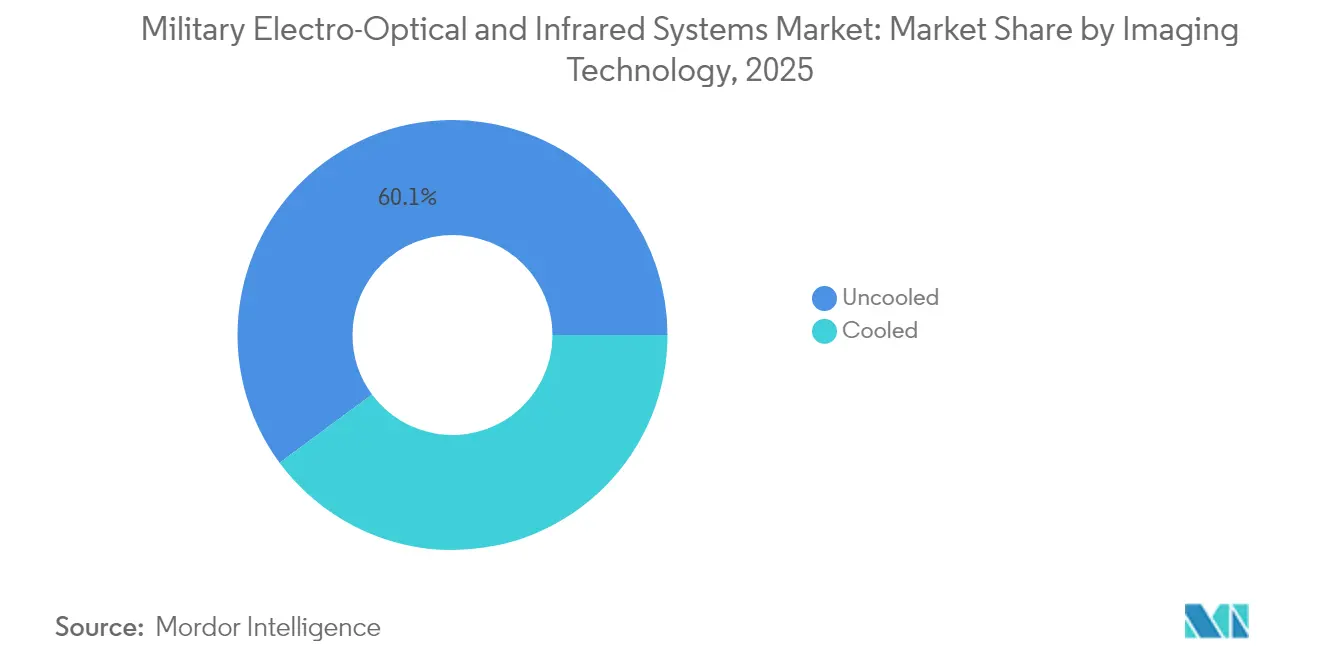
- By imaging technology, uncooled arrays retained 60.12% revenue share in 2025, while cooled arrays are forecasted to rise at 4.98% CAGR.
- By end-user, the army segment captured 41.55% in 2025; navy programs show the fastest 4.09% CAGR through 2031.
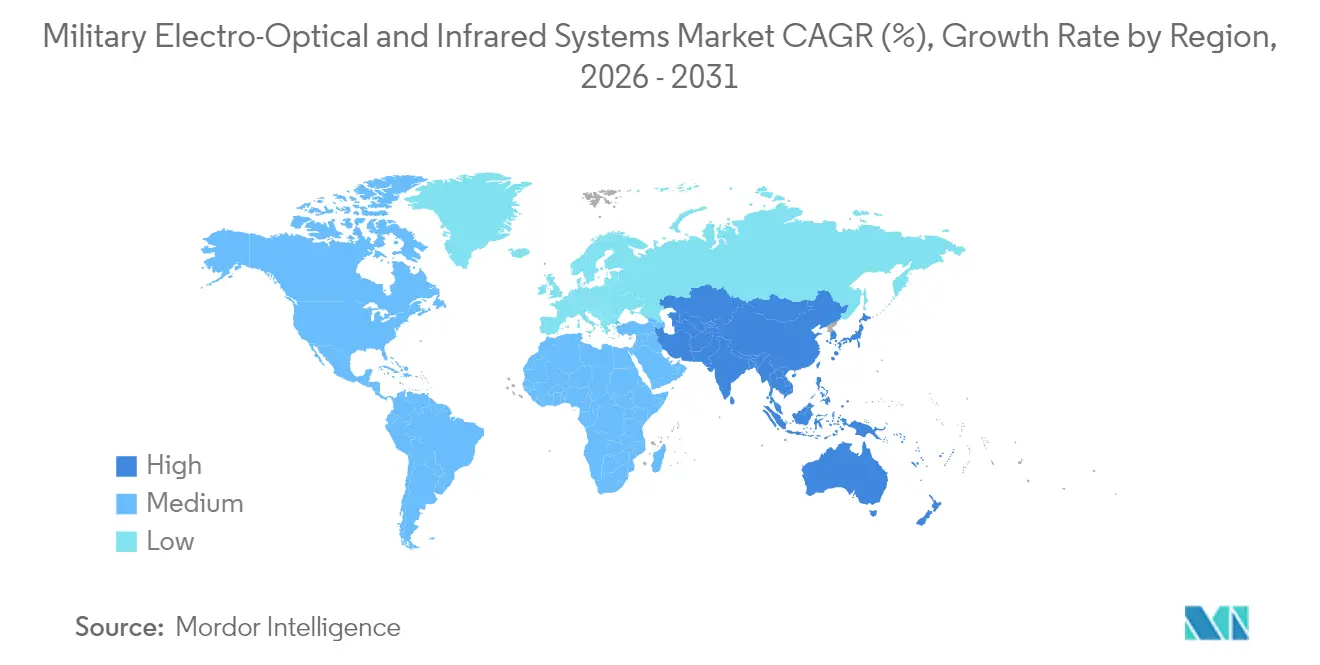
- By geography, North America contributed 30.12% in 2025, yet Asia-Pacific is advancing at a 3.78% CAGR on the back of Indo-Pacific naval and homeland security requirements.
Note: Market size and forecast figures in this report are generated using Mordor Intelligence’s proprietary estimation framework, updated with the latest available data and insights as of 2026.
Market Trends and Insights
Drivers Impact Analysis of Military Electro-optical and Infrared Systems Market*
| Driver | ( ~ ) % Impact on CAGR Forecast | Geographic Relevance | Impact Timeline |
|---|---|---|---|
| Rising demand for long-range targeting capabilities driven by strategic rivalries | +0.8% | Global, concentrated in Indo-Pacific and Eastern Europe | Medium term (2-4 years) |
| Proliferation of low-cost UAS driving need for counter-UAS EO/IR payloads | +0.6% | Global, particularly Middle East and Eastern Europe | Short term (≤ 2 years) |
| Advancements in SWaP-optimized sensor miniaturization expanding soldier-wearable EO/IR capabilities | +0.5% | North America, Europe, Asia-Pacific core markets | Medium term (2-4 years) |
| Adoption of AI-enabled ISR processing for real-time target recognition | +0.4% | Global, led by technologically advanced militaries | Long term (≥ 4 years) |
| Naval modernization efforts in the Indo-Pacific driving demand for mast-mounted EO/IR sensors | +0.3% | Asia-Pacific, with spillover to allied nations | Medium term (2-4 years) |
| Defense budget realignment toward multi-domain operations supporting integrated EO/IR investments | +0.2% | NATO countries, Japan, South Korea | Long term (≥ 4 years) |
| Source: Mordor Intelligence | |||
Rising Demand for Long-Range Targeting Capabilities Driven by Strategic Rivalries
Strategic competition forces militaries to detect, track, and engage threats beyond visual range. China’s radar program claims ballistic-missile detection at 4,500 km, spurring reciprocal Western sensor upgrades. The US Army awarded Raytheon USD 117.5 million for 3GEN FLIR sensors that pair high-definition, dual-band arrays with harsh-weather performance. France and the United Kingdom now earmark deep-strike and long-range ISR funds, while Japan’s USD 59 billion FY 2025 budget devotes USD 323.2 billion to orbital threat-tracking constellations. Boeing’s IRST Block II on the F/A-18E/F allows passive cueing without radio-frequency emission, a decisive tactic inside contested electromagnetic spectra. Emergent beyond-visual-range missiles featuring AESA seekers raise the bar for precise EO/IR fire-control, compelling sustained investment.
Proliferation of Low-Cost UAS Driving Need for Counter-UAS EO/IR Payloads
Cheap drones now populate every battlespace tier, compelling rapid counter-UAS adoption. Teledyne FLIR’s Cerberus XL unites radar, EO/IR, and effectors in a mobile mast to protect forward bases. Ophir’s continuous-zoom IR lenses shorten the kill chain by sharpening drone ID at extended ranges. The US Navy warns that “Hellscape” swarms of one-way attack drones will saturate Indo-Pacific flashpoints, inflating demand for integrated EO/IR interceptors.[1] Electro Optic Systems stresses directed-energy precision to neutralize swarms, underscoring how beam control and thermal sensors converge. Surface Optics Corporation’s SBIR award to track hypersonic glide vehicles shows counter-air applications spreading beyond basic quadcopters.
Advancements in SWaP-Optimized Sensor Miniaturization Expanding Soldier-Wearable EO/IR Capabilities
Breakthroughs in materials science are shrinking cooled and uncooled imagers to pocket form factors. Researchers fabricated IR filters thinner than cling film that dispense with heavy cryocoolers yet still resolve fine details. Safran’s HRTV Series weighs 4.4 lb yet hosts cooled thermal, color day, and low-light channels for team leaders on foot patrol. The US Army committed USD 275 million to Safran’s LTLM II binoculars that package direct-view glass, an uncooled thermal imager, and an eye-safe laser rangefinder at a lower price than legacy kits. Curtiss-Wright calculates that USD 30,000-60,000 is saved per pound by moving computing and storage into miniaturized mission processors for Group 3-5 UAS. L3Harris’s ENVG-B fuses white-phosphor night vision and thermal overlays, directly piping digital sight pictures onto the helmet visor to boost dismounted lethality.
Adoption of AI-Enabled ISR Processing for Real-Time Target Recognition
Digitally native armed forces now view data exploitation as critical as raw sensing. The US Department of Defense set aside USD 21 billion for AI and machine-learning in FY 2025, insulating autonomy budgets from wider R&D trims. HENSOLDT’s CERETRON software wraps neural-network modules around ground-station consoles, delivering near-real-time object classification across federated sensors. The Army’s FALCONS concept blends semi-autonomy with AI to seek, confirm, and hand off long-range targets under contested conditions. Booz Allen Hamilton built a three-layer fusion engine that merges algorithmic, sensor, and context cues to cut false alarms for naval commanders. Raytheon’s RAIVEN kit couples EO/IR optics with onboard AI, letting aircraft generate precision coordinates and self-deconflict logistics routes when datalinks jam.
Restraints Impact Analysis of Military Electro-optical and Infrared Systems Market*
| Restraint | ( ~ ) % Impact on CAGR Forecast | Geographic Relevance | Impact Timeline |
|---|---|---|---|
| Supply-chain bottlenecks in cooled FPA manufacturing | -0.4% | Global, particularly affecting non-US manufacturers | Short term (≤ 2 years) |
| ITAR and export-license restrictions hindering international sales | -0.3% | Global, primarily affecting US defense exports | Medium term (2-4 years) |
| Elevated cooling and power requirements for Long-Wave Infrared (LWIR) systems | -0.2% | Global, affecting portable and UAV applications | Medium term (2-4 years) |
| Data overload and integration challenges slowing full-spectrum sensor fusion deployments | -0.2% | Advanced military forces with complex sensor networks | Long term (≥ 4 years) |
| Source: Mordor Intelligence | |||
Supply-Chain Bottlenecks in Cooled FPA Manufacturing
Cooled focal plane arrays rely on chalcogenide glass, vacuum dewars, and miniature cryocoolers that face intermittent shortages. Trade frictions on germanium exports from China intensified lead times, compelling vendors to explore substitutes such as LightPath’s BDNL4 glass that mimics germanium’s refractive index at a lower cost. European supplier Lynred broke ground on an EUR 85 million clean-room expansion in Grenoble to lift bolometer throughput 50% by 2025 and cushion allied programs from US International Traffic in Arms Regulations delays. Until capacity normalizes, militaries defer certain cooled sights in favor of uncooled microbolometers, dampening near-term revenue expansion.
ITAR and Export-License Restrictions Hindering International Sales
Mission-critical EO/IR payloads often qualify as defense articles under ITAR, triggering prolonged license reviews. Non-NATO partners in the Middle East and Asia-Pacific report 6-12-month waits, impeding timely fielding even when funding exists. European manufacturers exploit this window, marketing ITAR-free sensors to Southeast Asian buyers. For US primes, license delays remain the largest single friction point in international market penetration, particularly across Southeast Asia and the Middle East.
*Our forecasts treat driver/restraint impacts as directional, not additive. The impact forecasts reflect baseline growth, mix effects, and variable interactions.
Military Electro-optical and Infrared Systems Market Segment Analysis
By Platform:
Air-Based Dominance Drives Combat Aircraft IntegrationThe military EO/IR systems market remains heavily weighted toward aerial fleets, with the air-based segment holding a 53.78% revenue share in 2025. Fixed-wing fighters integrate infrared search-and-track pods that let pilots locate stealth aircraft without radar emissions, while modern rotorcraft adopt all-weather gimbals for rescue and overwater patrol. The United States Coast Guard ordered 125 ESS-M turrets for MH-60 and MH-65 helicopters, underscoring airborne persistence. Rapid proliferation of Group 2-5 drones adds incremental sensor demand as each platform carries EO/IR balls sized to its payload capacity. Across NATO air arms, cooled mid-wave arrays dominate new acquisitions because their higher sensitivity extends identification beyond 30 km under desert haze.
Though starting from a smaller base, land-based solutions are projected to grow at 5.21% CAGR. Here, soldier-portable sights and armored vehicle periscopes drive procurement. L3Harris’s USD 263 million ENVG-B order illustrates how dismounted warfighters now expect fused thermal and image-intensified feeds. Heavy brigades retrofit third-generation FLIR modules so gunners can detect enemy armor past 6,000 m at night. Meanwhile, turreted counter-UAS sensors protect forward operating bases, replacing legacy radars with EO-verified tracks that limit fratricide. Sea-based demand remains steady as navies deploy sea-based military electro-optical and infrared systems, including shipboard panoramas such as SPEIR, to protect surface combatants from sea-skimming missiles.

By Component:
Sensors Lead Market Share with Processors Showing Rapid GrowthSensors accounted for 32.41% of the military EO/IR systems market size in 2025, thanks to continuous innovation in focal plane architectures. Manufacturers now deploy strained-layer superlattice detectors operating at 150 K, trimming size and power budgets by 40% compared with legacy mercury-cadmium-telluride variants. Lens makers pursue metamaterial designs printed through additive processes, reducing mass while supporting on-the-fly field-of-view changes. Stabilization blocks incorporate MEMS gyros that cancel 4 g vibration, which is vital for small UAVs.
Processors are the fastest-growing component at 3.02% CAGR as AI refines onboard exploitation. Open standards such as SOSA promote card-level plug-and-play, letting services upgrade algorithms without re-certifying optics. HENSOLDT’s software-defined front end demonstrates that margins increasingly migrate from glass to code. Human-machine interfaces also advance. Thermoteknix ARTIM overlays intuitive symbology onto night-vision images so troops can share bearings and target spots without radio chatter.
By Imaging Technology:
Uncooled Systems Dominate with Cooled Technologies AcceleratingUncooled arrays retained 60.12% share in 2025 because their microbolometers ship at lower unit cost and run from standard batteries, suiting binoculars, rifle sights, and low-cost drones. Evolution toward 8-micron pixels makes their imagery crisp enough for many tactical tasks. Uncooled devices migrate rapidly into civil border and disaster-response missions, benefiting from dual-use volumes that smooth military spurts.
Cooled systems will grow faster at 4.98% CAGR as armies field long-range target designators. Germanium scarcity threatens supply continuity, pushing research toward chalcogenide glass substitutes and galium-antimonide detectors. Third-generation FLIR modules now ship megapixel resolution and dual-band MWIR/LWIR fusion to reveal camouflaged armor at 15 km. The military EO/IR systems market now sees niche “micro-cooled” sensors housing Stirling or Joule-Thomson engines inside rifle-sight footprints, offering snipers 1,400 m positive ID even in 30°C desert heat.
By End-User:
Army Dominance with Navy Showing Strongest Growth TrajectoryArmy formations captured 41.55% of the 2025 revenue as each infantry squad receives networked sights and radios. Elbit America’s USD 139 million ENVG-B delivery order lifts total fielded units past 25,000, creating a baseline demand for spare sensors and battery packs. Armored vehicles integrate panoramic commander sights that merge daylight cameras and MWIR sensors via open-standard video, shortening target hand-off. Digital fire-control maps directly ingest FLIR video, boosting first-round hit probability at night.
Naval users will advance at 4.09% CAGR. Indo-Pacific fleets invest in mast-mounted panoramas to surveil congested straits. The US Navy’s SPEIR baseline begins with Arleigh Burke destroyers, installing a 360-degree suite that updates every one-sixth second to spot sea-skimming cruise missiles. Aircraft carriers equip E-2D Hawkeye with upgraded EO/IR turrets that backfill radar in electronic-attack conditions. Special-operations commands continue to demand modular kits that swap from rigid-inflatable boats to light aircraft within hours.
Geography Analysis
North America Military Electro-optical And Infrared Systems Market
North America led the military EO/IR systems market with a 30.12% share in 2025, anchored by the United States’ USD 920 billion defense budget. Washington prioritizes research, development, testing, and evaluation spending, funneling funds toward third-generation FLIR and AI-enabled target recognition. Canada supplements sensor demand through NORAD modernisation, adding a persistent EO/IR watch along Arctic approaches. Mexico invests selectively in border-security cameras and anti-cartel drone detection.
Europe Military Electro-optical And Infrared Systems Market
Europe recorded 17% year-over-year defense growth to USD 693 billion in 2024, the region’s sharpest surge since the Cold War. Germany accelerates electronic-warfare sensor upgrades after committing to a special fund of EUR 100 billion. France directs spending toward long-range surveillance pods for Rafale fighters, while the United Kingdom trials cooled IRST on its Typhoon fleet. Eastern allies Poland and Romania channel EU funds into counter-UAS optics defending ammunition depots.
APAC and Middle East Military Electro-optical And Infrared Systems Market
Asia-Pacific is the fastest-growing regional cluster at a 3.78% CAGR. China’s modernization push aims to allocate USD 360 billion to sensors and effectors by 2030. Japan set its highest-ever budget at USD 59 billion, earmarking orbital EO/IR satellites for missile warning. Australia’s 2024 Defence Strategy boosts naval SPEIR demand, while India scales handheld imagers for Himalayan surveillance. In parallel, Middle Eastern forces spend USD 243 billion, with Israel lifting budgets 65% to counter drone and rocket threats, creating near-term export openings.
Regulatory Landscape
Military EO/IR systems are regulated under a split US export-control framework, where the Directorate of Defense Trade Controls (DDTC) administers ITAR for defense articles on the US Munitions List (USML), while the Bureau of Industry and Security (BIS) enforces the EAR for dual-use items. USML Category XII (22 CFR Part 121) explicitly covers certain electro-optical, infrared, and related developmental systems, while EAR provisions such as 15 CFR 744.9 can add license requirements tied to end-use and end-user risk for cameras and related systems, increasing compliance work beyond basic ECCN classification.
Recent actions point to tighter enforcement and more granular provenance checks. In February 2026, BIS issued a final order imposing administrative sanctions against Teledyne FLIR LLC for export-control violations involving thermal imaging cameras under ECCN 6A003, highlighting the risk management burden for shipment, reexport, and transfer of infrared imaging systems. Separately, the FY26 National Defense Authorization Act signed on December 18, 2025, directs the Department of Defense to develop a strategy to eliminate reliance on optical glass and optical systems sourced from covered nations by January 1, 2030, raising sourcing and traceability requirements for optics and subcomponents used in military EO/IR programs.
Value Chain Analysis
The military EO/IR value chain runs from critical raw materials and substrates (for example germanium and specialty optical glass) to detector and focal-plane array fabrication (cooled and uncooled), optics and coatings, stabilization and control electronics, processors and AI-enabled exploitation software, and finally integration into gimbals, turrets, sights, or platform-embedded apertures. Prime contractors and tier-1 payload houses typically manage multi-year qualification, environmental testing, and mission-system integration, then assume sustainment obligations that extend into aftermarket spares, calibration, and depot repair across long program cycles.
Material availability and compliant sourcing increasingly influence vendor selection and total cost. Constraints tied to cooled FPAs and infrared optics, including germanium-related disruptions, push OEMs toward alternate materials qualification and dual-sourcing. At the same time, FY26 NDAA direction to reduce reliance on optical glass and optical systems from covered nations by 2030 increases traceability, domestic content planning, and vertically integrated sourcing strategies. On the downstream side, defense procurement and integration practices emphasize modularity (including MOSA-aligned payloads and sensor data standards for multi-platform interoperability), shifting value toward suppliers that can deliver upgradeable processing cards, software-defined feature growth, and lifecycle support alongside the optical train.
Competitive Landscape
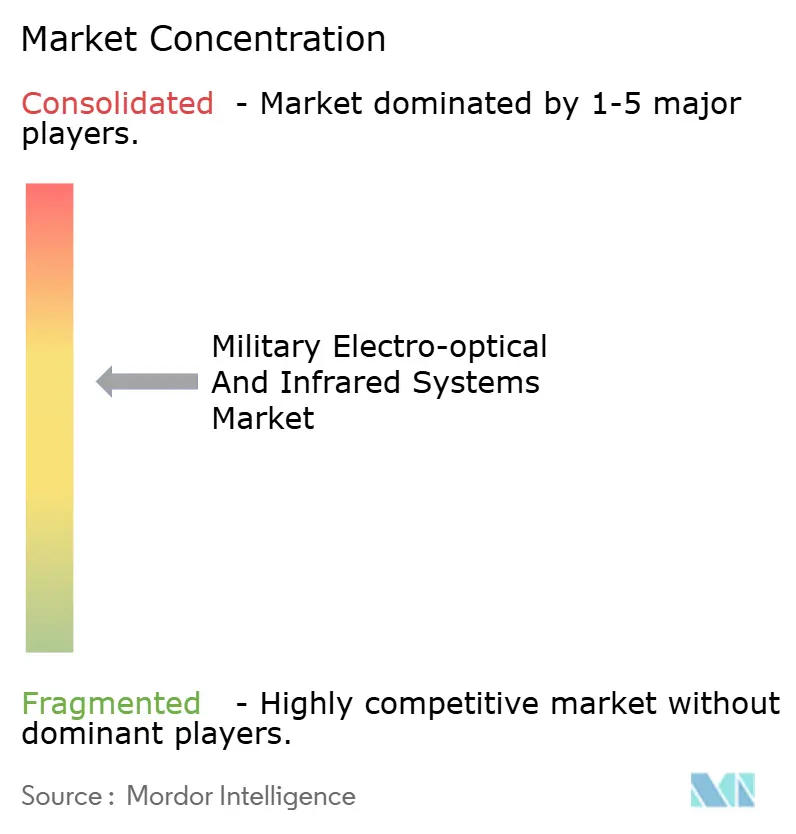
The military electro-optical and infrared systems market shows moderate concentration. Legacy integrators L3Harris Technologies Inc., Teledyne Technologies Incorporated, RTX Corporation, Northrop Grumman Corporation, and Lockheed Martin Corporation leverage century-old supply chains and classified know-how. L3Harris landed a USD 263 million order for ENVG-B second-lot production, fortifying its dismounted optics franchise. Teledyne FLIR secured USD 74.2 million to upgrade Coast Guard air-borne turrets, illustrating cross-domain reach. Leonardo DRS obtained USD 94 million for micro-cooled weapon sights, underlining calibrated specialization.
Firms pursue vertical integration to lock in long-term support contracts. Raytheon operates cryocooler plants in Texas alongside array foundries in Indiana, reducing time-to-field for third-generation FLIR kits. Lockheed Martin invests in diamond-substrate heat sinks to boost detector temperature ceilings, freeing space on fighter jets for extra fuel. Airbus and HENSOLDT modernise Germany’s electronic-warfare mission data pipeline, showing how primes marry hardware and analytics into single-source tenders.[3]
Disruptors such as Anduril and Quantum Design target white-space niches. Anduril’s modular sensor tower fuses radar, EO/IR, and mesh networking, winning US Marine Corps tests thirty months after the prototype. Quantum sensing startups pursue entanglement-based lidar that may spot periscopes through sea clutter beyond 20 km, extending naval situational awareness.[4] Software-defined upgrades gain weight as services insist on sensor-agnostic algorithms that load on standard processing cards, signaling future competition on code velocity rather than glass precision.
Military Electro-optical and Infrared Systems Industry Leaders
-
Teledyne Technologies Incorporated
-
RTX Corporation
-
L3Harris Technologies Inc.
-
Lockheed Martin Corporation
-
Northrop Grumman Corporation
- *Disclaimer: Major Players sorted in no particular order
Military Electro-optical and Infrared Systems Market Companies Covered in this Report
- BAE Systems plc
- Elbit Systems Ltd.
- Teledyne FLIR LLC
- L3Harris Technologies Inc.
- RTX Corporation
- Lockheed Martin Corporation
- Leonardo S.p.A
- Saab AB
- Rheinmetall AG
- Israel Aerospace Industries Ltd.
- HENSOLDT AG
- Northrop Grumman Corporation
- Safran SA
- Thales Group
- Ultra Electronics Holdings Limited
- CACI International Inc.
- Optikos Corporation
- Navitar, Inc.
- Anduril Industries, Inc.
Market Opportunities and Future Outlook
High-volume dismounted and vehicle-mounted sensing programs support a demand lane for compact thermal imagers and next-generation night-vision devices, where differentiation centers on SWaP, open interfaces, and rapid producibility. US Army BiNOD awards in March 2026 (Photonis Defense, up to USD 352.6 million through February 2033) and April 2026 (L3Harris, up to USD 465 million) reflect ongoing procurement for binocular systems that combine low-light and thermal advantages, and they also enlarge installed bases that need spares, software updates, training aids, and repair pipelines.
Opportunities also cluster around sustainment-driven modernization of legacy aircraft and rotorcraft EO/IR suites, as services refresh sensors, processing, and logistics support to keep fielded platforms relevant. In July 2026, Lockheed Martin received a USD 502.4 million US Army contract for M-TADS/PNVS sensor sustainment on AH-64 Apache helicopters through 2031, pointing to the scale of the upgrade and sustainment budget for mature EO/IR lines. Demand is further widening for EO/IR data that integrates into broader C4ISR architectures, including missile warning and tracking concepts, and for hardware-software bundles that accelerate sensor fusion and aided target recognition at the edge rather than relying on centralized ground processing.
Recent Industry Developments in Military Electro-optical and Infrared Systems Market
- July 2026: Leonardo DRS signed a blanket purchase agreement to supply Tenum Orbit thermal imaging cameras under an ongoing multi-year program across multiple platforms. The contract supports continued demand for high-volume thermal modules and informs production planning.
- May 2025: L3Harris expanded its production and service footprint for the BiNOD program, reinforcing a long-term dismounted modernization pipeline. The additional capacity supports binocular night-vision system output and expands fielded support infrastructure.
- October 2024: HENSOLDT and Raytheon (RTX Corporation) signed a memorandum of understanding to improve cooperation on maintenance and operational readiness for EO/IR systems supporting NATO forces. The agreement strengthens lifecycle readiness and interoperability objectives across deployed sensor fleets.
Military Electro-optical and Infrared Systems Market Report Scope and Research Methodology
Market Definition and Coverage
For this study, the market covers new-build military electro-optical and infrared (EO/IR) systems and subsystems that deliver imaging, detection, tracking, and targeting functions on defense platforms, and which are delivered as mission-ready equipment in USD terms.
Scope exclusions: We exclude civilian security cameras, commercial aviation EO/IR uses, and industrial inspection or scientific imaging devices.
Segments Covered in This Report
- By Platform
- Air-based
- Fixed-Wing Combat Aircraft
- Rotary-Wing and Tilt-Rotor Aircraft
- Unmanned Aerial Vehicles
- Land-based
- Armoured Fighting Vehicles
- Soldier Portable and Weapon Sights
- Ground Surveillance and Forward Operating Base (FOB) Systems
- Sea-based
- Surface Combatants and Patrol Vessels
- Submarines and Undersea Platforms
- Air-based
- By Component
- Human-Machine Interfaces
- Stabilization Units
- Control Systems
- Sensors
- Optics
- Processors
- By Imaging Technology
- Cooled
- Uncooled
- By End-User
- Army
- Air Force
- Navy
- By Geography
- North America
- United States
- Canada
- Mexico
- Europe
- Germany
- United Kingdom
- France
- Italy
- Spain
- Rest of Europe
- Asia-Pacific
- China
- India
- Japan
- South Korea
- Rest of Asia-Pacific
- South America
- Brazil
- Rest of South America
- Middle East and Africa
- Middle East
- Saudi Arabia
- United Arab Emirates
- Rest of Middle East
- Africa
- South Africa
- Rest of Africa
- Middle East
- North America
Data Sources, Market Sizing, and Validation
Desk Research
Desk research was first used to map the demand pool and the procurement cycle that typically drives EO/IR buying. We relied on public defense budget documents and procurement plans, along with sources such as SIPRI military expenditure data, UN Comtrade trade statistics for relevant optics and sensor categories, and government tender portals and contract award notices.
To keep assumptions grounded, we also reviewed defense ministry capability roadmaps, parliamentary or congressional hearing transcripts, and technical papers in peer-reviewed journals covering infrared detectors, optics materials, and stabilization systems. Company annual reports and investor presentations were used to cross-check mix shifts and program exposure, and a paid subscription database was selectively used to standardize company financials, patents, and contract references. These examples are not exhaustive, and many other sources were consulted for data collection, cross-checking, and clarification.
Primary Interviews and Surveys
Primary work focused on filling gaps that desk research does not usually answer well, such as platform-level fit, upgrade timing, and typical pricing steps from sensor core to integrated payload. We spoke with a mix of defense procurement-focused stakeholders, component suppliers, system integrators, and retired or independent technical experts, and coverage was balanced across regions so assumptions were not driven by one defense spending bloc. Inputs from these discussions were used to confirm what is counted as military-grade EO/IR, validate adoption drivers like UAV payload demand, and pressure-test forecast scenarios.
Distribution of primary research fieldwork respondents
| Company type | Respondent position | Region |
|---|---|---|
| Top tier: 26% | CXOs: 13% | APAC: 41% |
| Mid tier: 60% | Functional/Unit leaders: 36% | EMEA: 32% |
| Smaller Players: 14% | Managers: 51% | Americas: 27% |
Market-Sizing & Forecasting
Sizing was built using top-down and bottom-up checks, with the primary structure starting from defense procurement and platform activity by region, which is then translated into EO/IR demand. We linked spend and unit activity to where EO/IR systems are actually installed, and then applied a set of penetration and refresh assumptions to estimate annual deliveries in value terms.
Key inputs that shaped the model included defense budget trends and modernization shares, procurement volumes for UAVs and helicopters that carry stabilized payloads, fleet retrofit cadence for ground vehicles and naval surveillance directors, typical multi-spectral mix (visible, SWIR, MWIR, LWIR) by mission set, and average selling price progression as systems move from sensor cores to integrated turrets and targeting pods. Where a variable was weak in public data, it was filled using interview ranges, and then checked against reported program timelines.
For forecasting, we used scenario analysis with a light multivariate regression overlay to connect demand to defense spending direction, platform delivery schedules, and replacement cycles. The final totals were corroborated using selective bottom-up approximations, such as sampling payload counts per platform class and applying realistic price bands, and then adjusting for gaps where program details are not disclosed.
Data Validation & Update Cycle
Outputs are validated through triangulation across at least three independent signals, which typically includes budget direction, platform procurement or retrofit evidence, and supplier-side shipment or order commentary. When a regional or platform result looks unusual, assumptions are rechecked for unit counts, timing, and currency conversion, and then it is reviewed again by another analyst before sign-off.
The model is refreshed on an annual cycle, and interim updates are made when material events occur, such as a large EO/IR program award, a major conflict-driven demand shift, or a meaningful change in export controls affecting supply. Before delivery, we do a final pass to revalidate recent announcements so the client receives the most current view.
Mordor Intelligence's Military Electro Optical and Infrared Systems Market Size Measured Against Other Published Estimates
Published market sizes for military EO/IR systems can vary a lot because the cut lines are not identical, even when the topic name looks the same. Differences typically come from what is counted as a system versus a component, whether aftermarket upgrades are included, and how each publisher treats multi-spectral payload pricing over time.
Another common driver is how the demand pool is constructed, since some models start from broad defense electronics totals and then apply high-level ratios, while others try to rebuild demand from platform deliveries and retrofit cycles. The spread is also widened by forecast posture (aggressive versus conservative), exchange-rate timing for non-USD contracts, and how often assumptions are refreshed against new contract awards and program delays.
Benchmark comparison
| Source | Market Size | Gaps in Research Methodology |
|---|---|---|
| Mordor Intelligence | USD 9.09 B (2025) | |
| Global Consultancy A | USD 8.77 B (2025) | This estimate appears to use a tighter definition that can undercount integrated payload content on certain platforms, and it may smooth pricing using broader averages rather than mission-driven multi-spectral mix changes. |
| Industry Publisher B | USD 13.87 B (2025) | This figure likely includes a wider basket of EO/IR related revenue, potentially blending component-level optics and sensor content with complete systems, which can lift totals versus a platform-installed system-only view. |
The table shows that most of the gap can be explained by scope and counting rules, more than by disagreement on overall defense demand. By tying the value build-up to platform-installed, mission-ready EO/IR deliveries and then checking the totals against procurement and contract signals, the system-only view stays consistent, which is the approach applied by Mordor Intelligence.
Key Questions Answered in the Report
What is the current size of the Military Electro-Optical and Infrared Systems market?
The military electro-optical and infrared systems market size stands at USD 9.35 billion in 2026 and is projected to reach USD 10.77 billion by 2031, at a 2.87% CAGR.
Which platform segment leads the market today?
Air-based platforms lead with 53.78% share in 2025, backed by continual fighter, ISR aircraft, and drone sensor upgrades.
Why are cooled infrared systems growing faster than uncooled systems?
Cooled arrays deliver superior long-range detection and dual-band sensitivity, driving a 4.98% CAGR despite higher cost and power consumption.
Which region is expected to grow the fastest through 2031?
Asia-Pacific shows the highest 3.78% CAGR owing to force modernization by China, Japan, India, and allied maritime programs.
What role does artificial intelligence play in EO/IR modernization?
AI enables real-time target recognition and sensor fusion at the edge, reducing operator workload and improving decision speed across land, sea, and air missions.
How concentrated is the competitive landscape?
The top five vendors control just over half the market, implying moderate concentration where established primes coexist with innovative newcomers leveraging AI and quantum sensing.