
Military Biometrics Market Size and Share
Market Overview
| Study Period | 2019 - 2031 |
|---|---|
| Market Size (2026) | USD 10.68 Billion |
| Market Size (2031) | USD 14.83 Billion |
| Growth Rate (2026 - 2031) | 6.80 % |
| Fastest Growing Market | Asia Pacific |
| Largest Market | North America |
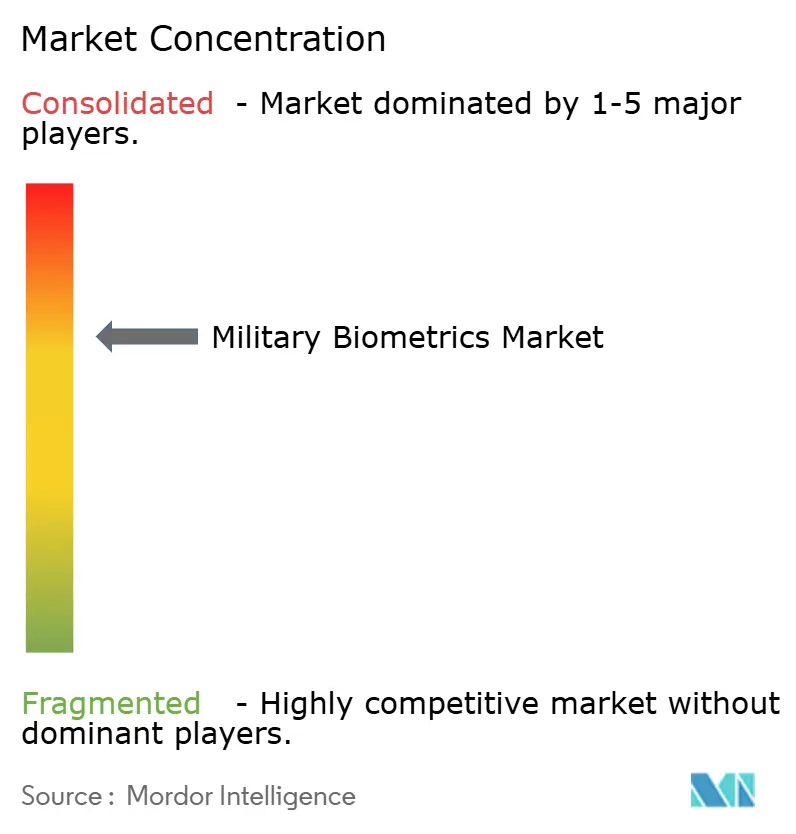
| Market Concentration | Medium |
Major Players *Disclaimer: Major Players sorted in no particular order Image © Mordor Intelligence. Reuse requires attribution under CC BY 4.0. | |
Military Biometrics Market Analysis by Mordor Intelligence
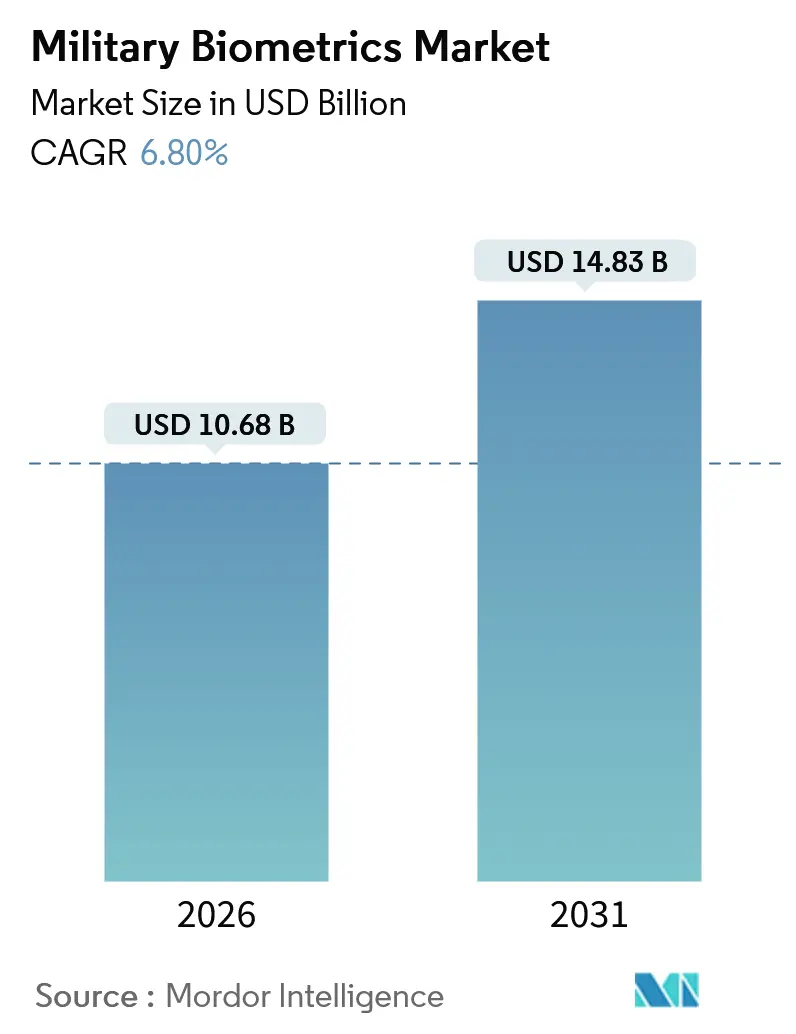
The military biometrics market size is expected to reach USD 10.68 billion in 2026 and is projected to grow to USD 14.83 billion by 2031, registering a 6.80% CAGR over the forecast period. Heightened asymmetric warfare, porous borders, and NATO interoperability mandates are the primary forces shaping current demand trajectories. Meanwhile, AI-enabled accuracy improvements and declining sensor prices create new opportunities for adoption. Vendors able to combine open-standard middleware with ruggedized hardware are gaining preference as defense agencies race to meet new accuracy thresholds, and privacy requirements are fragmenting deployment architectures between on-device and cloud-based matching. The military biometrics market continues to shift toward mobile and tactical solutions, as authentication occurs at dispersed contact points in today’s irregular conflict zones. Competitive intensity is moderate; the top five suppliers rely on multi-year contracts that include refresh clauses, creating switching barriers for customers.
Key Report Takeaways
- By recognition type, fingerprint systems held 44.67% of the military biometrics market share in 2025, while voice, palm vein, and gait analytics are expected to expand at an 8.89% CAGR through 2031.
- By solution, hardware generated 61.13% of 2025 revenue; however, software is advancing at a 9.91% CAGR as defense ministries prioritize AI-ready matching engines.
- By platform, land-based deployments accounted for 40.03% of the military biometrics market size in 2025 and are projected to grow at a 10.14% CAGR through 2031.
- By deployment environment, mobile and tactical kits dominated with a 62.89% revenue share in 2025 and are projected to rise at a 7.87% CAGR to the end of the forecast window.
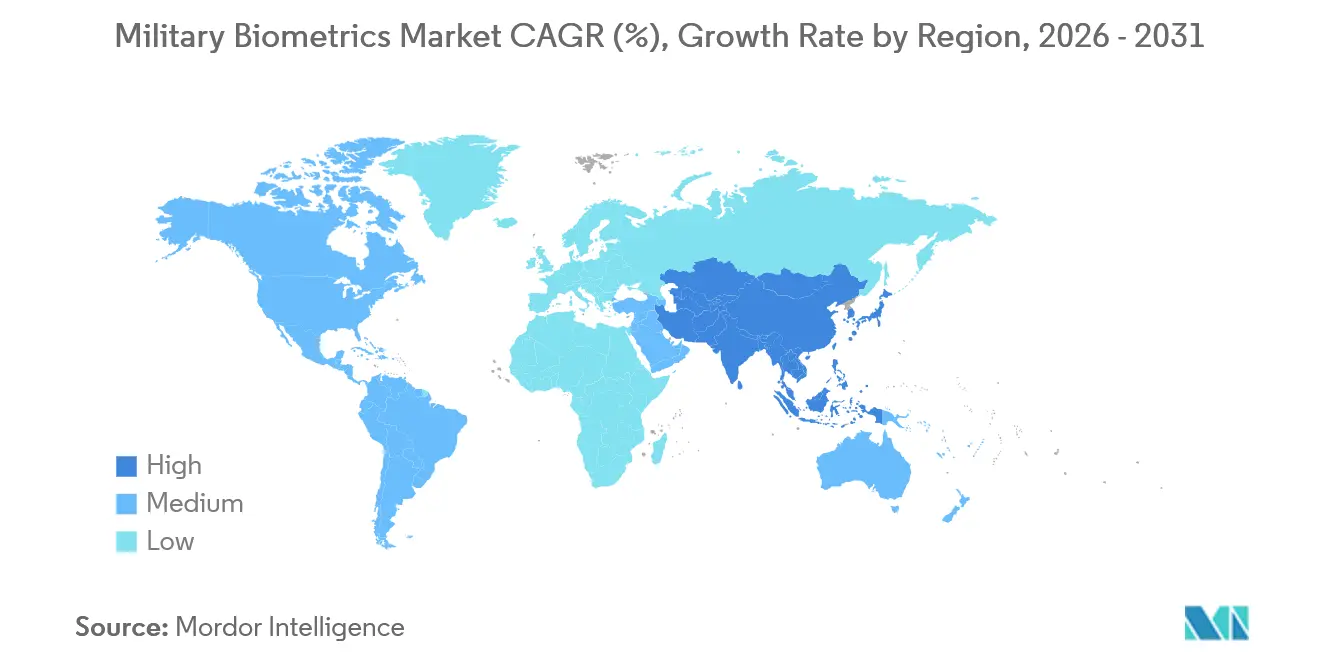
- By geography, North America accounted for 36.75% of the revenue in 2025; the Asia-Pacific region is the fastest-growing, with an 8.32% CAGR, driven by procurements from India, China, and Japan.
Note: Market size and forecast figures in this report are generated using Mordor Intelligence’s proprietary estimation framework, updated with the latest available data and insights as of January 2026.
Market Trends and Insights
Drivers Impact Analysis of Military Biometrics Market*
| Driver | (~) % Impact on CAGR Forecast | Geographic Relevance | Impact Timeline |
|---|---|---|---|
| Rising asymmetric warfare and border security needs | +1.8% | Middle East, South Asia, US–Mexico border | Medium term (2-4 years) |
| Government digital identity and defense modernization programs | +1.5% | North America, Europe, Asia-Pacific | Long term (≥4 years) |
| Cost decline of fingerprint and facial sensors | +1.2% | Global, price-sensitive APAC and MEA | Short term (≤2 years) |
| Integration of AI/ML boosting accuracy and speed | +1.4% | North America, Europe, APAC | Medium term (2-4 years) |
| Deployment of biometric-enabled wearables for soldier authentication | +0.9% | NATO states and select APAC allies | Long term (≥4 years) |
| NATO push for interoperable multimodal biometric repositories | +1.1% | Europe, North America | Long term (≥4 years) |
| Source: Mordor Intelligence | |||
Rising Asymmetric Warfare And Border Security Needs
Non-state adversaries and migration flows now bypass fixed checkpoints, forcing commanders to verify identities during patrols, at forward posts, and along remote deserts. The US Army enrolled 7.3 million individuals across Iraq, Afghanistan, and Syria under its Biometrics Enabling Capability, demonstrating the operational value of field kits.[1] India’s Border Security Force installed 1,200 mobile biometric devices along the Bangladesh and Myanmar frontiers in 2025 and cut illegal crossings by 34% within six months. Saudi Arabia integrated iris scanners with Interpol watchlists at 89 land crossings, intercepting 2,400 fraudulent entries in the first year. These precedents explain why mobile and tactical systems captured nearly two-thirds of 2025 revenue. As distributed conflict persists, the military biometrics market will continue to privilege rugged handheld devices that work beyond garrison infrastructure.
Government Digital Identity And Defense Modernization Programs
Defense ministries are synchronizing soldier and contractor credentials with nationwide electronic identification (e-ID) frameworks. The DoD awarded a USD 92 million contract in 2025 to integrate biometric verification into the Common Access Card, covering approximately 2.1 million personnel. Japan earmarked USD 120 million in fiscal 2025 to retrofit 340 facilities with multimodal gates, resulting in a 67% reduction in unauthorized-access incidents at test sites. The EU’s PESCO initiative mandates ISO/IEC 19794 compliance by 2027, accelerating middleware procurements that bridge national networks. Such programs extend verification from base entry to supply-chain checkpoints and naval docks, thereby broadening the addressable military biometrics market across asset classes and mission sets.
Cost Decline of Fingerprint and Facial Sensors
Component prices have fallen below key procurement thresholds. Capacitive fingerprint modules now cost USD 3.80 each, down from USD 12 in 2020, enabling battalion-level kit issuance. Facial cameras with embedded neural engines are expected to drop to USD 89 in 2024, supporting deployment on 250 US Coast Guard cutters under a USD 47 million upgrade.[2] India’s DRDO produced an iris scanner priced at USD 180 in 2025, opening local volume orders for 12,000 units. With sensor costs falling, the budget debate shifts toward which modalities to combine rather than whether to deploy any at all, accelerating the multimodal trajectory of the military biometrics market.
Integration of AI/ML Boosting Accuracy and Speed
Neural architectures now outperform legacy minutiae extractors in dusty, low-light, and soot-covered conditions. DHS’s 2024 Biometric Rally achieved a 97.2% true-acceptance rate for ML-based fingerprint models, compared to 81.4% for earlier approaches. Oak Ridge released the BRIAR data set of 50,000 long-range body images, resulting in gait models that reached 89% accuracy at 200 meters, a breakthrough for special operations. NEC’s 2024 NeoFace upgrade slashed one-to-many search time across 10 million templates from 4.2 seconds to 0.7 seconds. These improvements meet the requirements of DoD Directive 8521.01E, which mandates 98% accuracy in operational theaters. Software refreshes are thereby outpacing hardware replacements and fueling the 9.91% CAGR in biometric-matching engines.
Restraints Impact Analysis of Military Biometrics Market*
| Restraint | (~) % Impact on CAGR Forecast | Geographic Relevance | Impact Timeline |
|---|---|---|---|
| Privacy and civil-liberty concerns over biometric databases | -1.3% | Europe and North America | Medium term (2-4 years) |
| High integration cost with legacy defense IT | -1.1% | Global, acute in Europe and North America | Short term (≤2 years) |
| Spoof-resistant tech lag in austere battlefield environments | -0.8% | Middle East, Africa, South Asia | Medium term (2-4 years) |
| Cyber-physical attacks targeting tactical biometric sensors | -0.7% | Global, contested EM environments | Long term (≥4 years) |
| Source: Mordor Intelligence | |||
Privacy and Civil-Liberty Concerns Over Biometric Databases
Regulators in democratic jurisdictions are curtailing centralized repositories. The European Data Protection Board requires that facial recognition systems used by member militaries complete matching on-device, a rule that increases per-unit costs by 40% and limits cloud deployments.[3] GAO’s 2025 audit identified 17 privacy gaps in DHS’s HART project, resulting in a delay of USD 214 million in spending. Canada now requires the deletion of biometric data within 90 days if no charges are filed, reducing the investigatory utility of field enrollments. Such rulings fragment the military biometrics market between jurisdictions that pursue expansive central databases and those that enforce strict local retention, complicating vendor product roadmaps.
High Integration Cost With Legacy Defense IT
Aging command-and-control networks raise middleware bills and slow rollout schedules. The US Army spent USD 340 million integrating biometrics into its enterprise personnel system after discovering that older databases could not store ISO templates natively. The UK canceled a planned upgrade on 78 frigates when bids reached USD 230 million, an amount deemed unjustifiable given their scheduled retirement in 2028. NATO’s 2024 survey found that 62% of member states cite legacy IT as their top barrier, with an average integration span of 3.7 years. These cost overruns tend to tilt procurement toward software-defined solutions that abstract legacy complexity, yet still dampen near-term growth.
*Our forecasts treat driver/restraint impacts as directional, not additive. The impact forecasts reflect baseline growth, mix effects, and variable interactions.
Military Biometrics Market Segment Analysis
By Recognition Type:
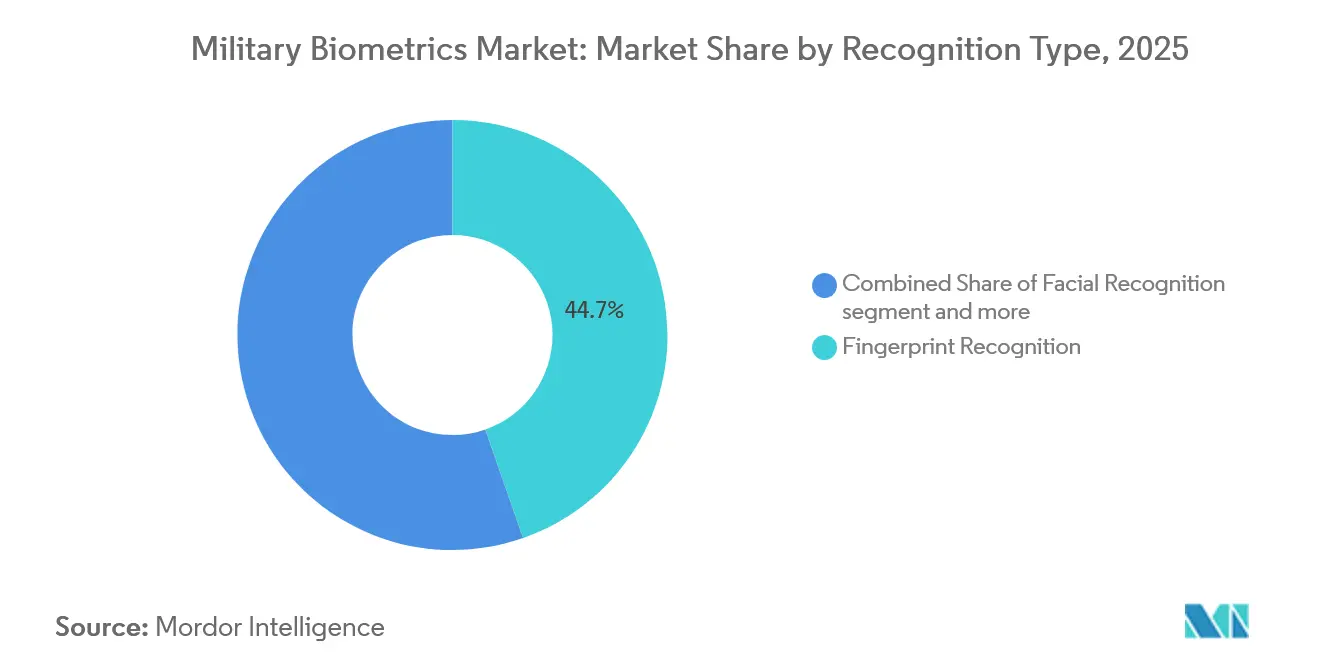
Fingerprint Leadership Funds The Shift To Contactless ModalitiesFingerprint systems accounted for 44.67% of 2025 revenue, underpinned by 14,000 SEEK II handhelds deployed across US brigades and extensive criminal-justice precedent. Facial recognition follows, benefiting from passive capture at checkpoints where the US CBP processed 97 million comparisons in fiscal 2025.[4] Iris recognition remains a niche technology because it requires cooperative subjects; yet, the US Marine Corps installed 800 iris-enabled tablets on amphibious ships for shipboard access in 2024. The other categories, voice, palm vein, gait, and behavioral, grow at an 8.89% CAGR, as special forces favor contactless options in chemical or biological threat zones. DARPA proved gait identification accuracy of 87% at 150 meters in 2024 field trials. Palm-vein access is now tested at 120 Japanese armories, showing resilience against surface abrasion limits that plague fingerprints. Voice biometrics defended encrypted radio channels on Thales AN/PRC-163 sets, authenticating speakers in real time. Multimodal fusion is the long-term end-state. The DoD’s forthcoming tri-modal handheld solicitation highlights a channel where the military biometrics market size for hybrid devices is expected to expand through 2031.

By Solution:
Software Velocity Outstrips Hardware DominanceHardware contributed 61.13% of 2025 sales, reflecting the capital intensity of scanners and ruggedized tablets. Yet software licenses post the steepest slope at 9.91% CAGR because neural matching upgrades can raise accuracy to the 98% directive threshold without sensor swaps. Aware recorded 34% software license growth in 2025 by retrofitting legacy readers with ML engines, which reduced false rejects by 40%. NeoFace’s sub-second searches across 10 million templates facilitate real-time border decisions in Germany, Spain, and Poland. Encryption and audit modules enhance value; DERMALOG won a USD 49 million contract by embedding blockchain audit trails to preserve evidentiary chains for federal law enforcement agencies. Hardware vendors now offer bundled subscriptions; IDEMIA’s MorphoWave Compact includes a three-year cloud matching option, reflecting the convergence. As software upgrade cycles are key, the military biometrics market will allocate a larger portion of its budget toward middleware, algorithms, and federated database management.
By Platform:
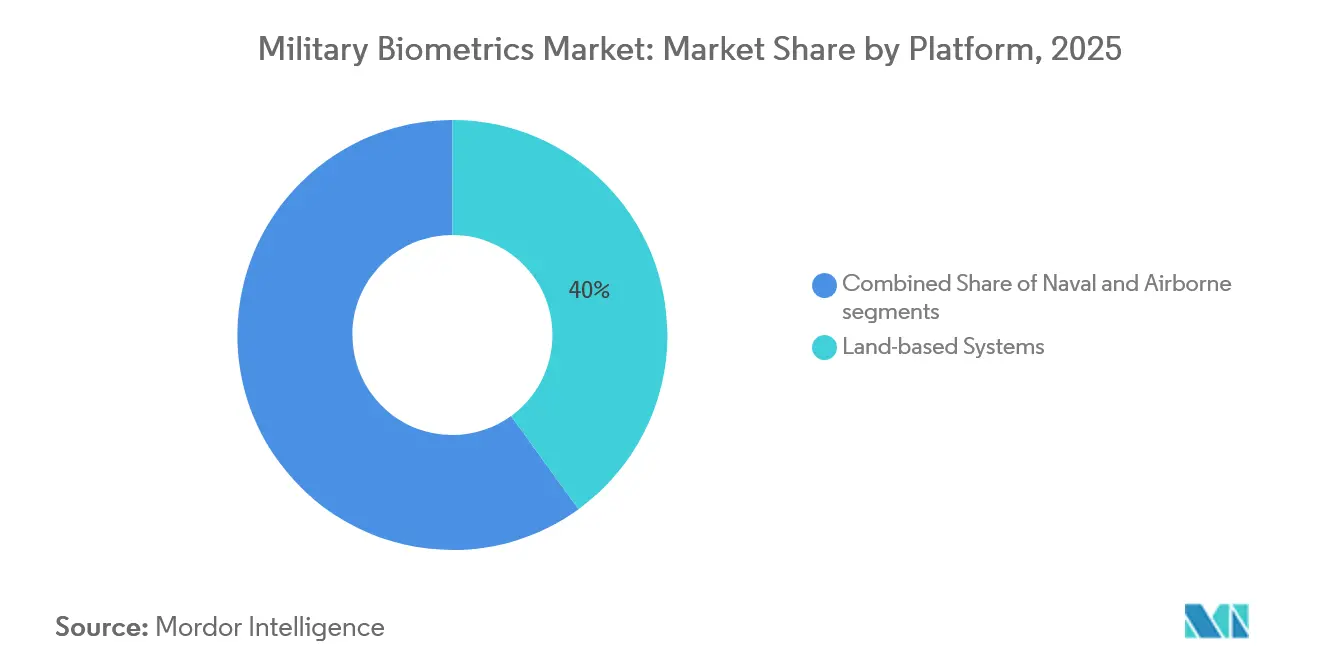
Land Systems Dominate And Accelerate In ParallelLand systems led with 40.03% of 2025 revenue and also logged the fastest 10.14% CAGR thanks to border-wall sensor arrays and vehicle-mounted stations that supplant fixed forward bases. Saudi Arabia’s USD 780 million Yemen-frontier smart fence merges cameras and ground sensors, cutting illegal crossings and validating the land-centric thesis. India equipped 450 all-terrain vehicles with biometric workstations to enroll detainees in remote Himalayan sectors. Naval platforms follow; the US Navy adopted iris gates on 22 destroyers under IDEMIA’s USD 68 million award to protect nuclear weapons lockers. Japan retrofitted eight Aegis destroyers, slashing unauthorized entries by 91%. Air systems remain smallest due to weight and power limits, although the US Air Force pilots' cockpit fingerprint locks on F-35A fighters at Nellis. The land focus confirms that the military biometrics market will continue to anchor on ground-based deployments, where threat contact is most frequent.
By Deployment Environment:
Tactical Mobility Remains ImperativeMobile and tactical deployments captured a 62.89% share in 2025, gaining traction from counterinsurgency missions that require on-the-spot identity checks. France’s Barkhane force logged 340,000 enrollments across Sahel patrols between 2020 and 2024 through rugged tablets. In 2025, India’s Central Reserve Police deployed 1,800 mobile kits in Kashmir for instant verification against a watchlist of 2.3 million records. Fixed installations account for 37.11% of spending and handle high-throughput border gates. The DoD now authenticates 18 million daily entries at 680 bases via biometric gates. The UAE processed 89 million travelers through 140 biometric lanes at two airports in 2024. Nonetheless, asymmetric foes avoid static points, ensuring that tactical kits remain the primary budget line of the military biometrics market.
Geography Analysis
North America Military Biometrics Market
North America led with 36.75% of 2025 revenue, driven by the USD 386 million CBP OBIM contract and large defense modernization budgets. Canada committed USD 180 million to integrate biometrics into its personnel management system through 2029. Mexico deployed 800 kits in 2024 for southern border patrols.
APAC Military Biometrics Market
The Asia-Pacific region is growing at an 8.32% CAGR. India installed biometric gates at 198 forward posts along the Line of Actual Control in 2025, financed within a USD 420 million program. China’s Ministry of Public Security grew its border records to 1.2 billion and rolled out facial exit-entry systems at 312 crossings.
EMEA and APAC Military Biometrics Market
Japan funded USD 190 million for 340 base retrofits with NEC multimodal gates. South Korea selected HID Global for USD 95 million of iris scanners across 280 facilities. Europe balances GDPR privacy limits with NATO standards, investing USD 130 million to migrate Germany’s database onto a compliant backbone. The Middle East and Africa growth centers on border security fences and national service enrollment. Saudi Arabia now operates biometric checkpoints at 89 crossings, resulting in a 67% reduction in fraud.
Regulatory Landscape
Military biometrics procurement and deployment are shaped by defense interoperability mandates and privacy constraints, which narrow the architectures defense buyers will accept. In the United States, Department of Defense biometric activities are governed by DoDD 8521.01E, which sets requirements for standardized enterprise processes, sharing, and operational performance thresholds, and it is implemented through program and data standards such as DoD EBTS and the DoD Integrated Data Dictionary (IDD). Agencies also align to NIST-managed recommended biometric standards registries and ANSI/NIST-ITL data interchange formats, tightening expectations for multimodal capture and exchange across fingerprints, face, and other modalities.
In Europe and other democratic jurisdictions, privacy oversight and data minimization rules steer programs toward on-device matching, constrained retention, and federated repositories. That approach can increase per-unit compute and integration complexity compared with centralized matching, even as coalition operations push for cross-border data-format harmonization. NATO interoperability requirements encourage shared templates and transmission specifications across member states. Overall, vendors need to deliver auditability, encryption, and standards conformance while supporting both edge processing and enterprise-scale repositories.
Value Chain Analysis
The military biometrics value chain starts with sensor and component suppliers, including fingerprint, iris, facial imaging, and liveness or anti-spoof subsystems, as well as rugged device OEMs for handheld and fixed gate hardware. Secure element and cryptography providers sit alongside device manufacturers. Value creation then concentrates midstream in matching engines, middleware, and data-management layers that implement standards such as DoD EBTS and IDD, integrate with legacy defense identity systems, and provide audit, encryption, and chain-of-custody controls.
At the downstream end, prime contractors and specialized integrators package these elements into mobile kits, installation access solutions, and enterprise repositories, then deliver deployment, accreditation, training, and multi-year sustainment to defense agencies. Recent procurement signals indicate active sourcing across the chain, ranging from Army SBIR funding opportunities for biometric authentication solutions to contract activity tied to touchless modalities and mobile-kit sensor modules. The push to formalize tactical tools into acquisition pathways also shifts channel dynamics, including USSOCOM adopting Reveal Technology's Identifi as a program of record, which elevates the role of software, integration, and sustainment partners alongside hardware suppliers. As cloud and edge architectures coexist, suppliers with interoperability testing, secure DevSecOps update pipelines, and field support for austere environments tend to capture a larger share of service and refresh value over the program lifecycle.
Competitive Landscape
Market concentration is moderate. IDEMIA, Thales, NEC, HID Global, and Northrop Grumman collectively hold nearly 52% of the spend, sustained by 7- to 10-year refresh clauses and platform-wide service contracts. Hardware specialists emphasize sensor ruggedness while defense primes bundle biometrics with command-and-control suites. NATO’s ANSI/NIST-ITL 1-2024 mandate shifts the advantage toward software providers who can abstract hardware diversity, as seen in Aware’s 34% growth and M2SYS’s plug-in that reduces interoperability upgrade costs by 60%. Disruptors target gaps in the chain of custody, blockchain auditing, and anti-spoofing. DERMALOG incorporated blockchain audit trails, winning the German Federal Police award. HID Global patents pulse-oximetry spoof detection, and Thales lodged 14 multimodal-fusion patent applications between 2024 and 2025.[5] Airborne platforms and behavioral biometrics represent untapped pockets within the military biometrics market, with US Cyber Command piloting keystroke analytics for insider-threat defense. Software-defined architectures that enable over-the-air algorithm updates are eroding legacy vendor lock-in and expanding the competitive landscape.
Military Biometrics Industry Leaders
-
IDEMIA
-
Northrop Grumman Corporation
-
Thales Group
-
NEC Corporation
-
HID Global
- *Disclaimer: Major Players sorted in no particular order
Military Biometrics Market Companies Covered in this Report
- IDEMIA
- Thales Group
- HID Global (ASSA ABLOY group)
- NEC Corporation
- Aware, Inc.
- M2SYS
- Fulcrum Biometrics, Inc.
- Northrop Grumman Corporation
- Leidos, Inc.
- DERMALOG Identification Systems GmbH
- Parsons Corporation
- S.I.C. Biometrics Inc.
Market Opportunities and Future Outlook
Modernization programs create near-term whitespace for vendors that can bridge legacy systems into real-time, coalition-ready identity operations while meeting accuracy and interoperability requirements. In the United States, that shift is visible in field activity around the U.S. Army's Next Generation Biometric Collection Capability (NXGBCC) and USSOCOM fielding of Reveal Technology's Identifi. These programs drive demand for rugged edge kits, standardized data exchange, and software that supports faster matching and synchronization. Procurement emphasis on touchless and multimodal capture also expands opportunity in periocular and facial workflows that reduce friction at checkpoints and during tactical encounters.
Enterprise integration and sustainment are another clear opportunity, since agencies fund long-running performance work statements to modernize biometric and forensics collection infrastructure across commands. This favors providers that supply standards-conformant middleware (EBTS/IDD), secure cloud or hybrid deployment patterns, and audit-ready data governance that can accommodate privacy constraints without undermining interoperability. As programs transition from pilots to programs of record, vendors with validated interoperability test results, accredited security controls, and scalable sustainment models have more defined pathways to multi-year contract structures rather than single equipment buys.
Recent Industry Developments in Military Biometrics Market
- June 2026: Fielding of the Next Generation Biometric Collection Capability (NXGBCC) was initiated by the U.S. Army, pairing mobile and fixed collection with an Ares Gateway Transaction Manager and a government-provided AWS Impact Level 5 cloud environment. This accelerates migration from legacy collection workflows toward more standardized, near-real-time biometric transactions, raising the bar for interoperability, cybersecurity, and field support across deployed units.
- November 2025: Parsons Corporation announced a contract to modernize the U.S. Coast Guard Biometrics at Sea System (BASS 2.0) with a five-year performance period. The award strengthens maritime-domain identity screening by improving biometric collection and connectivity to broader databases, expanding demand for ruggedized capture, integration, and sustainment services at sea.
- October 2024: Leidos, Inc. received a six-year, USD 249 million Automated Installation Entry (AIE) Next Generation contract from the U.S. Army Contracting Command to improve security at 92 Army and select Joint-Service access points globally. The scope reinforces steady investment in fixed-installation biometrics and access-control integration, benefiting vendors that can deliver end-to-end deployment, system hardening, and lifecycle support.
Military Biometrics Market Report Scope and Research Methodology
Market Definition and Coverage
This market covers biometric solutions used by armed forces and defense agencies to identify, enroll, and verify people for security, access control, and operational use, across fixed sites and mobile or tactical environments, with revenue captured for related hardware and software.
Scope exclusions: It excludes civilian-only biometric programs and general consumer device authentication that is not procured for military use.
Segments Covered in This Report
- By Recognition Type
- Fingerprint Recognition
- Facial Recognition
- Iris Recognition
- Others
- By Solution
- Hardware (Scanners, Sensors, Portable Kits)
- Software (Matching Engines, Database, Middleware, Encryption)
- By Platform
- Land-Based Systems
- Naval Systems
- Airborne Systems
- By Deployment Environment
- Fixed Installations
- Mobile and Tactical
- By Geography
- North America
- United States
- Canada
- Mexico
- South America
- Brazil
- Rest of South America
- Europe
- United Kingdom
- Germany
- France
- Russia
- Rest of Europe
- Asia-Pacific
- China
- India
- Japan
- South Korea
- Rest of Asia-Pacific
- Middle East and Africa
- Middle East
- United Arab Emirates
- Saudi Arabia
- Rest of Middle East
- Africa
- Egypt
- Rest of Africa
- Middle East
- North America
Data Sources, Market Sizing, and Validation
Desk Research
Desk work starts by building a clean map of where military biometric demand shows up, then tying it to measurable signals. We use public defense budget documents and procurement disclosures, along with official trade and customs statistics where relevant for components and devices moving across borders.
To ground definitions and technical boundaries, we also refer to sources such as NIST biometric performance and evaluation publications, government accountability and audit reports, standards bodies documentation, and peer-reviewed journals on biometric accuracy and spoof resistance. Company filings, investor presentations, contract award announcements, and trusted press are reviewed to understand program timing and refresh cycles. Select paid subscriptions are used only to speed up company financials, patent lookups, and contract and tender scanning. These sources are not exhaustive, and other public references are used for data collection, cross-checks, and clarification.
Primary Interviews and Surveys
Primary inputs are collected through expert calls and structured questionnaires with defense system integrators, biometric solution providers, component specialists, and procurement or program stakeholders. Since demand varies by threat level and deployment patterns, we cover APAC, EMEA, and the Americas, and then re-check assumptions on adoption pace, replacement timing, and typical pricing bands before finalizing the model.
Distribution of primary research fieldwork respondents
| Company type | Respondent position | Region |
|---|---|---|
| Top tier: 39% | CXOs: 14% | APAC: 49% |
| Mid tier: 47% | Functional/Unit leaders: 29% | EMEA: 31% |
| Smaller Players: 14% | Managers: 57% | Americas: 20% |
Market-Sizing & Forecasting
The core sizing uses a top-down build that reconstructs demand from defense spending priorities, active program footprints, and the share of budgets typically allocated to identity and access systems. To keep it practical, totals are then corroborated with selective bottom-up approximations, such as sampled contract values, shipment and deployment references, and a simple ASP times volume check for common device types.
Key inputs that shape the model include the installed base of fixed installations versus mobile or tactical kits, the mix of recognition modalities used in programs (for example fingerprint, facial, and iris), typical refresh and recertification cycles tied to multi-year contracts, platform demand signals across land, naval, and airborne deployments, and pricing movement driven by sensor cost trends and software feature upgrades. When direct volume is not visible, gaps are handled by using proxy ratios from similar programs and then validating those ratios in interviews.
For forecasting, scenario analysis is used around modernization pace and procurement timing, guided by expert consensus on budget stability, program expansion, and deployment priorities by region. A short set of sensitivity checks is applied so unusually large jumps can be traced back to one or two clear drivers.
Data Validation & Update Cycle
Outputs are checked against independent signals such as announced contract awards, disclosed program timelines, and regional defense spending direction, so the final totals do not drift away from actual procurement behavior. We also run variance checks across regions, platforms, and solution types to catch inconsistencies, followed by a second analyst review before sign-off.
Reports are refreshed annually, and interim updates are triggered when material events occur, such as major contract wins, sudden budget reallocations, or changes in security policy that affect enrollment and verification needs. Before delivery, the model receives a fresh pass so clients get the most current view available at that time.
Mordor Intelligence's Military Biometrics Market Estimate Compared With Other Published Estimates
Published market sizes for military biometrics can look far apart, even when they are talking about the same general theme, because scope and timing choices differ. The biggest drivers tend to be which revenues are counted (hardware only versus hardware plus software), whether mobile and tactical deployments are treated separately, and how currency timing is handled for multi-year defense contracts.
By tracking contract refresh cycles and platform-level deployments, Mordor Intelligence keeps the model tied to military procurement programs, while some estimates appear to blend adjacent homeland security demand or apply broad biometric penetration assumptions without the same program gating. Differences also come from the stated base year, the forecast horizon used, and whether the study is updated after major tender announcements that change the near-term run rate.
Benchmark comparison
| Source | Market Size | Gaps in Research Methodology |
|---|---|---|
| Mordor Intelligence | USD 10.68 B (2026) | |
| Global Consultancy A | USD 7.76 B (2025) | Uses an earlier base year and a longer horizon, and the boundary appears to treat some defense biometrics as part of a broader identity stack, which can shift what is counted as in-scope revenue. |
| Trade Publisher B | USD 8.01 B (2024) | Anchors the number on a different year and may emphasize technology-only splits, which can undercount recurring software and integration work that is typically bundled into defense program awards. |
The spread across sources mostly comes down to year selection and what gets included around software and program services, not just different math. Our approach stays repeatable because each step is tied to visible procurement signals, a clear scope boundary, and a limited set of inputs that can be rechecked during updates.
Key Questions Answered in the Report
What is the expected value of the military biometrics market in 2031?
The market is forecast to reach USD 14.83 billion by 2031 at a 6.80% CAGR.
Which biometric modality currently holds the largest revenue share?
Fingerprint systems led with 44.67% of revenue in 2025.
Which region is projected to grow the fastest through 2031?
Asia-Pacific is expanding at an 8.32% CAGR due to large-scale deployments in India, China, and Japan.
How dominant are mobile and tactical deployments?
They accounted for 62.89% of 2025 revenue and continue to rise as border and counterinsurgency missions expand.
Which companies lead market share?
IDEMIA, Thales, NEC, HID Global, and Northrop Grumman collectively hold about 52% of spending.
What technology shift is driving software growth?
AI-enabled matching engines that lift accuracy to 98% without replacing existing sensors fuel the 9.91% CAGR in software sales.