Market Overview
| Study Period | 2017 - 2030 |
|---|---|
| Base Year For Estimation | 2024 |
| Forecast Data Period | 2025 - 2030 |
| Market Size (2025) | USD 1.57 Billion |
| Market Size (2030) | USD 2.15 Billion |
| Growth Rate (2025 - 2030) | 6.51% CAGR |
| Market Concentration | Low |
Major Players*Disclaimer: Major Players sorted in no particular order Image © Mordor Intelligence. Reuse requires attribution under CC BY 4.0. | |

Middle East Protein Market Analysis by Mordor Intelligence
The Middle East Protein Market size is estimated at 1.57 billion USD in 2025, and is expected to reach 2.15 billion USD by 2030, growing at a CAGR of 6.51% during the forecast period (2025-2030).
The Middle East protein market is experiencing a significant transformation driven by changing consumer preferences and lifestyle patterns. A notable shift towards plant-based proteins, flexitarian, and reducetarian diets has reshaped the industry landscape, with plant proteins accounting for 82% of application volume in 2023. This transition is particularly evident in urban centers where health consciousness and environmental awareness are driving consumer choices. The region's growing health and wellness sector has created new opportunities for protein manufacturers, with fitness centers and wellness facilities expanding their presence across major cities. The trend is further reinforced by increasing obesity rates, with recent statistics showing that 70% of men and 67% of women over 15 in the UAE are classified as obese in 2023.
The sports and fitness segment has emerged as a significant driver of protein consumption in the Middle East. In Saudi Arabia, 48.2% of the population engages in physical activities for at least 30 minutes daily, creating a substantial market for protein supplements and fortified products. Among active individuals, 56.1% consume protein supplements specifically for muscle gain, while 28.6% use them to address protein deficiency. This growing fitness culture has prompted manufacturers to develop specialized protein products tailored to different athletic needs and performance goals, leading to innovations in product formulations and delivery formats.
The region is witnessing a surge in plant-based protein innovations, particularly in response to the growing vegan population. As of early 2023, the UAE recorded approximately 9.5 million vegans, creating a robust market for plant-based protein alternatives. Major food manufacturers are investing in research and development to create new plant-based protein products that cater to local tastes and dietary preferences. This trend has led to the development of innovative protein sources and novel applications in traditional Middle Eastern cuisine, with particular emphasis on soy, pea, and wheat proteins.
The personal care and cosmetics sector has emerged as an innovative application area for proteins, particularly in premium and natural product formulations. Companies like Estee Lauder, Neu Cosmetics DMCC, and Guerlain are intensifying their R&D investments to develop effective and sustainable protein-based ingredients for cosmetic applications. The demand for protein-enriched personal care products is driven by increasing consumer awareness about the benefits of proteins in skin and hair care. This trend has led to the development of specialized protein formulations for various cosmetic applications, from anti-aging products to hair care solutions, with particular emphasis on collagen, elastin, and keratin-based products.
Middle East Protein Market Trends and Insights
The inclination toward a protein-rich diet supports growing consumption
- In the Middle East, Saudi Arabia emerged as the dominant player, commanding over 70% of the region's dairy market. This stronghold is propelled by a confluence of factors: a surging appetite for dairy products, a growing health-conscious consumer base, and a heightened interest in sports and nutrition, especially among the younger demographic. Whey snacks, with their diverse flavors, nutritional benefits, portability, and longer shelf life, are carving a niche as a favored snack choice. They appeal not only to millennials seeking quick bites but also to seniors eyeing protein-rich diets.
- Across the Middle East, a rising emphasis on sports nutrition and supplements is evident. The proliferation of fitness centers, equipped with cutting-edge facilities and personalized training, is luring in more consumers. In the UAE, obesity rates are strikingly high, with approximately 70% of men and 67% of women over 15 falling into this category. The region's heightened focus on sports nutrition, which now constitutes 70% of the market, is a direct response to combatting this obesity trend.
- The UAE stands out for its robust appetite for collagen-infused functional foods and beverages. Energy and beauty drinks, enriched with high-protein collagen peptides, are gaining traction, not just in the UAE but also in neighboring markets like Tunisia and Algeria. These beverages are increasingly viewed as alternatives to traditional leisure drinks, thanks to their elevated caffeine content. Noteworthy is the UAE's reliance on imports, sourcing collagen predominantly from Japan and Australia, with a notable preference for sheep-based variants. Meanwhile, in Saudi Arabia, a rising trend is observed: a surge in supplement consumption, especially among those frequenting fitness centers.

Understand The Key Trends Shaping This Market
Download PDF
GCC countries to focus more on increasing production capabilities of milk and meat
- In the Middle East, the production of various raw materials, including fresh or chilled meat of chickens, pigs, and cattle, along with raw milk from cattle and goats, skim milk from cows, and derivatives like whey, was depicted in the graph. Specifically, the United Arab Emirates stood out, producing 164,934 TT of milk in 2020. The country's milk output saw a significant uptick, hitting 164,934 TT in 2020. Notably, its annual growth rate, which peaked at 22.05% in 2009, tapered off to 1.06% by 2020. Challenges like harsh climates and nascent cold chain technology in the region hamper this segment's growth.
- Overcoming these hurdles requires not only embracing cutting-edge dairy farming tech but also implementing key herd and farm management practices. Bulk orders secure the best prices for dairy products. In 2020, the growth rate of animal protein surged to 10%, doubling the historical 5-year average of 5%. Additionally, by utilizing meat and marine industry waste, animal proteins like collagen and gelatin are produced. However, it's worth noting that slaughterhouses in the Middle East have garnered a poor reputation among animal welfare advocates.
- Live animal exports to the Middle East have seen a steady climb over the last two decades, with Europe and Australia being notable contributors. For instance, in 2019, Western Australia shipped 1.0 million live sheep to nine countries, predominantly in the Middle East, fetching a value of AUD 136 million. Among these, Kuwait, Qatar, and Jordan emerged as the top importers, accounting for 35%, 25%, and 19% of the volume, respectively. This surge in demand is largely attributed to the region's increasing appetite for meat and dairy, coupled with the mounting pressure from a warming climate in these water-stressed nations.

Understand The Key Trends Shaping This Market
Download PDF
OTHER KEY INDUSTRY TRENDS COVERED IN THE REPORT
- Low nutrition profile in babies is boosting the demand for baby supplements
- Declining alcohol consumption is driving the demand for healthy beverages
- Functional ingredients, rich sauces, dressings, and condiments attract consumer attention
- Health awareness is highly impacting the market
- The rising aging population is driving the market
- Healthy snacking is increasing across the Middle Eastern countries
- Compound feed to hold major share in the market
- Plant protein consumption to witness steady growth with a rise in health-conscious population across the Middle East
- Sales of artisanal bakery products are expected to drive the bakery market
- On-the-go breakfast cereals are in high demand
- Demand for chocolate is driving the confectionery segment
- Rising aging population is driving the market
- Ready-to-eat (RTE) food products for dinner are gaining prominence
- Initiatives of the Middle Eastern governments are boosting growth
- Increasing spending on personal care is driving the market
- Saudi Arabia and Iran lead the Middle Eastern market in terms of plant protein production
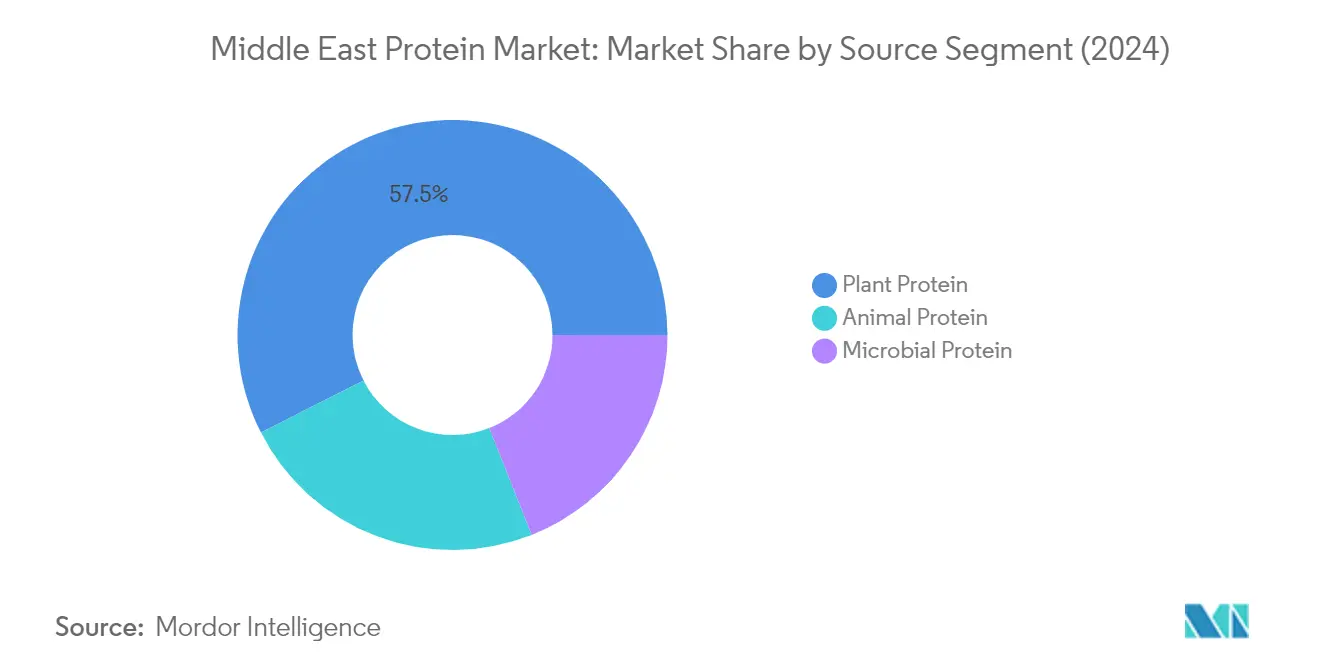
Segment Analysis: Source
Plant Protein Segment in Middle East Protein Market
Plant protein dominates the Middle East protein market, commanding approximately 57% market share in 2024. This significant market position is primarily driven by the rising demand for plant-based alternatives across food and beverage applications, particularly in meat and dairy alternatives. The segment's growth is further bolstered by increasing consumer awareness of health benefits associated with plant proteins, disseminated through various platforms. The region's robust consumer purchasing power and growing appetite for organic products have prompted regional companies to increasingly turn to naturally derived protein ingredients. Soy protein leads this segment, particularly in the meat alternatives industry, where it serves as a key component due to its superior gelation properties.
Animal Protein Segment in Middle East Protein Market
The animal protein segment is projected to exhibit the strongest growth trajectory in the Middle East protein market during 2024-2029, with an expected CAGR of approximately 6%. This accelerated growth is primarily driven by the increasing demand for milk proteins in both supplements and food and beverage segments. The segment's expansion is further supported by a rising preference for collagen-based supplements and skincare products in the region. The growth is particularly notable in the UAE and Saudi Arabia, where there is a strong emphasis on sports nutrition and supplements. The segment's growth is also bolstered by the increasing adoption of protein-fortified foods and the rising demand for premium food formulations.
Remaining Segments in Source Segmentation
The microbial protein segment, while smaller compared to plant and animal proteins, plays a crucial role in the Middle East protein market. This segment includes proteins derived from sources like algae and mycoprotein, offering sustainable alternatives to traditional protein sources. The segment is gaining traction due to its ability to be produced under normal conditions without being affected by land shortages or environmental limitations such as drought or flood. Microbial proteins are particularly valuable as they can be produced with minimal environmental impact and serve as good sources of vitamins, carotenes, and carbohydrates, making them increasingly relevant in the region's pursuit of food security and sustainability.
Segment Analysis: End User
Food & Beverages Segment in Middle East Protein Market
The Food & Beverages segment maintains its dominant position in the Middle East protein market, commanding approximately 62% market share in 2024. This substantial market presence is primarily driven by the rising demand for protein-fortified foods and beverages across the region. The segment's growth is particularly notable in meat and meat alternatives, dairy alternatives, and bakery sub-segments, which collectively account for about 75% of the segment's value. The increasing consumer preference for vegan meat products, crafted from soy, rice, pea, and other plant-based proteins to match meat's protein content, has significantly contributed to this segment's leadership. Additionally, the growing appetite for healthy options and protein-fortified foods among Middle Eastern consumers, especially among Arab millennials who actively seek convenient food options, has further strengthened this segment's market position.
Personal Care & Cosmetics Segment in Middle East Protein Market
The Personal Care & Cosmetics segment is emerging as the fastest-growing sector in the Middle East protein market, projected to achieve approximately 7% CAGR during 2024-2029. This remarkable growth is fueled by extensive marketing efforts, rapid expansion of e-commerce channels, and increasing popularity of men's grooming products in the region. The segment's expansion is particularly notable in countries like Iran, where women have shown a growing inclination toward skincare and cosmetics products. Collagen has emerged as the dominant protein in this segment, commanding a significant volume share of nearly 35% in 2023, primarily due to its moisturizing, regenerating, and film-forming attributes. The rising demand for cruelty-free, vegetarian, and vegan beauty products, particularly among the Gen-Z demographic, is further accelerating this segment's growth trajectory.
Remaining Segments in End User Segmentation
The Animal Feed and Supplements segments complete the market landscape, each serving distinct but crucial roles in the Middle East protein market. The Animal Feed segment is largely driven by the application of sustainable plant proteins, mainly soy and wheat proteins, valued for their health benefits, excellent digestibility, and neutral flavor profile. The Supplements segment, on the other hand, caters to specialized nutrition needs, particularly in baby food, infant formula, and sports nutrition applications. Both segments benefit from increasing health consciousness among consumers and growing awareness about the importance of protein in various applications, from livestock nutrition to human dietary supplements.
Middle East Protein Market Geography Segment Analysis
Protein Market in Saudi Arabia
Saudi Arabia dominates the Middle Eastern protein market, commanding approximately 59% of the total market volume in 2024. The kingdom's protein sector in Saudi Arabia is primarily driven by its robust food and beverage sector, particularly in meat alternatives and dairy products. The country's increasing focus on health and wellness, coupled with rising gym memberships and fitness awareness, has spurred demand for protein-enriched products. The government's support for domestic protein production, especially in the plant protein segment, has attracted significant investments from both local and international players. The market is further bolstered by the country's large young population and their growing preference for protein-fortified convenience foods. Saudi Arabia's strategic initiatives to diversify its economy beyond oil have led to increased investments in food processing and manufacturing sectors, creating a favorable environment for protein ingredients manufacturers.
Protein Market in Iran
Iran's protein market is poised for remarkable growth, with a projected CAGR of approximately 9% from 2024 to 2029. The country's protein landscape is undergoing a significant transformation, driven by increasing health consciousness and a growing focus on nutritional enrichment. Iran's strong domestic agricultural base, particularly in plant protein sources, has positioned it as a key player in the regional market. The country's food processing industry is rapidly evolving, with manufacturers increasingly incorporating protein ingredients into various product formulations. The rising prevalence of obesity and lifestyle-related health issues has led to increased consumer awareness about protein-rich diets. Iran's protein market is particularly strong in the plant protein segment, with soy and wheat proteins dominating the landscape. The government's efforts to promote self-sufficiency in food production have further catalyzed the growth of the domestic protein industry.
Protein Market in United Arab Emirates
The United Arab Emirates represents a dynamic and sophisticated protein market in the UAE, characterized by its innovative product launches and strong consumer acceptance of novel protein sources. The country's protein landscape is heavily influenced by its large expatriate population, which has created a diverse demand for various protein types and applications. The UAE's focus on health and wellness, particularly in major cities like Dubai and Abu Dhabi, has led to increased consumption of protein-enriched products. The market is witnessing a significant shift towards plant-based proteins, with local companies developing production units for plant-based foods. The country's robust retail infrastructure and growing e-commerce penetration have made protein products more accessible to consumers. The UAE's strategic position as a regional trade hub has attracted numerous international protein ingredient manufacturers, fostering a competitive and innovative market environment.
Protein Market in Other Middle Eastern Countries
The protein market in other Middle Eastern countries, including Kuwait, Bahrain, Qatar, and Oman, exhibits diverse characteristics shaped by their unique demographic and economic conditions. These markets are witnessing growing interest in both traditional and innovative protein applications, particularly in the functional foods and supplements segments. The increasing health consciousness and rising disposable incomes in these countries have led to greater demand for premium protein products. The markets are characterized by strong distribution networks and modern retail infrastructure, facilitating the availability of protein-enriched products. Religious and cultural factors, particularly the requirement for halal certification, continue to influence product development and market strategies. These countries also show growing interest in sports nutrition and wellness products, driving demand for specialized protein ingredients.
Get Analysis on Important Geographic Markets
Download PDF
Competitive Landscape
Top Companies in Middle East Protein Market
The Middle East protein market features prominent players like Fonterra Co-operative Group, International Flavors & Fragrances (IFF), Royal FrieslandCampina, and Kerry Group leading the competitive landscape. Companies are heavily investing in product innovations, particularly in plant-based proteins and specialized nutritional solutions, to meet evolving consumer preferences and dietary requirements. Operational agility is demonstrated through strategic manufacturing facility expansions across key regional markets like Saudi Arabia and the UAE, enabling better market penetration and reduced supply chain complexities. Market leaders are actively pursuing strategic partnerships and collaborations with local distributors and manufacturers to strengthen their regional presence. The competitive dynamics are further shaped by continuous R&D investments in new protein formulations, sustainable sourcing practices, and the development of application-specific solutions for various end-user industries.
Fragmented Market with Strong Global Players
The Middle East protein industry exhibits a fragmented structure with a mix of global conglomerates and specialized regional players competing for market share. Global players leverage their extensive R&D capabilities, diverse product portfolios, and established distribution networks to maintain their market positions, while regional specialists focus on niche segments and local consumer preferences. The market is characterized by ongoing consolidation activities, as evidenced by significant mergers and acquisitions like the DuPont Nutrition & Biosciences merger with IFF, which has reshaped the competitive landscape.
The market demonstrates a dynamic environment where companies are increasingly focusing on vertical integration and strategic partnerships to enhance their value chain control. Major players are establishing regional manufacturing facilities and innovation centers to better serve the Middle Eastern market while simultaneously pursuing acquisitions of local companies to expand their product offerings and geographical reach. The competitive intensity is further amplified by the entry of new players, particularly in the plant-based protein segment, leading to increased market fragmentation and diversification of product offerings.
Innovation and Localization Drive Future Success
Success in the Middle East protein market increasingly depends on companies' ability to combine innovation with localization strategies. Market leaders are focusing on developing halal-certified products, establishing local production facilities, and creating region-specific formulations to meet unique consumer preferences and regulatory requirements. Companies are also investing in sustainable production practices and transparent supply chains to address growing environmental concerns and build consumer trust. The ability to adapt to changing consumer preferences, particularly the shift towards plant-based proteins and clean-label products, while maintaining cost competitiveness, will be crucial for market success.
Future market dynamics will be shaped by companies' ability to navigate regulatory complexities, particularly regarding food safety and labeling requirements. Success factors include developing strong relationships with local distributors, investing in digital capabilities for better market reach, and maintaining flexibility in product formulations to address varying consumer needs across different Middle Eastern countries. Companies must also focus on building strong brand equity through consistent quality, innovative product development, and effective marketing strategies. The ability to manage raw material costs while maintaining product quality and meeting increasing demand for protein ingredients and protein derivatives will be critical for sustained growth in the market.
Middle East Protein Industry Leaders
Cargill, Incorporated
Fonterra Co-operative Group Limited
International Flavors & Fragrances Inc.
Kerry Group PLC
Royal FrieslandCampina NV
- *Disclaimer: Major Players sorted in no particular order

Need More Details on Market Players and Competitors?
Download PDF
Recent Industry Developments
- August 2024: Global dairy co-operative Fonterra and natural ingredient manufacturer Superbrewed Food have teamed up to boost sustainable food production. The partnership combines Superbrewed’s biomass protein platform with Fonterra’s dairy processing, ingredients, and application expertise to develop additional nutrient-rich, functional biomass protein.
- February 2024: Cargill has signed a commercial agreement that enables it to use and market ENOUGH's proprietary ABUNDA Protein and is also investing in the firm's series C Funding.
- February 2024: Cargill has signed a commercial agreement that enables it to use and market ENOUGH's proprietary ABUNDA Protein and is also investing in the firm's series C Funding.
Middle East Protein Market Report Scope
Animal, Microbial, Plant are covered as segments by Source. Animal Feed, Food and Beverages, Personal Care and Cosmetics, Supplements are covered as segments by End User. Iran, Saudi Arabia, United Arab Emirates are covered as segments by Country.Source
| Animal | By Protein Type | Casein and Caseinates |
| Collagen | ||
| Egg Protein | ||
| Gelatin | ||
| Insect Protein | ||
| Milk Protein | ||
| Whey Protein | ||
| Other Animal Protein | ||
| Microbial | By Protein Type | Algae Protein |
| Mycoprotein | ||
| Plant | By Protein Type | Hemp Protein |
| Pea Protein | ||
| Potato Protein | ||
| Rice Protein | ||
| Soy Protein | ||
| Wheat Protein | ||
| Other Plant Protein |
End User
| Animal Feed | ||
| Food and Beverages | By Sub End User | Bakery |
| Beverages | ||
| Breakfast Cereals | ||
| Condiments/Sauces | ||
| Confectionery | ||
| Dairy and Dairy Alternative Products | ||
| Meat/Poultry/Seafood and Meat Alternative Products | ||
| RTE/RTC Food Products | ||
| Snacks | ||
| Personal Care and Cosmetics | ||
| Supplements | By Sub End User | Baby Food and Infant Formula |
| Elderly Nutrition and Medical Nutrition | ||
| Sport/Performance Nutrition | ||
Country
| Iran |
| Saudi Arabia |
| United Arab Emirates |
| Rest of Middle East |
| Source | Animal | By Protein Type | Casein and Caseinates |
| Collagen | |||
| Egg Protein | |||
| Gelatin | |||
| Insect Protein | |||
| Milk Protein | |||
| Whey Protein | |||
| Other Animal Protein | |||
| Microbial | By Protein Type | Algae Protein | |
| Mycoprotein | |||
| Plant | By Protein Type | Hemp Protein | |
| Pea Protein | |||
| Potato Protein | |||
| Rice Protein | |||
| Soy Protein | |||
| Wheat Protein | |||
| Other Plant Protein | |||
| End User | Animal Feed | ||
| Food and Beverages | By Sub End User | Bakery | |
| Beverages | |||
| Breakfast Cereals | |||
| Condiments/Sauces | |||
| Confectionery | |||
| Dairy and Dairy Alternative Products | |||
| Meat/Poultry/Seafood and Meat Alternative Products | |||
| RTE/RTC Food Products | |||
| Snacks | |||
| Personal Care and Cosmetics | |||
| Supplements | By Sub End User | Baby Food and Infant Formula | |
| Elderly Nutrition and Medical Nutrition | |||
| Sport/Performance Nutrition | |||
| Country | Iran | ||
| Saudi Arabia | |||
| United Arab Emirates | |||
| Rest of Middle East | |||
Need A Different Region or Segment?
Customize Now
Market Definition
- End User - The Protein Ingredients Market operates on a B2B basis. Food, Beverages, Supplements, Animal Feed, and Personal Care & Cosmetic manufacturers are considered to be end-consumers in the market studied. The scope excludes manufacturers buying liquid/dry whey to be used for application as a binding agent or thickener or other non-protein applications.
- Penetration Rate - Penetration Rate is defined as the percentage of Protein-Fortified End User Market Volume in the Overall End User Market Volume.
- Average Protein Content - Average protein content is the average protein content present per 100 g of product manufactured by all end-user companies considered under the scope of this report.
- End User Market Volume - End-user market volume is the consolidated volume of all types and forms of end-user products in the country or region.
| Keyword | Definition |
|---|---|
| Alpha-lactalbumin (α-Lactalbumin) | It is a protein that regulates the production of lactose in the milk of almost all mammalian species. |
| Amino acid | It is an organic compound that contains both amino and carboxylic acid functional groups, which are required for the synthesis of body protein and other important nitrogen-containing compounds, such as creatine, peptide hormones, and some neurotransmitters. |
| Blanching | It is the process of briefly heating vegetables with steam or boiling water. |
| BRC | British Retail Consortium |
| Bread improver | It is a flour-based blend of several components with specific functional properties designed to modify dough characteristics and give quality attributes to bread. |
| BSF | Black Soldier Fly |
| Caseinate | It is a substance produced by adding an alkali to acid casein, a derivative of casein. |
| Celiac disease | Celiac disease is an immune reaction to eating gluten, a protein found in wheat, barley, and rye. |
| Colostrum | It is a milky fluid that’s released by mammals that have recently given birth before breast milk production begins. |
| Concentrate | It is the least processed form of protein and has a protein content ranging from 40-90% by weight. |
| Dry protein basis | It refers to the percentage of "pure protein" present in a supplement after the water in it is completely removed through heat. |
| Dry whey | It is the product resulting from drying fresh whey which has been pasteurized and to which nothing has been added as a preservative. |
| Egg protein | It is a mixture of individual proteins, including ovalbumin, ovomucoid, ovoglobulin, conalbumin, vitellin, and vitellenin. |
| Emulsifier | It is a food additive that facilitates the blending of foods that are immiscible with one another, such as oil and water. |
| Enrichment | It is the process of addition of micronutrients that are lost during the processing of the product. |
| ERS | Economic Research Service of the USDA |
| Extrusion | It is the process of forcing soft mixed ingredients through an opening in a perforated plate or die designed to produce the required shape. The extruded food is then cut to a specific size by blades. |
| Fava | Also known as Faba, it is another word for yellow split beans. |
| FDA | Food and Drug Administration |
| Flaking | It is a process in which typically a cereal grain (like corn, wheat, or rice) is broken down into grits, cooked with flavors and syrups, and then pressed into flakes between cooled rollers. |
| Foaming agent | It is a food ingredient that makes it possible to form or maintain a uniform dispersion of a gaseous phase in a liquid or solid food. |
| Foodservice | It refers to the part of the food industry which includes businesses, institutions, and companies which prepare meals outside the home. It includes restaurants, school and hospital cafeterias, catering operations, and many other formats. |
| Fortification | It is the deliberate addition of micronutrients that are not found in them naturally or which are lost during processing, to improve a food product's nutritional value. |
| FSANZ | Food Standards Australia New Zealand |
| FSIS | Food Safety and Inspection Service |
| FSSAI | Food Safety and Standards Authority of India |
| Gelling agent | It is an ingredient that functions as a stabilizer and thickener to provide thickening without stiffness through the formation of gel. |
| GHG | Greenhouse Gas |
| Gluten | It is a family of proteins found in grains, including wheat, rye, spelt, and barley. |
| Hemp | It is a botanical class of Cannabis sativa cultivars grown specifically for industrial or medicinal use. |
| Hydrolysate | It is a form of protein manufactured by exposing the protein to enzymes that can partially break the bonds between the protein's amino acids and break down large, complicated proteins into smaller pieces. Its processing makes it easier and quicker to digest. |
| Hypoallergenic | It refers to a substance that causes fewer allergic reactions. |
| Isolate | It is the purest and most processed form of protein which has undergone separation to obtain a pure protein fraction. It typically contains ≥ 90% of protein by weight. |
| Keratin | It is a protein that helps form hair, nails, and the outer layer of skin. |
| Lactalbumin | It is the albumin contained in milk and obtained from whey. |
| Lactoferrin | It is an iron‑binding glycoprotein that is present in the milk of most mammals. |
| Lupin | It is the yellow legume seeds of the genus Lupinus. |
| Millenial | Also known as Generation Y or Gen Y, it refers to the people born from 1981 to 1996. |
| Monogastric | It refers to an animal with a single-compartmented stomach. Examples of monogastric include humans, poultry, pigs, horses, rabbits, dogs, and cats. Most monogastric are generally unable to digest much cellulose food materials such as grasses. |
| MPC | Milk protein concentrate |
| MPI | Milk protein isolate |
| MSPI | Methylated soy protein isolate |
| Mycoprotein | Mycoprotein is a form of single-cell protein, also known as fungal protein, derived from fungi for human consumption. |
| Nutricosmetics | It is a category of products and ingredients that act as nutritional supplements to care for skin, nails, and hair natural beauty. |
| Osteoporosis | It is a medical condition in which the bones become brittle and fragile from loss of tissue, typically as a result of hormonal changes, or deficiency of calcium or vitamin D. |
| PDCAAS | Protein digestibility-corrected amino acid score (PDCAAS) is a method of evaluating the quality of a protein based on both the amino acid requirements of humans and their ability to digest it. |
| Per-capita consumption of animal protein | It is the average amount of animal protein (such as milk, whey, gelatin, collagen, and egg proteins) that is readily available for consumption by each person in an actual population. |
| Per-capita consumption of plant protein | It is the average amount of plant protein (such as soy, wheat, pea, oat, and hemp proteins) that is readily available for consumption by each person in an actual population. |
| Quorn | It is a microbial protein manufactured using mycoprotein as an ingredient, in which the fungus culture is dried and mixed with egg albumen or potato protein, which acts as a binder, and then is adjusted in texture and pressed into various forms. |
| Ready-to-Cook (RTC) | It refers to food products that include all of the ingredients, where some preparation or cooking is required through a process that is given on the package. |
| Ready-to-Eat (RTE) | It refers to a food product prepared or cooked in advance, with no further cooking or preparation required before being eaten. |
| RTD | Ready-to-Drink |
| RTS | Ready-to-Serve |
| Saturated fat | It is a type of fat in which the fatty acid chains have all single bonds. It is generally considered unhealthy. |
| Sausage | It is a meat product made of finely chopped and seasoned meat, which may be fresh, smoked, or pickled and which is then usually stuffed into a casing. |
| Seitan | It is a plant-based meat substitute made out of wheat gluten. |
| Softgel | It is a gelatin-based capsule with a liquid fill. |
| SPC | Soy protein concentrate |
| SPI | Soy protein isolate |
| Spirulina | It is a biomass of cyanobacteria that can be consumed by humans and animals. |
| Stabilizer | It is an ingredient added to food products to help maintain or enhance their original texture, and physical and chemical characteristics. |
| Supplementation | It is the consumption or provision of concentrated sources of nutrients or other substances that are intended to supplement nutrients in the diet and is intended to correct nutritional deficiencies. |
| Texturant | It is a specific type of food ingredient that is used to control and alter the mouthfeel and texture of food and beverage products. |
| Thickener | It is an ingredient that is used to increase the viscosity of a liquid or dough and make it thicker, without substantially changing its other properties. |
| Trans fat | Also called trans-unsaturated fatty acids or trans fatty acids, it is a type of unsaturated fat that naturally occurs in small amounts in meat. |
| TSP | Textured soy protein |
| TVP | Textured vegetable protein |
| WPC | Whey protein concentrate |
| WPI | Whey protein isolate |
Need More Details on Market Definition?
Ask a Question
Research Methodology
Mordor Intelligence follows a four-step methodology in all our reports.
- Step-1: Identify Key Variables: The quantifiable key variables (industry and extraneous) pertaining to the specific product segment and country are selected from a group of relevant variables & factors based on desk research & literature review; along with primary expert inputs. These variables are further confirmed through regression modeling (wherever required).
- Step-2: Build a Market Model: In order to build a robust forecasting methodology, the variables and factors identified in Step-1 are tested against available historical market numbers. Through an iterative process, the variables required for market forecast are set and the model is built on the basis of these variables.
- Step-3: Validate and Finalize: In this important step, all market numbers, variables and analyst calls are validated through an extensive network of primary research experts from the market studied. The respondents are selected across levels and functions to generate a holistic picture of the market studied.
- Step-4: Research Outputs: Syndicated Reports, Custom Consulting Assignments, Databases & Subscription Platforms

Get More Details On Research Methodology
Download PDF


