
Market Overview
| Study Period | 2020 - 2031 |
|---|---|
| Forecast Data Period | 2026 - 2031 |
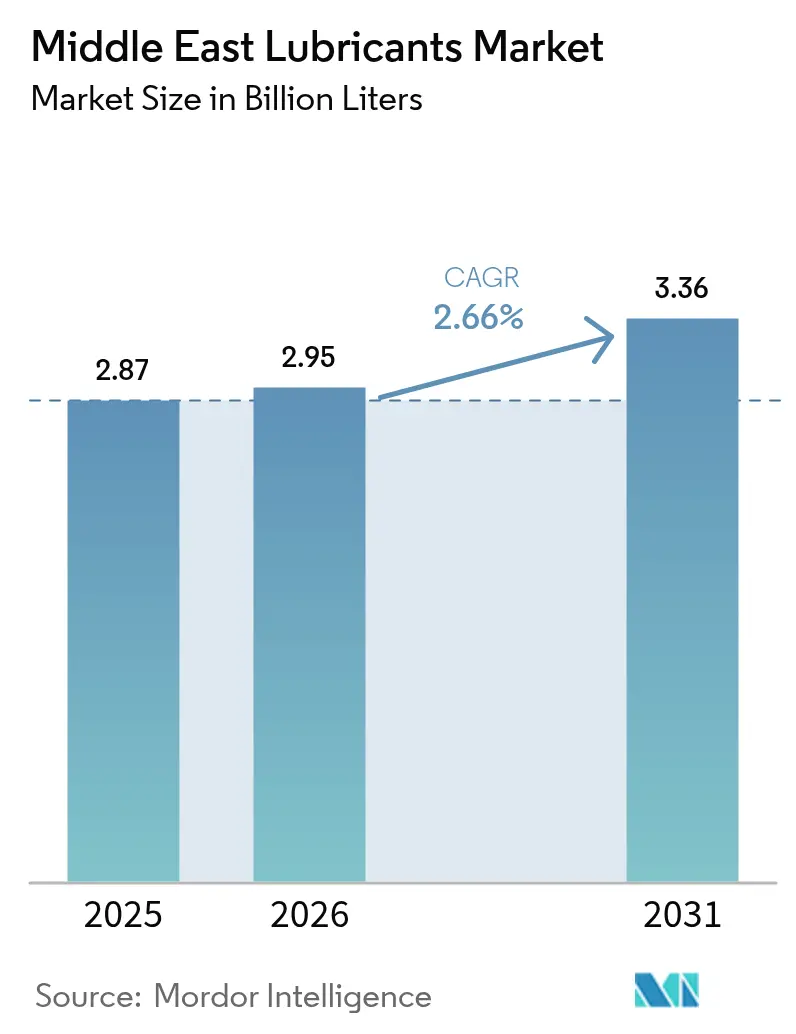
| Base Year Market Size (2025) | 2.87 Billion liters |
| Market Volume (2026) | 2.95 Billion liters |
| Market Volume (2031) | 3.36 Billion liters |
| Growth Rate (2026 - 2031) | 2.66 % |
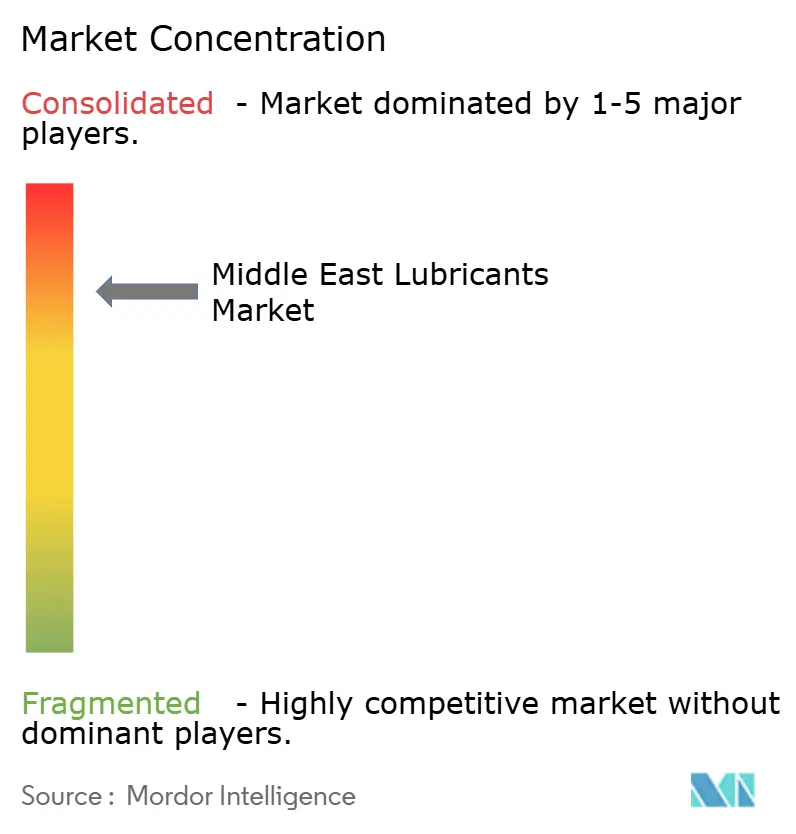
| Market Concentration | High |
Major Players *Disclaimer: Major Players sorted in no particular order Image © Mordor Intelligence. Reuse requires attribution under CC BY 4.0. | |
Middle East Lubricants Market Analysis by Mordor Intelligence
The Middle East Lubricants Market size was valued at 2.87 billion liters in 2025 and estimated to grow from 2.95 billion liters in 2026 to reach 3.36 billion liters by 2031, at a CAGR of 2.66% during the forecast period (2026-2031). This measured trajectory illustrates how diversified industrial programs such as Saudi Vision 2030, Operation 300bn in the United Arab Emirates (UAE), and New Kuwait 2035 are enlarging the demand base while the region’s legacy hydrocarbon infrastructure delivers feedstock and processing advantages. Extended build-outs in petrochemicals, power generation, and logistics corridors continue to elevate lubricant volumes even as longer drain intervals temper unit consumption. Suppliers that localize blending and packaging under 70% iktva content rules enjoy price and lead-time advantages over import-reliant rivals, and this encourages capacity additions in Yanbu, Jebel Ali, and Sohar. Product mix is also shifting: transmission and hydraulic fluids, metalworking oils, and specialty turbine lubricants are outpacing engine oils as the Gulf’s construction machinery fleet grows, renewable energy plants ramp up, and gas turbines replace aging oil-fired power units. Competitive intensity remains moderate; international majors retain technical leadership and certification breadth, yet regional producers that secure halal formulations and API approvals are narrowing the gap.
Key Report Takeaways
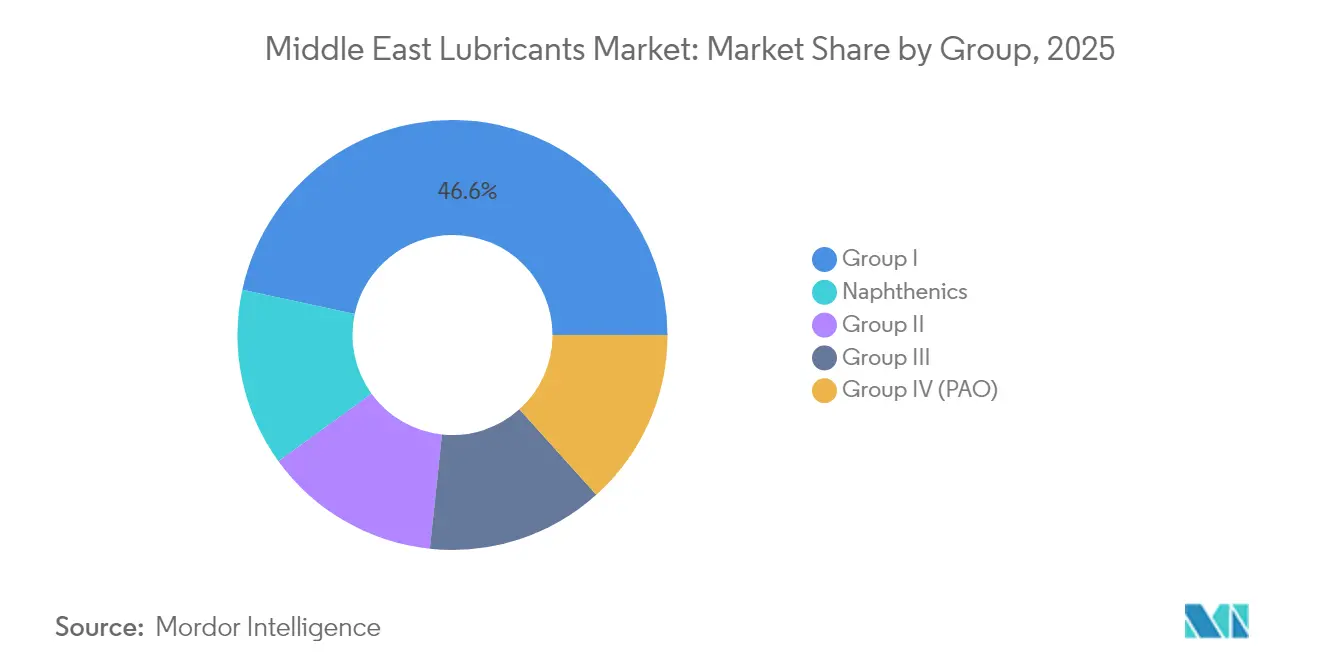
- By Group, Group I captured 46.62% of the Middle East lubricants market share in 2025; Group III is projected to expand at a 2.97% CAGR through 2031.
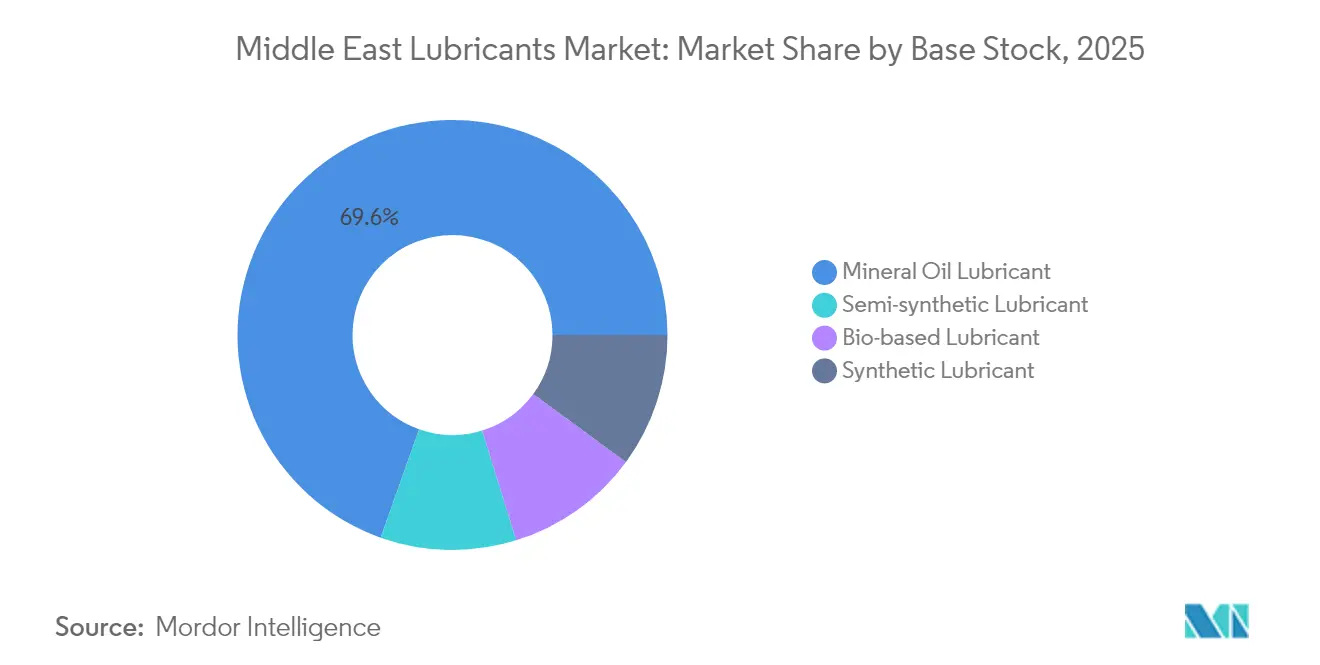
- By Base Stock, Mineral oils accounted for 69.58% share of the Middle East lubricants market size in 2025, while bio-based lubricants are forecast to grow at a 3.12% CAGR to 2031.
- By Product Type, Engine oils held 37.32% revenue share in 2025; transmission and hydraulic fluids are advancing at a 3.01% CAGR between 2026-2031.
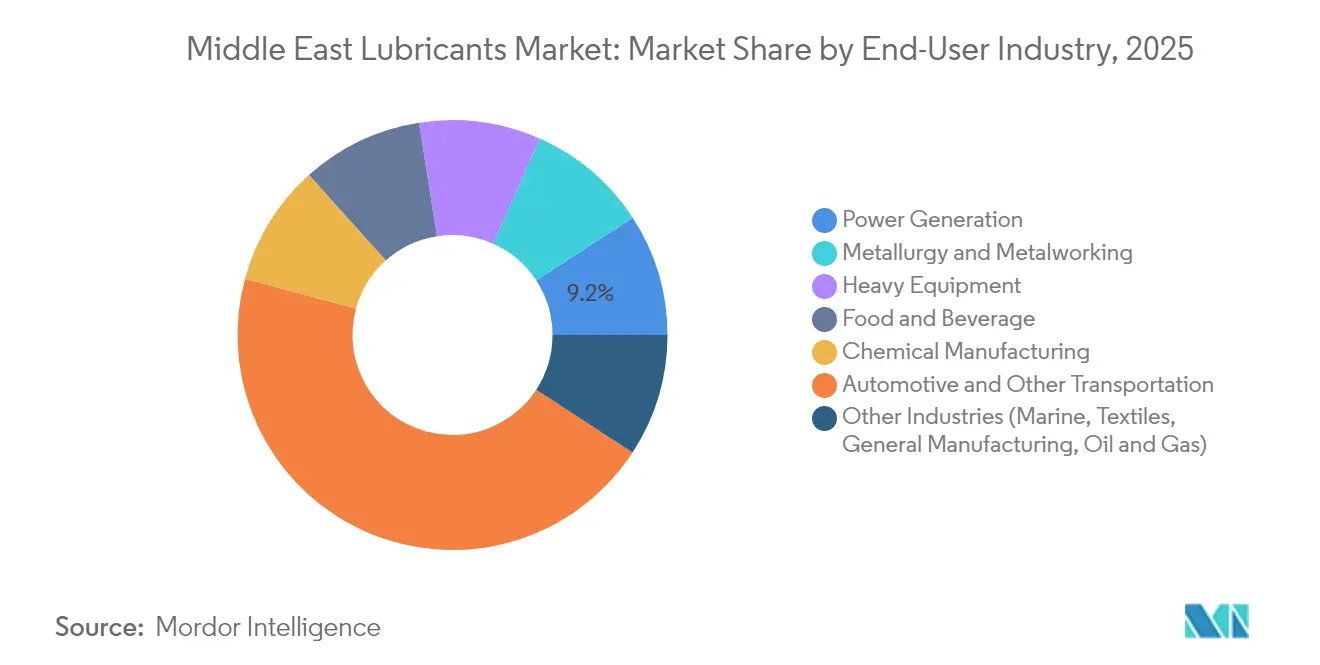
- By End-user Industry, Automotive and other transportation commanded 45.02% of the Middle East lubricants market size in 2025, whereas power generation is registering the fastest 3.09% CAGR to 2031.
- By Geography, Saudi Arabia led with 37.21% of the Middle East lubricants market share in 2025, while the United Arab Emirates is the fastest-growing geography at a 3.21% CAGR through 2031.
Note: Market size and forecast figures in this report are generated using Mordor Intelligence’s proprietary estimation framework, updated with the latest available data and insights as of 2026.
Market Trends and Insights
Drivers Impact Analysis of Middle East Lubricants Market*
| Driver | (~) % Impact on CAGR Forecast | Geographic Relevance | Impact Timeline |
|---|---|---|---|
| Industrial expansion across GCC petrochemical and manufacturing hubs | +0.80% | Saudi Arabia, UAE, Qatar with spillover to Kuwait, Oman | Medium term (2-4 years) |
| Automotive fleet growth and aftermarket demand surge | +0.60% | Region-wide, concentrated in Saudi Arabia and UAE urban centers | Short term (≤ 2 years) |
| Mega infrastructure and power generation projects pipeline | +0.50% | Saudi Arabia, UAE, Qatar | Long term (≥ 4 years) |
| Shift toward high-performance synthetics for harsh climates | +0.40% | Desert and coastal operating zones across the Middle East | Medium term (2-4 years) |
| Local content mandates spurring domestic blending | +0.30% | Saudi Arabia, UAE, Kuwait | Long term (≥ 4 years) |
| Source: Mordor Intelligence | |||
Industrial Expansion Across GCC Petrochemical and Manufacturing Hubs
New petrochemical complexes, metals plants, and downstream converters are raising localized demand for compressor oils, heat-transfer fluids, and metalworking lubricants. The USD 11 billion Amiral project started up in 2024 with a 1.65 million ton ethylene cracker that relies on synthetic process oils able to tolerate 200 °C discharge temperatures[1]. Additions at SABIC Jubail and Qatar’s Ras Laffan extend the same requirement profile. Integrated producers typically specify Group II or Group III base stocks because higher viscosity index and oxidation stability reduce unplanned shutdowns, a critical metric in high-throughput polymer assets. Dense industrial clustering also lowers last-mile logistics costs, allowing distributors to implement vendor-managed inventories that keep plant lube rooms lean while guaranteeing uptime. This virtuous cycle underpins sustained uplift in premium-grade volumes across the Middle East lubricants market.
Automotive Fleet Growth and Aftermarket Demand Surge
Light-duty registrations continue to rise as income growth boosts vehicle ownership and e-commerce accelerates last-mile trucking. Saudi Arabia’s vehicle parc crossed 8 million units in 2024, and commercial segments are expanding at double-digit rates to serve NEOM, Diriyah, and other megaprojects[2]. The UAE’s re-export hub status pulls in heavy-duty trucks that clock high annual mileage on trans-GCC corridors, driving demand for high-TBN engine oils meeting API CK-4 and low-SAPs Euro VI standards. Although synthetic formulations stretch change intervals to 75,000 miles, per-vehicle lube spend actually climbs because of higher unit prices and additive treat rates. OEM warranty requirements for API SN PLUS and ILSAC GF-6 classes are widening the premium tier, and this helps safeguard margins in the Middle East lubricants market despite plateauing drain volumes.
Mega Infrastructure and Power Generation Projects Pipeline
Desert megacities, port expansions, and cross-border rail links collectively anchor a multidecade construction cadence that leans heavily on hydraulic excavators, cranes, and rock crushers. Lubricants for such fleet assets must sustain viscosity from 10 °C dawn starts to 60 °C midday peaks, resist sand ingress, and permit 500-hour service intervals. NEOM alone is budgeted at USD 500 billion and draws thousands of diesel generators, marine engines, and tunnel-boring machines that together consume high-pressure gear oils and soot-handling 15W-40 heavy-duty engine oils. Parallel power-sector upgrades replace older steam plants with F-class and H-class gas turbines; these require ester-enhanced or PAO-based ISO 32 turbine oils capable of resisting coking at 230 °C bulk fluid temperatures. The pipeline thus provides a steady intake of specialty fluids throughout the forecast horizon.
Local Content Mandates Spurring Domestic Blending
Saudi Arabia’s iktva program, the UAE’s Operation 300bn, and similar frameworks tie project awards to local spend thresholds, pushing EPC contractors to source domestically blended lubricants wherever technically feasible[3]. Multinationals respond by forming equity partnerships and building toll-blending hubs inside free zones to secure tax incentives and on-time customs clearance. Indigenous brands, in turn, gain better shelf presence in car-care chains and hypermarkets, leveraging domestic origin labels that resonate with both B2B and retail buyers. Over time, this policy-driven reshaping of supply chains elevates resilience, trims import bills, and supports capability transfer into additive dosing, package testing, and halal validation laboratories—areas where historical dependence on foreign expertise was high.
Restraints Impact Analysis of Middle East Lubricants Market*
| Restraint | (~) % Impact on CAGR Forecast | Geographic Relevance | Impact Timeline |
|---|---|---|---|
| Base oil price volatility tied to crude fluctuations | -0.40% | Regional, particularly affecting Saudi Arabia, UAE, Kuwait refining margins | Short term (≤ 2 years) |
| Longer drain intervals reducing volumetric demand | -0.30% | Global Middle East, concentrated in commercial vehicle segments | Medium term (2-4 years) |
| Halal certification limits on additive chemistries | -0.20% | Regional Islamic markets, particularly Saudi Arabia, UAE, Qatar, Kuwait | Long term (≥ 4 years) |
| Source: Mordor Intelligence | |||
Base Oil Price Volatility Tied to Crude Fluctuations
Due to frequent fluctuations in Brent crude prices within a single quarter, refiners like Luberef are compelled to adjust their posted prices for Group I and Group II fuels every month. Meanwhile, independent blenders face squeezed margins, as base stocks account for as much as 75% of their formulation costs. Additionally, flexible retail pricing is challenging in markets that offer fixed service-package menus. Gross profit therefore compresses when crude rallies, prompting stocking discipline and hedging strategies that add financing costs. Conversely, rapid crude drops compel distributors to mark down inventories, triggering valuation losses. Such oscillations create planning uncertainty and trimmed CAPEX for capacity debottlenecks, restraining near-term growth within the Middle East lubricants market.
Longer Drain Intervals Reducing Volumetric Demand
OEM-approved synthetics now permit 1-year or 35,000-kilometer oil changes for buses and on-highway trucks, cutting annual oil volume per unit by up to 40% compared with 2018 norms. While premium pricing offsets part of the revenue impact, absolute liter throughput still declines, especially where national inspection regimes enforce adherence to OEM schedules. Workshops compensate by upselling ancillary services such as coolant checks and filter-replacement bundles, yet the structural shift toward high-stamina lubricants drags headline demand growth below the underlying equipment population expansion rate.
*Our forecasts treat driver/restraint impacts as directional, not additive. The impact forecasts reflect baseline growth, mix effects, and variable interactions.
Middle East Lubricants Market Segment Analysis
By Group:
Premium Migration Gains TractionGroup I held a 46.62% slice of the Middle East lubricants market share in 2025 because many industrial buyers still favor its lower cost for splash-lubed conveyors, piston-type air compressors, and gensets operating under moderate thermal stress. The segment’s installed base derives from decades of conventional refining and well-established additive treat recipes that assure supply continuity. However, OEM technical bulletins released in 2025 recommend Group II for new reciprocating compressor models and mandate Group III for turbocharged, charge-cooled engines running in sustained 50 °C ambient conditions, nudging end users toward higher-quality basestocks.
The performance narrative is compelling. Group III lubricants show 30% lower volatility and 20% higher viscosity index than Group I, extending oxidation life and reducing top-up rates. Saudi Aramco’s Luberef Phase II revamp adds Group II lines specifically targeting this migration. Distributors across Riyadh and Jeddah are already blending multigrades with 40–60% Group II cut to meet evolving SAE XW-30 viscosity demands. Although unit prices climb, total cost of ownership sinks as fleets adopt 500-hour drain cycles, boosting adoption within the Middle East lubricants market.

By Base Stock:
Sustainability Nudges Product MixMineral oils still represent 69.58% of total consumption, underpinned by abundant regional refining capacity, cost advantage, and broad additive compatibility. Yet, sustainability charters signed by top logistics operators and petrochemicals producers commit to 30% life-cycle carbon reduction by 2030. Bio-based lubricants—mainly vegetable-ester hydraulic oils and biodegradable metal-forming fluids—therefore attract attention and record a 3.12% CAGR, outpacing the wider market.
Bio-esters deliver greater than 90% biodegradability within 28 days and exhibit superior boundary lubrication, reducing tool wear in aluminum stamping lines by 15%. Nonetheless, oxidative stability lags, necessitating anti-oxidant boosters that increase formulation cost. Semi-synthetic blends combining mineral carriers with 20–30% bio-base strike a practical compromise, retaining ISO 11158 performance while lowering environmental exposure. Such innovations slowly chip away at mineral dominance and broaden the offering landscape inside the Middle East lubricants market.
By Product Type:
Specialized Fluids Outpace Engine OilsEngine oils accounted for 37.32% of 2025 demand as the light-duty and heavy-duty vehicle parc exceeded 15 million units across GCC states. Mandatory periodic vehicle inspection programs anchor stable replacement frequency, yet the fastest incremental volume now stems from transmission and hydraulic fluids, which are tracking a 3.01% CAGR to 2031. Desert construction fleets, tower cranes at port expansions, and tunnel-boring rigs for metro projects collectively require high-viscosity-index anti-wear formulations.
Metalworking fluids enjoy a parallel uplift as fabrication shops supporting NEOM and Ras Al Khair acquire CNC machine tools that rely on emulsifiable cutting oils and synthetic coolants. API RP 1525 bulk oil handling guidelines are gaining traction in distributor depots to prevent cross-contamination among these diversified fluid grades. Consequently, suppliers maintaining broad product lines and on-site laboratory support gain wallet share across the Middle East lubricants market size continuum.
By End-User Industry:
Power Generation Emerges as Growth EngineAutomotive and other transportation segments still constitute 45.02% of volume in 2025 due to dense personal car ownership and thriving road-freight corridors. Yet power generation posts the sharpest 3.09% CAGR, propelled by gas turbine fleet additions linked to electrification targets and solar-hybrid installations that require synthetic heat-transfer oils.
Modern F-class turbines call for ester-augmented ISO 32 oils that maintain load-bearing film at 230 °C bulk temperatures. OEMs prescribe varnish-control metrics below 10 mg/L MPC index, a threshold traditional mineral oils struggle to meet. Coupled with the roll-out of 1.5 GW of concentrated solar power in Dubai by 2030, which depends on molten-salt pumps lubricated by high-flash-point fluids, this shift realigns product portfolios and supports revenue diversity within the Middle East lubricants market.
Geography Analysis
GCC Lubricants Market
The Gulf Cooperation Council (GCC) bloc anchors 2025 regional demand, with Saudi Arabia securing 37.21% market share on the back of its broad industrial base and mega-infrastructure pipeline. Riyadh’s industrial zones in Jubail and Yanbu host integrated base-oil plants that supply local blenders, insulating the domestic market from some import volatility. Vision 2030 programs stipulate 70% local content, which has spurred lubricant packaging line investments in Dammam, further entrenching domestic supply resilience.
United Arab Emirates Lubricants Market
The UAE’s lubricants segment is tracking a 3.21% CAGR through 2031, reflecting strong growth in logistics, aviation, and marine bunkering. Jebel Ali Free Zone acts as a transshipment hub feeding Oman, Bahrain, and East Africa, so on-site toll-blenders maintain multi-grade production schedules that mirror diverse export specifications. Dubai’s 2040 Urban Master Plan, together with Abu Dhabi’s clean-energy build-out, elevates demand for turbine and hydraulic oils that must meet both API and halal certification standards.
Middle East Lubricants Market
Elsewhere, Qatar’s post-World-Cup infrastructure maintenance sustains construction equipment volumes, while Kuwait’s Integrated Petrochemical Complex will lift internal process-oil needs upon 2026 startup. Oman capitalizes on its Duqm and Sohar port corridors to draw marine lubricant volumes, and Bahrain’s finance-led diversification introduces data-center cooling projects that specify synthetic refrigeration lubricants. Iran remains a sizable but sanction-constrained market; localized blenders there rely on Group I imports from Russia, but multinationals stay cautious due to compliance risks. Iraq’s reconstruction activities generate spikes in hydraulic and gear oil demand, though political instability often disrupts supply chains and dampens sustained growth.
Regulatory Landscape
Lubricants sold across GCC markets are increasingly shaped by Gulf Standardization Organization (GSO) requirements, with national authorities enforcing conformity at the border and in-market. In May 2024, GSO 1785-1:2024 was approved to specify API performance classifications for gasoline and diesel engine lubricating oils, while GSO 1163:2023 defines classification, requirements, and test methods for base oils, including mineral, synthetic, and re-refined grades. This standards foundation supports cross-border trade, but it also lifts the compliance burden on blenders and importers that must provide documented test methods, labeling, and performance claims.
Country-level frameworks also add market-entry and handling controls. In the UAE, Cabinet Resolution No. (28) of 2024 mandates application of specified technical regulations, including GSO 1785-2:2023 aligned with ACEA European oil sequences, and regulated products generally require a Certificate of Conformity via the UAE Conformity Assessment System (UCAS) under the Ministry of Industry and Advanced Technology (MoIAT). In Saudi Arabia, the 2025 Law of Petroleum and Petrochemical Products reinforces mandatory compliance with approved technical specifications for petroleum products, while Dubai Executive Council Resolution No. (85) of 2025 requires Supreme Council of Energy approval for technical standards governing petroleum products storage, manufacturing, filling, and transport, tightening operational requirements for lubricant storage and logistics sites.
Value Chain Analysis
The Middle East lubricants value chain begins with base oils (Group I through Group III/III+ and naphthenics) supplied from regional refineries and import flows, then moves through additive procurement, blending, packaging, and multi-channel distribution. Base oil availability in Saudi Arabia and the UAE supports domestic blending, but prepared additive imports remain a key input for performance formulations. In 2024, the UAE, Turkey, and Saudi Arabia together accounted for 78% of regional imports of prepared lubricant additives, highlighting reliance on external additive supply for premium grades. Industrial and automotive specifications (API classes and OEM requirements) push blenders toward tighter quality-control loops, including batch testing and traceability for multi-grade production.
Manufacturing and distribution operate on a hub-and-spoke model supported by free-zone and port infrastructure. In this setup, the UAE (notably Jebel Ali and Fujairah) functions as a logistics and redistribution gateway for additives and finished lubes across the GCC and adjacent export corridors. Regional blending capacity is anchored by large and specialized plants, including ENOC assets in Fujairah and facilities operated by Gulf Oil Middle East in Jebel Ali and Ras Al Khaimah, which allow faster SKU switching across automotive, industrial, and marine segments. Upstream localization also shows traction, with Farabi Downstream Petrochemical Company signing an MoU with Xinxiang Richful Lube Additive Co., Ltd. in February 2025 to form a joint venture for an integrated lubricant additive plant in Yanbu, targeting reduced dependence on imported additive components and shorter lead times for high-performance formulations.
Competitive Landscape
The Middle East Lubricants Market exhibits consolidated concentration. Global majors command technology depth, certification breadth, and captive additive pipelines that underpin their Middle East leadership. Shell remains the volume leader for the 17th consecutive year and extends its position through a Saudi joint venture with Aljomaih that operates a high-speed blending plant in Jeddah. ExxonMobil and TotalEnergies similarly leverage cross-regional supply chains to feed premium synthetics into GCC markets.
Regional consolidation is accelerating. Saudi Aramco’s exploratory talks for a USD 15 billion Castrol acquisition signal a strategy to integrate internationally recognized retail brands with domestic base-oil feedstock, potentially redefining competitive hierarchies if concluded. FUCHS doubled its Yanbu capacity to 200,000 tonnes in 2025, supporting both industrial OEM fill and aftermarket channels. Petromin, already controlling about 40% of the Saudi passenger-car oil segment, rolled out halal-certified synthetic products that align with strict additive sourcing rules, boosting cross-border sales in Kuwait and Bahrain.
Technology competition now extends into electric-vehicle (EV) fluids, where dielectric coolants and copper-corrosion-inhibited greases represent emerging niches. Smaller disruptors such as Dubai-based Nanol Technologies trial nano-additive booster shots that promise 5–7% fuel savings in marine engines, aiming at IMO carbon-intensity index compliance. Meanwhile, additive specialists focus on halal-compliant detergent and anti-oxidant packages, filling capability gaps for regional blenders that previously relied on imported chemistries.
Middle East Lubricants Industry Leaders
-
Aljomaih and Shell Lubricating Oil Company Limited
-
BP p.l.c
-
Exxon Mobil Corporation
-
Saudi Aramco Base Oil Company - Luberef
-
TotalEnergies
- *Disclaimer: Major Players sorted in no particular order
Middle East Lubricants Market Companies Covered in this Report
- Aljomaih and Shell Lubricating Oil Company Limited
- Behran Oil Co.
- BP p.l.c
- Chevron USA .Inc
- Emarat
- Exxon Mobil Corporation
- FUCHS
- GP Global MAG LLC
- Gulf Oil Middle East Limited (Gulf Oil International Ltd)
- Idemitsu Kosan Co., Ltd.
- IRANOL (LLP)
- Lubrex FZC
- Motul
- Pars Oil Company
- Petromin
- Saudi Aramco Base Oil Company - Luberef
- Sepahan Oil Company
- SK Lubricants
- TotalEnergies
Market Opportunities and Future Outlook
Localizing higher-value inputs and premium base stocks is a key whitespace area as the market shifts toward synthetics, specialty industrial fluids, and tighter OEM and standards compliance. In January 2026, Saudi Aramco and Luberef signed a memorandum of understanding to assess a potential base oil plant at the Jazan Refinery and Petrochemical Complex, with capacity stated at up to 800,000 tonnes per year, aimed at improving availability of higher-performance base oils for modern engine oils, turbine oils, and hydraulic fluids. In parallel, moves around Yanbu are reinforcing integrated lubricants clusters. In June 2026, Apar Industries Middle East Limited signed a base oil supply agreement with Luberef to support specialty oil manufacturing at the LubeHUB lubricants value park in Yanbu, pointing to a pathway for new entrants and incumbent blenders to secure feedstock and scale specialty lines, such as transformer, process, and white oils, with shorter logistics cycles.
Route-to-market expansion and service-linked distribution also remain a concrete channel for share gains for brands that can pair certified products with workshop coverage and fleet supply contracts. July 2026 saw Valvoline open its new Saudi Arabian lubricants company, ValCo, which signals continued investment in localized commercial structures that can serve both industrial and automotive channels under local-content procurement dynamics. Supply chain continuity for local production is also being reinforced, including the Saudi Ministry of Energy extending feedstock allocation for Luberef’s Jeddah facility at 24,500 barrels per day until 31 December 2030, improving planning visibility for domestic base oil and blending ecosystems serving large Saudi and re-export demand centers.
Recent Industry Developments in Middle East Lubricants Market
- July 2026: Vivo Energy completed the acquisition of 100% of TotalEnergies Marketing Jordan, taking over about 180 service stations and associated commercial lubricants operations. The deal consolidates downstream distribution and workshop touchpoints in Jordan, strengthening Vivo Energy's ability to push branded lubricants through an established retail and B2B network.
- February 2026: Al Jomaih and Shell Lubricating Oil Company (JOSLOC) signed a strategic lubricants supply agreement with Al Nakhlah National Company (NANCO) to support its diversified fleet requirements. The agreement deepens fleet-focused channels where technical approvals and service reliability influence product choice, and it supports stickier demand for premium engine oils and hydraulics in large operating fleets.
- January 2026: TotalEnergies and Bahrain's Bapco Energies launched BxT Trading, a 50-50 joint venture to trade petroleum products leveraging flows from the Sitra refinery. The new trading platform can reshape product flows and pricing dynamics for base oils and finished lubricants across nearby Gulf markets by strengthening regional sourcing and logistics optionality.
Middle East Lubricants Market Report Scope and Research Methodology
Market Definition and Coverage
For this study, the market is defined as finished lubricants consumed across Middle East countries, counted at the point where products are sold into end-use applications, and measured in value terms.
Scope exclusions: We exclude fuel additives, pure base oils traded as feedstock, and retail or logistics margins that sit outside the lubricant product value.
Segments Covered in This Report
- By Group
- Group I
- Group II
- Group III
- Group IV (PAO)
- Naphthenics
- By Base Stock
- Bio-based Lubricant
- Mineral Oil Lubricant
- Synthetic Lubricant
- Semi-synthetic Lubricant
- By Product Type
- Engine Oil
- Transmission and Hydraulic Fluid
- Metalworking Fluid
- General Industrial Oil
- Gear Oil
- Greases
- Process Oils
- Other Types (Turbine, Refrigeration, Aviation, Marine, Transformer)
- By End-user Industry
- Power Generation
- Automotive and Other Transportation
- Heavy Equipment
- Food and Beverage
- Metallurgy and Metalworking
- Chemical Manufacturing
- Other Industries (Marine, Textiles, General Manufacturing, Oil and Gas)
- By Geography
- Saudi Arabia
- United Arab Emirates
- Iran
- Iraq
- Kuwait
- Qatar
- Oman
- Bahrain
- Rest of Middle-East
Data Sources, Market Sizing, and Validation
Desk Research
Desk research was first used to map the demand pool and set realistic boundaries for what should be counted as lubricants value in the Middle East. We mainly relied on non-paywalled sources such as national statistics and customs portals, UN Comtrade trade tables, OPEC and national oil ministry releases, and IEA energy and transport indicators to understand refinery activity, vehicle parc signals, and industrial output direction.
To turn those signals into usable model inputs, company annual reports, investor presentations, and official association websites were read to understand product mix (automotive versus industrial), typical packaging and channel structures, and the pace of formulation upgrades. A paid subscription for company financials and another for shipment-level import and export records were also used selectively to cross-check trade direction and to pressure-test implied pricing, and then the assumptions were filtered through publicly visible price and inflation series. This list is illustrative, and many other public and paid sources were also consulted to collect, validate, and clarify data points.
Primary Interviews and Surveys
Primary work was used to validate what desk research cannot show cleanly, especially pricing logic, channel discounts, and how quickly end-users shift between grades during oil price swings. We spoke with a mix of lubricant blenders, distributors, large fleet and industrial buyers, and service-focused stakeholders across key Middle East economies, and then used the feedback to close gaps in penetration rates and to confirm realistic growth paths by application.
Distribution of primary research fieldwork respondents
| Company type | Respondent position |
|---|---|
| Top tier: 25% | CXOs: 18% |
| Mid tier: 56% | Functional/Unit leaders: 24% |
| Smaller Players: 19% | Managers: 58% |
Market-Sizing & Forecasting
The core sizing starts with a top-down build where regional lubricant demand is reconstructed using a consumption-led pool, and then it is split using observable usage drivers. In practice, we linked end-use activity to lubricant intensity, such as vehicle parc and annual mileage for automotive oils, industrial production and power generation load for industrial lubricants, and local blending versus imports to avoid double counting.
A small set of market fingerprints were treated as anchor inputs, including base oil price movement, finished lubricant price spreads by grade, passenger and commercial vehicle parc trends, industrial output proxies, and the share shift between mineral and synthetic products. Forecasts were developed using scenario analysis with a pricing and volume split, where volume follows activity indicators and pricing follows a moderated ASP progression that reflects crude-linked inputs and channel discounting. Results were then corroborated with selective bottom-up checks, such as sampled ASP times estimated liters in key countries and channel checks on import landed costs, and gaps were handled by using conservative interpolation when a country or application had limited public disclosure.
Data Validation & Update Cycle
Model outputs were checked against independent signals, including trade balance direction, blending capacity announcements, and consistency between implied liters and implied pricing for the same country year. When a variance looked unusual, the assumptions were re-opened, and follow-up calls were triggered with relevant respondents before internal review sign-off.
The report is refreshed on an annual cycle, and interim updates are made when material events occur, such as sharp feedstock price swings or policy changes affecting vehicle or industrial activity. Before delivery, we run a final pass on key inputs so the market view reflects the latest available data cut and is consistent across tables, charts, and written insights.
Mordor Intelligence's Middle East Lubricants Market Sizing Compared With Other Published Estimates
Published market values for Middle East lubricants often look far apart because the scope boundary is not consistent, and because some sources treat value as a trade proxy rather than a consumption market. Differences also come from how pricing is carried forward across years, which matters in lubricants because base oil costs and discounting can shift quickly.
A refresh-led build tends to change the answer when exchange rates are timed differently, when nominal prices are taken from a single month, or when retail and logistics margins get mixed into the product value. The checks that reduce these issues are simple but strict, such as using annual average currency conversion, separating volume growth from ASP movement, and re-contacting sources when implied price per liter jumps, which is how Mordor Intelligence keeps the estimate aligned to what is actually sold into end uses in the region.
Benchmark comparison
| Source | Market Size | Gaps in Research Methodology |
|---|---|---|
| Mordor Intelligence | USD 9.54 B (2024) | |
| Regional Data Platform A | USD 1.10 B (2024) | This figure is closer to a producer and importer revenue view for petroleum lubricating oil and grease, and it typically excludes downstream margins while also leaning heavily on trade and wholesale pricing, which can understate the full finished lubricants consumption value. |
| Global Consultancy B | USD 5.80 B (2026) | This estimate uses a later starting year and a revenue-forward projection, and the published framing does not make the price build-up and currency timing explicit, which can shift totals in a market where ASP is sensitive to crude-linked inputs and discounting. |
Across the three figures, most of the spread is explained by what is included in value, when pricing and FX are captured, and whether the market is treated as trade revenues or end-use consumption. By keeping the steps repeatable and by separating volume from price in the forecast, the final number can be traced back to clear drivers and rechecked when new price or activity data comes in.
Key Questions Answered in the Report
What is the current volume size of the Middle East lubricants market?
The market reached 2.95 billion liters in 2026.
How fast is lubricant demand expected to grow in the GCC?
It is projected to rise at a 2.66% CAGR, reaching 3.36 billion liters by 2031.
Which country leads regional lubricant consumption?
Saudi Arabia holds 37.21% of the total volume, driven by the large petrochemical and transportation sectors.
What product category is growing fastest through 2031?
Transmission and hydraulic fluids are expanding at a 3.01% CAGR due to large infrastructure projects.
How do local content policies influence lubricant sourcing?
Programs like iktva require up to 70% domestic procurement, so many suppliers have built blending plants inside Saudi Arabia and the UAE.
Are bio-based lubricants gaining traction?
Yes, they are recording a 3.12% CAGR as industrial buyers introduce sustainability commitments and ISO biodegradable fluid standards.