
| Study Period | 2017 - 2030 |
| Base Year For Estimation | 2024 |
| Forecast Data Period | 2025 - 2030 |
| Market Size (2025) | USD 1.85 Billion |
| Market Size (2030) | USD 2.24 Billion |
| CAGR (2025 - 2030) | 3.94 % |
| Market Concentration | Low |
Major Players*Disclaimer: Major Players sorted in no particular order |


Africa Feed Additives Market Analysis
The Africa Feed Additives Market size is estimated at 1.85 billion USD in 2025, and is expected to reach 2.24 billion USD by 2030, growing at a CAGR of 3.94% during the forecast period (2025-2030).
The African feed additives industry has witnessed significant transformation driven by increasing industrialization of animal farming and a growing emphasis on optimizing animal nutrition. Feed manufacturers are increasingly focusing on product innovation and quality enhancement, with amino acids emerging as a crucial component, accounting for USD 408 million in 2022, primarily due to their role in protein synthesis and animal growth optimization. The industry has also seen substantial investments in research and development, particularly in the development of specialized animal feed additives that can improve feed conversion rates and animal health outcomes. This evolution is further supported by the growing adoption of modern farming practices and increased awareness about the importance of scientific feed management among commercial farmers.
Technological advancement and product innovation have become key differentiators in the market, with companies introducing new formulations and enhanced efficiency products. A notable development is the DSM-Novozymes alliance's introduction of new-generation products like HiPhorius and ProAct 360, demonstrating the industry's commitment to innovation. The feed additives segment, valued at USD 219.7 million in 2022, has seen particular advancement in terms of product formulation and application technology, with new binding agents being developed to improve feed stability and nutrient retention. These innovations are complemented by increasing investment in production facilities and quality control systems across the region.
Supply chain optimization and strategic partnerships have emerged as crucial focus areas for industry stakeholders. A significant development in this direction was the 2023 joint venture between Nutreco and Unga Group PLC, aimed at meeting the growing demand for high-quality protein in the East African region. The industry has also witnessed the establishment of more localized production facilities, with Egypt alone producing 597 thousand metric tons of compound feed for fish in 2022, demonstrating the growing emphasis on regional self-sufficiency in feed production. Companies are increasingly focusing on vertical integration and direct partnerships with farmers to ensure quality control and steady supply chains.
Consumer preferences and market demands are evolving rapidly, with increasing emphasis on natural and sustainable feed additives. The industry has seen growing demand for specialized additives like minerals, probiotics, and prebiotics, which collectively accounted for over USD 423 million in market value in 2022. This trend is driven by increasing awareness about animal health and welfare, as well as growing consumer preference for quality animal products. The market has also witnessed a shift towards more specialized feed supplement solutions, with manufacturers developing targeted products for different growth stages and animal types, reflecting a more sophisticated understanding of animal nutrition requirements.
Africa Feed Additives Market Trends
The increasing per capita consumption of poultry meat and eggs with higher profit margins which is increasing the poultry production in Africa region
- The African poultry industry plays an important role in commercial activities and in providing quality protein to subsistence farmers and rural communities. Poultry birds accounted for 61.5% of the total animal headcount in Africa in 2022, primarily due to the rising demand for poultry meat and eggs in the region. The number of poultry birds increased by 8.8% from 2017 to 2.2 billion heads in 2022, driven by the growth of poultry farms in the region.
- Among poultry birds, broilers were highly raised due to the increasing demand for meat in the region. In South Africa, chicken meat production increased from 1,570 thousand metric tons in 2021 to 1,577 thousand metric tons in 2022 as major producers invested in the industry to capitalize on higher international and domestic poultry prices and profit margins.
- The African poultry industry is expanding due to the growing demand for poultry products from key importing countries, leading to increased investments in poultry farming. In 2021, Quantum Foods, one of South Africa's largest poultry producers, invested over USD 14 million in its poultry operations, including constructing hatcheries and upgrading broiler farms to boost productivity.
- The per capita consumption of poultry meat in South Africa rose to 35.09 kg in 2022 from 33.7 kg in 2017, and it is expected to grow by 7.5% during the forecast period (2023-2029), driven by the increasing prices of other animal proteins like beef and lamb. These factors are projected to increase the number of farms and headcount during the forecast period (2023-2029).

Understand The Key Trends Shaping This Market
Download PDF
Expansion of integrated fish farming and development of inland fisheries is increasing the demand for compound aqua feed
- Aquaculture farming has become one of the largest industries in the agriculture sector in many countries across Africa. Due to unfavorable climatic conditions and a reduction in fish catch, the usage of compound feed in the region decreased by 60% in 2019 compared to the previous year. The increase in freshwater and marine aquaculture farming in the region caused a surge in demand for compound feed, which grew by 152% from 2019 to reach 1.5 million metric tons in 2022. Despite this increase, aquaculture feed production accounted for 4.3% of the total feed production in the region in 2022.
- The rise in aquaculture production in recent years is credited to a significant expansion in the application of nutritional feed, including the use of extruded feed and improved farm management practices, as well as an increase in investments, which led to a 1.3% increase in the production of compound feed from 2020 to 2022. The Egyptian aquaculture feed industry underwent rapid development, with a shift from conventionally pelleted feeds (10%) to high-quality extruded feeds (90%). The Fish Farming Development Fund and similar government schemes in other countries, such as Nigeria, are expected to drive aquaculture farming in the region, thereby increasing feed production.
- Egypt's fisheries and aquaculture development plan aims to increase fish production to 3 million metric tons by 2025 through the expansion of integrated fish farming, development of inland fisheries, and mega-national productions. Thus, an increase in aquaculture production, a rise in the usage of high-quality extruded feed, and an increase in investments are expected to drive feed production in the region.

OTHER KEY INDUSTRY TRENDS COVERED IN THE REPORT
- Kenya is leading consumer of milk and increasing demand for beef and dairy products is increasing the demand for ruminants production
- Broilers had the highest share as there is increase in demand for meat and increasing investments in poultry farming is driving the poultry feed production
- Countries such as Nigeria, South Africa and Kenya invested in swine farming is helping in increasing the demand for swine feed production in the region
- Increased demand for pork meat is increasing the demand for swine production and countries such as South Africa, Egypt and Nigeria have the largest swine population
- Government financial initiatives to meet the growing demand for meat and dairy products and crucial role of healthy feed in producing these products is increasing the ruminants feed production
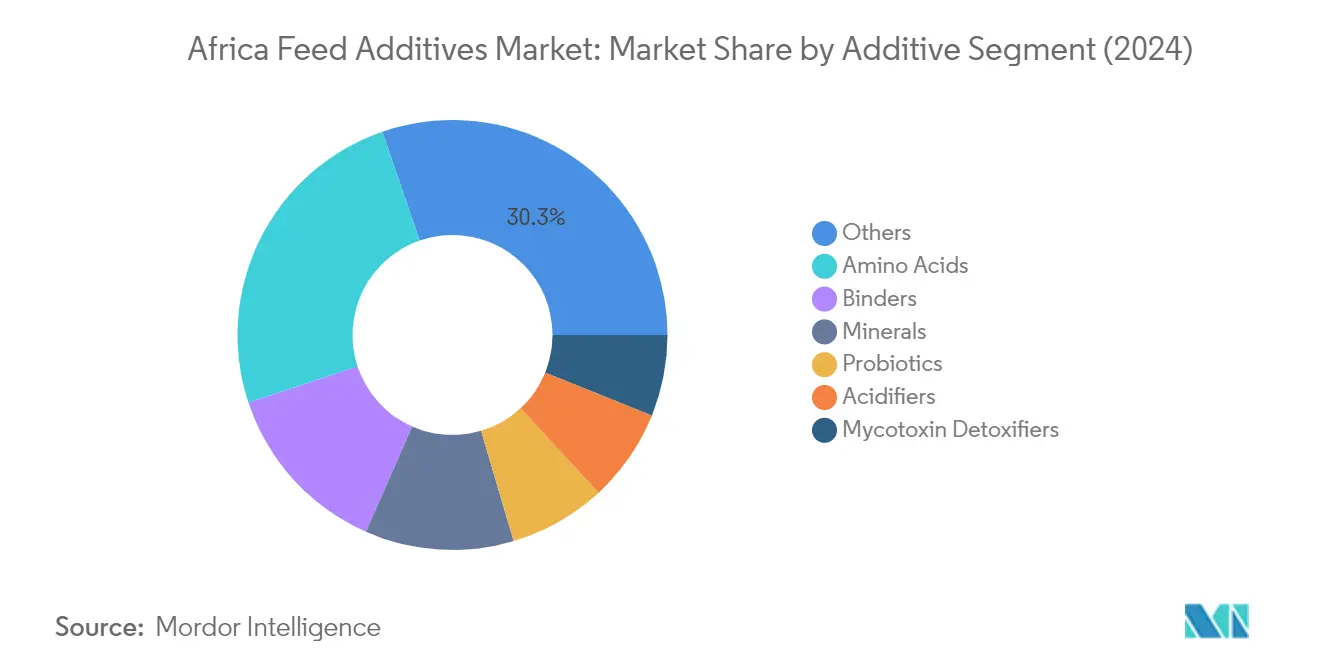
Segment Analysis: By Additive
Amino Acids Segment in Africa Feed Additives Market
Amino acids dominate the African feed additives market, commanding approximately 25% market share in 2024. This segment's leadership position is primarily driven by the essential role feed amino acids play in protein synthesis and metabolic functions across various animal species. In the poultry segment, which accounts for the largest consumption of amino acids, these additives are crucial for optimal growth and performance. Lysine and methionine are the most significant feed amino acids in terms of market value, together accounting for more than 55% of the total amino acids market value, due to their effectiveness in improving gut health and enabling easy digestion in animals while boosting meat production. The segment's strong position is further reinforced by the increasing awareness among farmers about balancing gut pH and reducing the occurrence of infections in livestock.
Antioxidants Segment in Africa Feed Additives Market
The feed antioxidants segment is emerging as the fastest-growing category in the African feed additives market, projected to expand at approximately 4% CAGR from 2024 to 2029. This remarkable growth is primarily attributed to the increasing demand for feed preservatives solutions and the rising awareness about feed quality maintenance. Antioxidants play a crucial role in preserving and improving the shelf life of feed when mixed with compound feed, particularly in preventing lipid peroxidation and oxidative rancidity during production, processing, and storage. The segment's growth is particularly strong in the poultry sector, where antioxidants like BHT are used as antiviral substances, helping prevent mortality in chickens when exposed to diseases. The increasing adoption of antioxidants in commercial feed production and their expanding application across various animal species are key factors driving this segment's rapid growth.
Remaining Segments in Africa Feed Additives Market
The African feed additives market encompasses several other significant segments that contribute to its diverse landscape. Binders play a vital role in strengthening pellets and improving feed integrity, while minerals are essential for various physiological functions in animals. Probiotics and prebiotics focus on gut health improvement and pathogen control, whereas feed acidifiers help in maintaining optimal pH levels in animal digestive systems. Mycotoxin detoxifiers are crucial for feed safety, while feed enzymes enhance nutrient absorption and feed efficiency. The market also includes specialized segments such as pigments for enhancing product appearance, vitamins for nutritional supplementation, and yeast products for improved digestion and immunity. Each of these segments serves specific functions in animal nutrition and health, contributing to the overall development of the livestock and aquaculture industries in Africa.
Segment Analysis: By Animal
Poultry Segment in Africa Feed Additives Market
The poultry segment dominates the Africa feed additives market, accounting for approximately 55% of the total market value in 2024. This significant market share is primarily driven by the increasing demand for poultry meat and eggs across the region. The segment's dominance is further strengthened by the high adoption of feed additives in poultry diets, as they play a crucial role in improving feed efficiency and promoting animal growth. Broilers constitute the largest sub-segment within poultry, valued at around USD 562 million, followed by layers, which represent about 20% of the poultry segment. The high market share is attributed to the expanding poultry industry in countries like South Africa and Egypt, where commercial poultry farming has seen substantial growth due to rising consumer demand for protein-rich diets.
Swine Segment in Africa Feed Additives Market
The swine segment is emerging as the fastest-growing segment in the Africa feed additives market, projected to grow at approximately 5% CAGR from 2024 to 2029. This robust growth is primarily driven by increasing investments in swine farming across major African countries, particularly in South Africa, which accounts for over 55% of the swine feed additives consumption. The growth is supported by rising pork consumption in urban areas and improving farming practices. Amino acids are the most widely used feed additives in swine feed, as they play a vital role in maintaining gut health and essential nutritional functions. The segment's growth is further bolstered by increasing awareness among farmers about the benefits of feed additives in improving feed conversion ratios and overall animal health.
Remaining Segments in Animal Feed Additives Market
The remaining segments in the Africa feed additives market include ruminants, aquaculture, and other animals, each playing distinct roles in shaping the market dynamics. The ruminants segment, comprising dairy cattle, beef cattle, and other ruminants, represents a substantial portion of the market, with amino acids being the primary additive used for protein synthesis and metabolic functions. The aquaculture segment, though smaller, is gaining importance due to the growing focus on fish farming in countries like Egypt and Nigeria. The other animals segment, which includes horses, rabbits, and other livestock, contributes to market diversity by creating demand for specialized feed additive formulations tailored to specific animal needs.
Africa Feed Additives Market Geography Segment Analysis
Africa Feed Additives Market in South Africa
South Africa dominates the African feed additives market, commanding approximately 45% of the total market value in 2024. The country's market leadership is driven by its advanced commercial animal production sector and sophisticated animal feed additives manufacturing infrastructure. The poultry segment plays a pivotal role, with broilers and layers being the primary consumers of feed additives. The country's robust distribution network and strong presence of international feed additive manufacturers have contributed to market growth. South Africa's feed additives market is expected to grow at nearly 5% annually from 2024 to 2029, supported by increasing investments in animal production technologies and rising demand for high-quality meat and dairy products. The country's focus on improving feed efficiency and animal productivity through advanced nutrition solutions has made it a benchmark for other African nations. The market is characterized by a strong preference for feed minerals and amino acids, reflecting the sophisticated understanding of nutritional requirements in modern animal farming.
Africa Feed Additives Market in Egypt
Egypt has established itself as a significant player in the African animal feed additives market, particularly in the aquaculture and poultry segments. The country's strategic location and well-developed agricultural sector have made it a crucial market for feed additive manufacturers. Egypt's market is characterized by a strong focus on amino acids and binders, which are essential for improving feed efficiency and animal performance. The country's poultry industry, which accounts for a significant portion of feed additive consumption, continues to expand with increasing investments in modern farming practices. The government's support for agricultural modernization and focus on improving domestic meat production has created favorable conditions for market growth. Egypt's feed manufacturing sector has shown remarkable adaptability in incorporating new feed additive technologies, particularly in aquaculture feed formulations. The country's commitment to enhancing food security through improved animal production has led to increased adoption of premium feed additives.
Africa Feed Additives Market in Kenya
Kenya has emerged as a key market for feed additives in East Africa, driven by its growing livestock sector and increasing awareness of animal nutrition. The country's market is characterized by a strong presence of both international and regional feed additive suppliers, creating a competitive environment that benefits end-users. Kenya's dairy sector has been particularly influential in driving demand for high-quality feed additives, especially feed minerals and feed vitamins. The country's feed manufacturing industry has shown significant progress in adopting modern feed formulation techniques, incorporating various additives to enhance feed quality. The government's support through favorable agricultural policies and investment in livestock development has created a conducive environment for market growth. Kenya's position as a regional hub for East African trade has also contributed to its importance in the feed additives market, facilitating distribution across neighboring countries. The market has seen increasing adoption of feed probiotics and enzymes, reflecting growing awareness of gut health in animal nutrition.
Africa Feed Additives Market in Other Countries
The feed additives market in other African countries presents a diverse landscape with varying levels of development and adoption. Countries like Nigeria, Morocco, and Tanzania are showing promising growth potential, driven by increasing investments in livestock production and growing awareness of animal nutrition. The market in these regions is characterized by a mix of traditional and modern farming practices, creating unique opportunities for feed additive manufacturers. Several countries are witnessing a gradual shift towards commercial farming, particularly in poultry and dairy sectors, driving demand for quality feed additives. Regional cooperation and knowledge sharing among African nations have helped in spreading awareness about the benefits of feed additives. Local feed manufacturers in these countries are increasingly partnering with international suppliers to improve their product offerings and technical expertise. The growing middle class and changing dietary preferences in many African countries are creating new opportunities for the feed additives market, particularly in urban areas.
Get Analysis on Important Geographic Markets
Download PDF
Africa Feed Additives Industry Overview
Top Companies in Africa Feed Additives Market
The feed additives market in Africa is characterized by the strong presence of global players like Adisseo, SHV (Nutreco NV), Archer Daniels Midland Co., DSM Nutritional Products AG, and Evonik Industries AG. These companies are actively pursuing product innovation strategies, particularly in developing new enzyme products, minerals, and probiotics tailored to regional requirements. Operational agility is demonstrated through extensive distribution networks and strategic partnerships with local players to enhance market penetration. Companies are expanding their presence through acquisitions of regional players and the establishment of production facilities across different African countries. The focus on research and development capabilities has enabled these companies to introduce advanced feed additive solutions while maintaining competitive pricing strategies.
Fragmented Market with Strong Global Players
The African feed additives market exhibits a highly fragmented structure, with major global conglomerates competing alongside regional specialists. These multinational companies leverage their extensive research capabilities, technological expertise, and global supply chain networks to maintain their market positions. The market is characterized by a mix of large-scale manufacturers and smaller regional players, with global companies often establishing local manufacturing facilities to better serve regional demands and reduce operational costs.
The market has witnessed significant merger and acquisition activities as companies seek to strengthen their product portfolios and geographical presence. Global players are increasingly focusing on strategic partnerships with local distributors and manufacturers to enhance their market reach and understanding of regional requirements. This trend of consolidation is particularly evident in key markets like South Africa and Egypt, where companies are establishing strong operational bases to serve the broader African market.
Innovation and Local Partnerships Drive Growth
Success in the African animal feed additives market increasingly depends on companies' ability to develop region-specific solutions while maintaining cost competitiveness. Market leaders are focusing on developing innovative products that address specific regional challenges such as climate conditions and local livestock requirements. Companies are also investing in building strong relationships with local feed manufacturers and livestock producers, while establishing robust distribution networks to ensure product availability across different regions.
For new entrants and existing players looking to expand their market share, developing strong local partnerships and understanding regional regulatory frameworks is crucial. Companies need to focus on offering customized solutions while maintaining competitive pricing to address the price-sensitive nature of the market. The ability to provide technical support and education to end-users about product benefits is becoming increasingly important. Additionally, companies need to maintain strong quality control measures and comply with evolving regulatory standards while building long-term relationships with key stakeholders in the value chain. The introduction of feed supplement solutions is also gaining traction as companies aim to meet the diverse nutritional needs of livestock.
Africa Feed Additives Market Leaders
-
Adisseo
-
Archer Daniel Midland Co.
-
DSM Nutritional Products AG
-
Evonik Industries AG
-
SHV (Nutreco NV)
- *Disclaimer: Major Players sorted in no particular order

Need More Details on Market Players and Competiters?
Download PDF
Africa Feed Additives Market News
- December 2022: Adisseo group had agreed to acquire Nor-Feed and its subsidiaries to develop and register botanical additives for use in animal feed.
- November 2022: Kemin Industries introduced Toxfin Care, a solution that protects feed from mycotoxins. It strengthens the immune system, protects organs, and prevents loss of performance and productivity.
- October 2022: The partnership between Evonik and BASF allowed Evonik certain non-exclusive licensing rights to OpteinicsTM, a digital solution to improve comprehension and reduce the environmental impact of the animal protein and feed industries.
Free With This Report
We provide a complimentary and exhaustive set of data points on regional and country-level metrics that present the fundamental structure of the industry. Presented in the form of 35+ free charts, the section covers difficult-to-find data of various regions on feed production through various animal categories such as Ruminants, Poultry, Swine, and Aquaculture.


Africa Feed Additives Market Report - Table of Contents
1. EXECUTIVE SUMMARY & KEY FINDINGS
2. REPORT OFFERS
3. INTRODUCTION
- 3.1 Study Assumptions & Market Definition
- 3.2 Scope of the Study
- 3.3 Research Methodology
4. KEY INDUSTRY TRENDS
-
4.1 Animal Headcount
- 4.1.1 Poultry
- 4.1.2 Ruminants
- 4.1.3 Swine
-
4.2 Feed Production
- 4.2.1 Aquaculture
- 4.2.2 Poultry
- 4.2.3 Ruminants
- 4.2.4 Swine
-
4.3 Regulatory Framework
- 4.3.1 Egypt
- 4.3.2 Kenya
- 4.3.3 South Africa
- 4.4 Value Chain & Distribution Channel Analysis
5. MARKET SEGMENTATION (includes market size in Value in USD and Volume, Forecasts up to 2030 and analysis of growth prospects)
-
5.1 Additive
- 5.1.1 Acidifiers
- 5.1.1.1 By Sub Additive
- 5.1.1.1.1 Fumaric Acid
- 5.1.1.1.2 Lactic Acid
- 5.1.1.1.3 Propionic Acid
- 5.1.1.1.4 Other Acidifiers
- 5.1.2 Amino Acids
- 5.1.2.1 By Sub Additive
- 5.1.2.1.1 Lysine
- 5.1.2.1.2 Methionine
- 5.1.2.1.3 Threonine
- 5.1.2.1.4 Tryptophan
- 5.1.2.1.5 Other Amino Acids
- 5.1.3 Antibiotics
- 5.1.3.1 By Sub Additive
- 5.1.3.1.1 Bacitracin
- 5.1.3.1.2 Penicillins
- 5.1.3.1.3 Tetracyclines
- 5.1.3.1.4 Tylosin
- 5.1.3.1.5 Other Antibiotics
- 5.1.4 Antioxidants
- 5.1.4.1 By Sub Additive
- 5.1.4.1.1 Butylated Hydroxyanisole (BHA)
- 5.1.4.1.2 Butylated Hydroxytoluene (BHT)
- 5.1.4.1.3 Citric Acid
- 5.1.4.1.4 Ethoxyquin
- 5.1.4.1.5 Propyl Gallate
- 5.1.4.1.6 Tocopherols
- 5.1.4.1.7 Other Antioxidants
- 5.1.5 Binders
- 5.1.5.1 By Sub Additive
- 5.1.5.1.1 Natural Binders
- 5.1.5.1.2 Synthetic Binders
- 5.1.6 Enzymes
- 5.1.6.1 By Sub Additive
- 5.1.6.1.1 Carbohydrases
- 5.1.6.1.2 Phytases
- 5.1.6.1.3 Other Enzymes
- 5.1.7 Flavors & Sweeteners
- 5.1.7.1 By Sub Additive
- 5.1.7.1.1 Flavors
- 5.1.7.1.2 Sweeteners
- 5.1.8 Minerals
- 5.1.8.1 By Sub Additive
- 5.1.8.1.1 Macrominerals
- 5.1.8.1.2 Microminerals
- 5.1.9 Mycotoxin Detoxifiers
- 5.1.9.1 By Sub Additive
- 5.1.9.1.1 Binders
- 5.1.9.1.2 Biotransformers
- 5.1.10 Phytogenics
- 5.1.10.1 By Sub Additive
- 5.1.10.1.1 Essential Oil
- 5.1.10.1.2 Herbs & Spices
- 5.1.10.1.3 Other Phytogenics
- 5.1.11 Pigments
- 5.1.11.1 By Sub Additive
- 5.1.11.1.1 Carotenoids
- 5.1.11.1.2 Curcumin & Spirulina
- 5.1.12 Prebiotics
- 5.1.12.1 By Sub Additive
- 5.1.12.1.1 Fructo Oligosaccharides
- 5.1.12.1.2 Galacto Oligosaccharides
- 5.1.12.1.3 Inulin
- 5.1.12.1.4 Lactulose
- 5.1.12.1.5 Mannan Oligosaccharides
- 5.1.12.1.6 Xylo Oligosaccharides
- 5.1.12.1.7 Other Prebiotics
- 5.1.13 Probiotics
- 5.1.13.1 By Sub Additive
- 5.1.13.1.1 Bifidobacteria
- 5.1.13.1.2 Enterococcus
- 5.1.13.1.3 Lactobacilli
- 5.1.13.1.4 Pediococcus
- 5.1.13.1.5 Streptococcus
- 5.1.13.1.6 Other Probiotics
- 5.1.14 Vitamins
- 5.1.14.1 By Sub Additive
- 5.1.14.1.1 Vitamin A
- 5.1.14.1.2 Vitamin B
- 5.1.14.1.3 Vitamin C
- 5.1.14.1.4 Vitamin E
- 5.1.14.1.5 Other Vitamins
- 5.1.15 Yeast
- 5.1.15.1 By Sub Additive
- 5.1.15.1.1 Live Yeast
- 5.1.15.1.2 Selenium Yeast
- 5.1.15.1.3 Spent Yeast
- 5.1.15.1.4 Torula Dried Yeast
- 5.1.15.1.5 Whey Yeast
- 5.1.15.1.6 Yeast Derivatives
-
5.2 Animal
- 5.2.1 Aquaculture
- 5.2.1.1 By Sub Animal
- 5.2.1.1.1 Fish
- 5.2.1.1.2 Shrimp
- 5.2.1.1.3 Other Aquaculture Species
- 5.2.2 Poultry
- 5.2.2.1 By Sub Animal
- 5.2.2.1.1 Broiler
- 5.2.2.1.2 Layer
- 5.2.2.1.3 Other Poultry Birds
- 5.2.3 Ruminants
- 5.2.3.1 By Sub Animal
- 5.2.3.1.1 Beef Cattle
- 5.2.3.1.2 Dairy Cattle
- 5.2.3.1.3 Other Ruminants
- 5.2.4 Swine
- 5.2.5 Other Animals
-
5.3 Country
- 5.3.1 Egypt
- 5.3.2 Kenya
- 5.3.3 South Africa
- 5.3.4 Rest of Africa
6. COMPETITIVE LANDSCAPE
- 6.1 Key Strategic Moves
- 6.2 Market Share Analysis
- 6.3 Company Landscape
-
6.4 Company Profiles (includes Global Level Overview, Market Level Overview, Core Business Segments, Financials, Headcount, Key Information, Market Rank, Market Share, Products and Services, and Analysis of Recent Developments).
- 6.4.1 Adisseo
- 6.4.2 Archer Daniel Midland Co.
- 6.4.3 BASF SE
- 6.4.4 Brenntag SE
- 6.4.5 Cargill Inc.
- 6.4.6 DSM Nutritional Products AG
- 6.4.7 Evonik Industries AG
- 6.4.8 IFF(Danisco Animal Nutrition)
- 6.4.9 Kemin Industries
- 6.4.10 SHV (Nutreco NV)
7. KEY STRATEGIC QUESTIONS FOR FEED ADDITIVE CEOS
8. APPENDIX
-
8.1 Global Overview
- 8.1.1 Overview
- 8.1.2 Porter’s Five Forces Framework
- 8.1.3 Global Value Chain Analysis
- 8.1.4 Global Market Size and DROs
- 8.2 Sources & References
- 8.3 List of Tables & Figures
- 8.4 Primary Insights
- 8.5 Data Pack
- 8.6 Glossary of Terms
You Can Purchase Parts Of This Report. Check Out Prices For Specific Sections
Get Price Break-up Now
List of Tables & Figures
- Figure 1:
- POPULATION OF POULTRY, NUMBER, AFRICA, 2017-2022
- Figure 2:
- POPULATION OF RUMINANTS, NUMBER, AFRICA, 2017-2022
- Figure 3:
- POPULATION OF SWINE, NUMBER, AFRICA, 2017-2022
- Figure 4:
- PRODUCTION VOLUME OF AQUACULTURE FEED, METRIC TON, AFRICA, 2017-2022
- Figure 5:
- PRODUCTION VOLUME OF POULTRY FEED, METRIC TON, AFRICA, 2017-2022
- Figure 6:
- PRODUCTION VOLUME OF RUMINANTS FEED, METRIC TON, AFRICA, 2017-2022
- Figure 7:
- PRODUCTION VOLUME OF SWINE FEED, METRIC TON, AFRICA, 2017-2022
- Figure 8:
- VOLUME OF FEED ADDITIVE, METRIC TON, AFRICA, 2017 - 2029
- Figure 9:
- VALUE OF FEED ADDITIVE, USD, AFRICA, 2017 - 2029
- Figure 10:
- VOLUME OF FEED ADDITIVE BY ADDITIVE CATEGORIES, METRIC TON, AFRICA, 2017 - 2029
- Figure 11:
- VALUE OF FEED ADDITIVE BY ADDITIVE CATEGORIES, USD, AFRICA, 2017 - 2029
- Figure 12:
- VOLUME SHARE OF FEED ADDITIVE BY ADDITIVE CATEGORIES, %, AFRICA, 2017,2023 AND 2029
- Figure 13:
- VALUE SHARE OF FEED ADDITIVE BY ADDITIVE CATEGORIES, %, AFRICA, 2017,2023 AND 2029
- Figure 14:
- VOLUME OF FEED ACIDIFIERS BY SUB ADDITIVE CATEGORIES, METRIC TON, AFRICA, 2017 - 2029
- Figure 15:
- VALUE OF FEED ACIDIFIERS BY SUB ADDITIVE CATEGORIES, USD, AFRICA, 2017 - 2029
- Figure 16:
- VOLUME SHARE OF FEED ACIDIFIERS BY SUB ADDITIVE CATEGORIES, %, AFRICA, 2017,2023 AND 2029
- Figure 17:
- VALUE SHARE OF FEED ACIDIFIERS BY SUB ADDITIVE CATEGORIES, %, AFRICA, 2017,2023 AND 2029
- Figure 18:
- VOLUME OF FUMARIC ACID FEED ACIDIFIERS, METRIC TON, AFRICA, 2017 - 2029
- Figure 19:
- VALUE OF FUMARIC ACID FEED ACIDIFIERS, USD, AFRICA, 2017 - 2029
- Figure 20:
- VOLUME OF LACTIC ACID FEED ACIDIFIERS, METRIC TON, AFRICA, 2017 - 2029
- Figure 21:
- VALUE OF LACTIC ACID FEED ACIDIFIERS, USD, AFRICA, 2017 - 2029
- Figure 22:
- VOLUME OF PROPIONIC ACID FEED ACIDIFIERS, METRIC TON, AFRICA, 2017 - 2029
- Figure 23:
- VALUE OF PROPIONIC ACID FEED ACIDIFIERS, USD, AFRICA, 2017 - 2029
- Figure 24:
- VOLUME OF OTHER ACIDIFIERS FEED ACIDIFIERS, METRIC TON, AFRICA, 2017 - 2029
- Figure 25:
- VALUE OF OTHER ACIDIFIERS FEED ACIDIFIERS, USD, AFRICA, 2017 - 2029
- Figure 26:
- VOLUME OF FEED AMINO ACIDS BY SUB ADDITIVE CATEGORIES, METRIC TON, AFRICA, 2017 - 2029
- Figure 27:
- VALUE OF FEED AMINO ACIDS BY SUB ADDITIVE CATEGORIES, USD, AFRICA, 2017 - 2029
- Figure 28:
- VOLUME SHARE OF FEED AMINO ACIDS BY SUB ADDITIVE CATEGORIES, %, AFRICA, 2017,2023 AND 2029
- Figure 29:
- VALUE SHARE OF FEED AMINO ACIDS BY SUB ADDITIVE CATEGORIES, %, AFRICA, 2017,2023 AND 2029
- Figure 30:
- VOLUME OF LYSINE FEED AMINO ACIDS, METRIC TON, AFRICA, 2017 - 2029
- Figure 31:
- VALUE OF LYSINE FEED AMINO ACIDS, USD, AFRICA, 2017 - 2029
- Figure 32:
- VOLUME OF METHIONINE FEED AMINO ACIDS, METRIC TON, AFRICA, 2017 - 2029
- Figure 33:
- VALUE OF METHIONINE FEED AMINO ACIDS, USD, AFRICA, 2017 - 2029
- Figure 34:
- VOLUME OF THREONINE FEED AMINO ACIDS, METRIC TON, AFRICA, 2017 - 2029
- Figure 35:
- VALUE OF THREONINE FEED AMINO ACIDS, USD, AFRICA, 2017 - 2029
- Figure 36:
- VOLUME OF TRYPTOPHAN FEED AMINO ACIDS, METRIC TON, AFRICA, 2017 - 2029
- Figure 37:
- VALUE OF TRYPTOPHAN FEED AMINO ACIDS, USD, AFRICA, 2017 - 2029
- Figure 38:
- VOLUME OF OTHER AMINO ACIDS FEED AMINO ACIDS, METRIC TON, AFRICA, 2017 - 2029
- Figure 39:
- VALUE OF OTHER AMINO ACIDS FEED AMINO ACIDS, USD, AFRICA, 2017 - 2029
- Figure 40:
- VOLUME OF FEED ANTIBIOTICS BY SUB ADDITIVE CATEGORIES, METRIC TON, AFRICA, 2017 - 2029
- Figure 41:
- VALUE OF FEED ANTIBIOTICS BY SUB ADDITIVE CATEGORIES, USD, AFRICA, 2017 - 2029
- Figure 42:
- VOLUME SHARE OF FEED ANTIBIOTICS BY SUB ADDITIVE CATEGORIES, %, AFRICA, 2017,2023 AND 2029
- Figure 43:
- VALUE SHARE OF FEED ANTIBIOTICS BY SUB ADDITIVE CATEGORIES, %, AFRICA, 2017,2023 AND 2029
- Figure 44:
- VOLUME OF BACITRACIN FEED ANTIBIOTICS, METRIC TON, AFRICA, 2017 - 2029
- Figure 45:
- VALUE OF BACITRACIN FEED ANTIBIOTICS, USD, AFRICA, 2017 - 2029
- Figure 46:
- VOLUME OF PENICILLINS FEED ANTIBIOTICS, METRIC TON, AFRICA, 2017 - 2029
- Figure 47:
- VALUE OF PENICILLINS FEED ANTIBIOTICS, USD, AFRICA, 2017 - 2029
- Figure 48:
- VOLUME OF TETRACYCLINES FEED ANTIBIOTICS, METRIC TON, AFRICA, 2017 - 2029
- Figure 49:
- VALUE OF TETRACYCLINES FEED ANTIBIOTICS, USD, AFRICA, 2017 - 2029
- Figure 50:
- VOLUME OF TYLOSIN FEED ANTIBIOTICS, METRIC TON, AFRICA, 2017 - 2029
- Figure 51:
- VALUE OF TYLOSIN FEED ANTIBIOTICS, USD, AFRICA, 2017 - 2029
- Figure 52:
- VOLUME OF OTHER ANTIBIOTICS FEED ANTIBIOTICS, METRIC TON, AFRICA, 2017 - 2029
- Figure 53:
- VALUE OF OTHER ANTIBIOTICS FEED ANTIBIOTICS, USD, AFRICA, 2017 - 2029
- Figure 54:
- VOLUME OF FEED ANTIOXIDANTS BY SUB ADDITIVE CATEGORIES, METRIC TON, AFRICA, 2017 - 2029
- Figure 55:
- VALUE OF FEED ANTIOXIDANTS BY SUB ADDITIVE CATEGORIES, USD, AFRICA, 2017 - 2029
- Figure 56:
- VOLUME SHARE OF FEED ANTIOXIDANTS BY SUB ADDITIVE CATEGORIES, %, AFRICA, 2017,2023 AND 2029
- Figure 57:
- VALUE SHARE OF FEED ANTIOXIDANTS BY SUB ADDITIVE CATEGORIES, %, AFRICA, 2017,2023 AND 2029
- Figure 58:
- VOLUME OF BUTYLATED HYDROXYANISOLE (BHA) FEED ANTIOXIDANTS, METRIC TON, AFRICA, 2017 - 2029
- Figure 59:
- VALUE OF BUTYLATED HYDROXYANISOLE (BHA) FEED ANTIOXIDANTS, USD, AFRICA, 2017 - 2029
- Figure 60:
- VOLUME OF BUTYLATED HYDROXYTOLUENE (BHT) FEED ANTIOXIDANTS, METRIC TON, AFRICA, 2017 - 2029
- Figure 61:
- VALUE OF BUTYLATED HYDROXYTOLUENE (BHT) FEED ANTIOXIDANTS, USD, AFRICA, 2017 - 2029
- Figure 62:
- VOLUME OF CITRIC ACID FEED ANTIOXIDANTS, METRIC TON, AFRICA, 2017 - 2029
- Figure 63:
- VALUE OF CITRIC ACID FEED ANTIOXIDANTS, USD, AFRICA, 2017 - 2029
- Figure 64:
- VOLUME OF ETHOXYQUIN FEED ANTIOXIDANTS, METRIC TON, AFRICA, 2017 - 2029
- Figure 65:
- VALUE OF ETHOXYQUIN FEED ANTIOXIDANTS, USD, AFRICA, 2017 - 2029
- Figure 66:
- VOLUME OF PROPYL GALLATE FEED ANTIOXIDANTS, METRIC TON, AFRICA, 2017 - 2029
- Figure 67:
- VALUE OF PROPYL GALLATE FEED ANTIOXIDANTS, USD, AFRICA, 2017 - 2029
- Figure 68:
- VOLUME OF TOCOPHEROLS FEED ANTIOXIDANTS, METRIC TON, AFRICA, 2017 - 2029
- Figure 69:
- VALUE OF TOCOPHEROLS FEED ANTIOXIDANTS, USD, AFRICA, 2017 - 2029
- Figure 70:
- VOLUME OF OTHER ANTIOXIDANTS FEED ANTIOXIDANTS, METRIC TON, AFRICA, 2017 - 2029
- Figure 71:
- VALUE OF OTHER ANTIOXIDANTS FEED ANTIOXIDANTS, USD, AFRICA, 2017 - 2029
- Figure 72:
- VOLUME OF FEED BINDERS BY SUB ADDITIVE CATEGORIES, METRIC TON, AFRICA, 2017 - 2029
- Figure 73:
- VALUE OF FEED BINDERS BY SUB ADDITIVE CATEGORIES, USD, AFRICA, 2017 - 2029
- Figure 74:
- VOLUME SHARE OF FEED BINDERS BY SUB ADDITIVE CATEGORIES, %, AFRICA, 2017,2023 AND 2029
- Figure 75:
- VALUE SHARE OF FEED BINDERS BY SUB ADDITIVE CATEGORIES, %, AFRICA, 2017,2023 AND 2029
- Figure 76:
- VOLUME OF NATURAL BINDERS FEED BINDERS, METRIC TON, AFRICA, 2017 - 2029
- Figure 77:
- VALUE OF NATURAL BINDERS FEED BINDERS, USD, AFRICA, 2017 - 2029
- Figure 78:
- VOLUME OF SYNTHETIC BINDERS FEED BINDERS, METRIC TON, AFRICA, 2017 - 2029
- Figure 79:
- VALUE OF SYNTHETIC BINDERS FEED BINDERS, USD, AFRICA, 2017 - 2029
- Figure 80:
- VOLUME OF FEED ENZYMES BY SUB ADDITIVE CATEGORIES, METRIC TON, AFRICA, 2017 - 2029
- Figure 81:
- VALUE OF FEED ENZYMES BY SUB ADDITIVE CATEGORIES, USD, AFRICA, 2017 - 2029
- Figure 82:
- VOLUME SHARE OF FEED ENZYMES BY SUB ADDITIVE CATEGORIES, %, AFRICA, 2017,2023 AND 2029
- Figure 83:
- VALUE SHARE OF FEED ENZYMES BY SUB ADDITIVE CATEGORIES, %, AFRICA, 2017,2023 AND 2029
- Figure 84:
- VOLUME OF CARBOHYDRASES FEED ENZYMES, METRIC TON, AFRICA, 2017 - 2029
- Figure 85:
- VALUE OF CARBOHYDRASES FEED ENZYMES, USD, AFRICA, 2017 - 2029
- Figure 86:
- VOLUME OF PHYTASES FEED ENZYMES, METRIC TON, AFRICA, 2017 - 2029
- Figure 87:
- VALUE OF PHYTASES FEED ENZYMES, USD, AFRICA, 2017 - 2029
- Figure 88:
- VOLUME OF OTHER ENZYMES FEED ENZYMES, METRIC TON, AFRICA, 2017 - 2029
- Figure 89:
- VALUE OF OTHER ENZYMES FEED ENZYMES, USD, AFRICA, 2017 - 2029
- Figure 90:
- VOLUME OF FEED FLAVORS & SWEETENERS BY SUB ADDITIVE CATEGORIES, METRIC TON, AFRICA, 2017 - 2029
- Figure 91:
- VALUE OF FEED FLAVORS & SWEETENERS BY SUB ADDITIVE CATEGORIES, USD, AFRICA, 2017 - 2029
- Figure 92:
- VOLUME SHARE OF FEED FLAVORS & SWEETENERS BY SUB ADDITIVE CATEGORIES, %, AFRICA, 2017,2023 AND 2029
- Figure 93:
- VALUE SHARE OF FEED FLAVORS & SWEETENERS BY SUB ADDITIVE CATEGORIES, %, AFRICA, 2017,2023 AND 2029
- Figure 94:
- VOLUME OF FLAVORS FEED FLAVORS & SWEETENERS, METRIC TON, AFRICA, 2017 - 2029
- Figure 95:
- VALUE OF FLAVORS FEED FLAVORS & SWEETENERS, USD, AFRICA, 2017 - 2029
- Figure 96:
- VOLUME OF SWEETENERS FEED FLAVORS & SWEETENERS, METRIC TON, AFRICA, 2017 - 2029
- Figure 97:
- VALUE OF SWEETENERS FEED FLAVORS & SWEETENERS, USD, AFRICA, 2017 - 2029
- Figure 98:
- VOLUME OF FEED MINERALS BY SUB ADDITIVE CATEGORIES, METRIC TON, AFRICA, 2017 - 2029
- Figure 99:
- VALUE OF FEED MINERALS BY SUB ADDITIVE CATEGORIES, USD, AFRICA, 2017 - 2029
- Figure 100:
- VOLUME SHARE OF FEED MINERALS BY SUB ADDITIVE CATEGORIES, %, AFRICA, 2017,2023 AND 2029
- Figure 101:
- VALUE SHARE OF FEED MINERALS BY SUB ADDITIVE CATEGORIES, %, AFRICA, 2017,2023 AND 2029
- Figure 102:
- VOLUME OF MACROMINERALS FEED MINERALS, METRIC TON, AFRICA, 2017 - 2029
- Figure 103:
- VALUE OF MACROMINERALS FEED MINERALS, USD, AFRICA, 2017 - 2029
- Figure 104:
- VOLUME OF MICROMINERALS FEED MINERALS, METRIC TON, AFRICA, 2017 - 2029
- Figure 105:
- VALUE OF MICROMINERALS FEED MINERALS, USD, AFRICA, 2017 - 2029
- Figure 106:
- VOLUME OF FEED MYCOTOXIN DETOXIFIERS BY SUB ADDITIVE CATEGORIES, METRIC TON, AFRICA, 2017 - 2029
- Figure 107:
- VALUE OF FEED MYCOTOXIN DETOXIFIERS BY SUB ADDITIVE CATEGORIES, USD, AFRICA, 2017 - 2029
- Figure 108:
- VOLUME SHARE OF FEED MYCOTOXIN DETOXIFIERS BY SUB ADDITIVE CATEGORIES, %, AFRICA, 2017,2023 AND 2029
- Figure 109:
- VALUE SHARE OF FEED MYCOTOXIN DETOXIFIERS BY SUB ADDITIVE CATEGORIES, %, AFRICA, 2017,2023 AND 2029
- Figure 110:
- VOLUME OF BINDERS FEED MYCOTOXIN DETOXIFIERS, METRIC TON, AFRICA, 2017 - 2029
- Figure 111:
- VALUE OF BINDERS FEED MYCOTOXIN DETOXIFIERS, USD, AFRICA, 2017 - 2029
- Figure 112:
- VOLUME OF BIOTRANSFORMERS FEED MYCOTOXIN DETOXIFIERS, METRIC TON, AFRICA, 2017 - 2029
- Figure 113:
- VALUE OF BIOTRANSFORMERS FEED MYCOTOXIN DETOXIFIERS, USD, AFRICA, 2017 - 2029
- Figure 114:
- VOLUME OF FEED PHYTOGENICS BY SUB ADDITIVE CATEGORIES, METRIC TON, AFRICA, 2017 - 2029
- Figure 115:
- VALUE OF FEED PHYTOGENICS BY SUB ADDITIVE CATEGORIES, USD, AFRICA, 2017 - 2029
- Figure 116:
- VOLUME SHARE OF FEED PHYTOGENICS BY SUB ADDITIVE CATEGORIES, %, AFRICA, 2017,2023 AND 2029
- Figure 117:
- VALUE SHARE OF FEED PHYTOGENICS BY SUB ADDITIVE CATEGORIES, %, AFRICA, 2017,2023 AND 2029
- Figure 118:
- VOLUME OF ESSENTIAL OIL FEED PHYTOGENICS, METRIC TON, AFRICA, 2017 - 2029
- Figure 119:
- VALUE OF ESSENTIAL OIL FEED PHYTOGENICS, USD, AFRICA, 2017 - 2029
- Figure 120:
- VOLUME OF HERBS & SPICES FEED PHYTOGENICS, METRIC TON, AFRICA, 2017 - 2029
- Figure 121:
- VALUE OF HERBS & SPICES FEED PHYTOGENICS, USD, AFRICA, 2017 - 2029
- Figure 122:
- VOLUME OF OTHER PHYTOGENICS FEED PHYTOGENICS, METRIC TON, AFRICA, 2017 - 2029
- Figure 123:
- VALUE OF OTHER PHYTOGENICS FEED PHYTOGENICS, USD, AFRICA, 2017 - 2029
- Figure 124:
- VOLUME OF FEED PIGMENTS BY SUB ADDITIVE CATEGORIES, METRIC TON, AFRICA, 2017 - 2029
- Figure 125:
- VALUE OF FEED PIGMENTS BY SUB ADDITIVE CATEGORIES, USD, AFRICA, 2017 - 2029
- Figure 126:
- VOLUME SHARE OF FEED PIGMENTS BY SUB ADDITIVE CATEGORIES, %, AFRICA, 2017,2023 AND 2029
- Figure 127:
- VALUE SHARE OF FEED PIGMENTS BY SUB ADDITIVE CATEGORIES, %, AFRICA, 2017,2023 AND 2029
- Figure 128:
- VOLUME OF CAROTENOIDS FEED PIGMENTS, METRIC TON, AFRICA, 2017 - 2029
- Figure 129:
- VALUE OF CAROTENOIDS FEED PIGMENTS, USD, AFRICA, 2017 - 2029
- Figure 130:
- VOLUME OF CURCUMIN & SPIRULINA FEED PIGMENTS, METRIC TON, AFRICA, 2017 - 2029
- Figure 131:
- VALUE OF CURCUMIN & SPIRULINA FEED PIGMENTS, USD, AFRICA, 2017 - 2029
- Figure 132:
- VOLUME OF FEED PREBIOTICS BY SUB ADDITIVE CATEGORIES, METRIC TON, AFRICA, 2017 - 2029
- Figure 133:
- VALUE OF FEED PREBIOTICS BY SUB ADDITIVE CATEGORIES, USD, AFRICA, 2017 - 2029
- Figure 134:
- VOLUME SHARE OF FEED PREBIOTICS BY SUB ADDITIVE CATEGORIES, %, AFRICA, 2017,2023 AND 2029
- Figure 135:
- VALUE SHARE OF FEED PREBIOTICS BY SUB ADDITIVE CATEGORIES, %, AFRICA, 2017,2023 AND 2029
- Figure 136:
- VOLUME OF FRUCTO OLIGOSACCHARIDES FEED PREBIOTICS, METRIC TON, AFRICA, 2017 - 2029
- Figure 137:
- VALUE OF FRUCTO OLIGOSACCHARIDES FEED PREBIOTICS, USD, AFRICA, 2017 - 2029
- Figure 138:
- VOLUME OF GALACTO OLIGOSACCHARIDES FEED PREBIOTICS, METRIC TON, AFRICA, 2017 - 2029
- Figure 139:
- VALUE OF GALACTO OLIGOSACCHARIDES FEED PREBIOTICS, USD, AFRICA, 2017 - 2029
- Figure 140:
- VOLUME OF INULIN FEED PREBIOTICS, METRIC TON, AFRICA, 2017 - 2029
- Figure 141:
- VALUE OF INULIN FEED PREBIOTICS, USD, AFRICA, 2017 - 2029
- Figure 142:
- VOLUME OF LACTULOSE FEED PREBIOTICS, METRIC TON, AFRICA, 2017 - 2029
- Figure 143:
- VALUE OF LACTULOSE FEED PREBIOTICS, USD, AFRICA, 2017 - 2029
- Figure 144:
- VOLUME OF MANNAN OLIGOSACCHARIDES FEED PREBIOTICS, METRIC TON, AFRICA, 2017 - 2029
- Figure 145:
- VALUE OF MANNAN OLIGOSACCHARIDES FEED PREBIOTICS, USD, AFRICA, 2017 - 2029
- Figure 146:
- VOLUME OF XYLO OLIGOSACCHARIDES FEED PREBIOTICS, METRIC TON, AFRICA, 2017 - 2029
- Figure 147:
- VALUE OF XYLO OLIGOSACCHARIDES FEED PREBIOTICS, USD, AFRICA, 2017 - 2029
- Figure 148:
- VOLUME OF OTHER PREBIOTICS FEED PREBIOTICS, METRIC TON, AFRICA, 2017 - 2029
- Figure 149:
- VALUE OF OTHER PREBIOTICS FEED PREBIOTICS, USD, AFRICA, 2017 - 2029
- Figure 150:
- VOLUME OF FEED PROBIOTICS BY SUB ADDITIVE CATEGORIES, METRIC TON, AFRICA, 2017 - 2029
- Figure 151:
- VALUE OF FEED PROBIOTICS BY SUB ADDITIVE CATEGORIES, USD, AFRICA, 2017 - 2029
- Figure 152:
- VOLUME SHARE OF FEED PROBIOTICS BY SUB ADDITIVE CATEGORIES, %, AFRICA, 2017,2023 AND 2029
- Figure 153:
- VALUE SHARE OF FEED PROBIOTICS BY SUB ADDITIVE CATEGORIES, %, AFRICA, 2017,2023 AND 2029
- Figure 154:
- VOLUME OF BIFIDOBACTERIA FEED PROBIOTICS, METRIC TON, AFRICA, 2017 - 2029
- Figure 155:
- VALUE OF BIFIDOBACTERIA FEED PROBIOTICS, USD, AFRICA, 2017 - 2029
- Figure 156:
- VOLUME OF ENTEROCOCCUS FEED PROBIOTICS, METRIC TON, AFRICA, 2017 - 2029
- Figure 157:
- VALUE OF ENTEROCOCCUS FEED PROBIOTICS, USD, AFRICA, 2017 - 2029
- Figure 158:
- VOLUME OF LACTOBACILLI FEED PROBIOTICS, METRIC TON, AFRICA, 2017 - 2029
- Figure 159:
- VALUE OF LACTOBACILLI FEED PROBIOTICS, USD, AFRICA, 2017 - 2029
- Figure 160:
- VOLUME OF PEDIOCOCCUS FEED PROBIOTICS, METRIC TON, AFRICA, 2017 - 2029
- Figure 161:
- VALUE OF PEDIOCOCCUS FEED PROBIOTICS, USD, AFRICA, 2017 - 2029
- Figure 162:
- VOLUME OF STREPTOCOCCUS FEED PROBIOTICS, METRIC TON, AFRICA, 2017 - 2029
- Figure 163:
- VALUE OF STREPTOCOCCUS FEED PROBIOTICS, USD, AFRICA, 2017 - 2029
- Figure 164:
- VOLUME OF OTHER PROBIOTICS FEED PROBIOTICS, METRIC TON, AFRICA, 2017 - 2029
- Figure 165:
- VALUE OF OTHER PROBIOTICS FEED PROBIOTICS, USD, AFRICA, 2017 - 2029
- Figure 166:
- VOLUME OF FEED VITAMINS BY SUB ADDITIVE CATEGORIES, METRIC TON, AFRICA, 2017 - 2029
- Figure 167:
- VALUE OF FEED VITAMINS BY SUB ADDITIVE CATEGORIES, USD, AFRICA, 2017 - 2029
- Figure 168:
- VOLUME SHARE OF FEED VITAMINS BY SUB ADDITIVE CATEGORIES, %, AFRICA, 2017,2023 AND 2029
- Figure 169:
- VALUE SHARE OF FEED VITAMINS BY SUB ADDITIVE CATEGORIES, %, AFRICA, 2017,2023 AND 2029
- Figure 170:
- VOLUME OF VITAMIN A FEED VITAMINS, METRIC TON, AFRICA, 2017 - 2029
- Figure 171:
- VALUE OF VITAMIN A FEED VITAMINS, USD, AFRICA, 2017 - 2029
- Figure 172:
- VOLUME OF VITAMIN B FEED VITAMINS, METRIC TON, AFRICA, 2017 - 2029
- Figure 173:
- VALUE OF VITAMIN B FEED VITAMINS, USD, AFRICA, 2017 - 2029
- Figure 174:
- VOLUME OF VITAMIN C FEED VITAMINS, METRIC TON, AFRICA, 2017 - 2029
- Figure 175:
- VALUE OF VITAMIN C FEED VITAMINS, USD, AFRICA, 2017 - 2029
- Figure 176:
- VOLUME OF VITAMIN E FEED VITAMINS, METRIC TON, AFRICA, 2017 - 2029
- Figure 177:
- VALUE OF VITAMIN E FEED VITAMINS, USD, AFRICA, 2017 - 2029
- Figure 178:
- VOLUME OF OTHER VITAMINS FEED VITAMINS, METRIC TON, AFRICA, 2017 - 2029
- Figure 179:
- VALUE OF OTHER VITAMINS FEED VITAMINS, USD, AFRICA, 2017 - 2029
- Figure 180:
- VOLUME OF FEED YEAST BY SUB ADDITIVE CATEGORIES, METRIC TON, AFRICA, 2017 - 2029
- Figure 181:
- VALUE OF FEED YEAST BY SUB ADDITIVE CATEGORIES, USD, AFRICA, 2017 - 2029
- Figure 182:
- VOLUME SHARE OF FEED YEAST BY SUB ADDITIVE CATEGORIES, %, AFRICA, 2017,2023 AND 2029
- Figure 183:
- VALUE SHARE OF FEED YEAST BY SUB ADDITIVE CATEGORIES, %, AFRICA, 2017,2023 AND 2029
- Figure 184:
- VOLUME OF LIVE YEAST FEED YEAST, METRIC TON, AFRICA, 2017 - 2029
- Figure 185:
- VALUE OF LIVE YEAST FEED YEAST, USD, AFRICA, 2017 - 2029
- Figure 186:
- VOLUME OF SELENIUM YEAST FEED YEAST, METRIC TON, AFRICA, 2017 - 2029
- Figure 187:
- VALUE OF SELENIUM YEAST FEED YEAST, USD, AFRICA, 2017 - 2029
- Figure 188:
- VOLUME OF SPENT YEAST FEED YEAST, METRIC TON, AFRICA, 2017 - 2029
- Figure 189:
- VALUE OF SPENT YEAST FEED YEAST, USD, AFRICA, 2017 - 2029
- Figure 190:
- VOLUME OF TORULA DRIED YEAST FEED YEAST, METRIC TON, AFRICA, 2017 - 2029
- Figure 191:
- VALUE OF TORULA DRIED YEAST FEED YEAST, USD, AFRICA, 2017 - 2029
- Figure 192:
- VOLUME OF WHEY YEAST FEED YEAST, METRIC TON, AFRICA, 2017 - 2029
- Figure 193:
- VALUE OF WHEY YEAST FEED YEAST, USD, AFRICA, 2017 - 2029
- Figure 194:
- VOLUME OF YEAST DERIVATIVES FEED YEAST, METRIC TON, AFRICA, 2017 - 2029
- Figure 195:
- VALUE OF YEAST DERIVATIVES FEED YEAST, USD, AFRICA, 2017 - 2029
- Figure 196:
- VOLUME OF FEED ADDITIVE BY ANIMAL TYPE, METRIC TON, AFRICA, 2017 - 2029
- Figure 197:
- VALUE OF FEED ADDITIVE BY ANIMAL TYPE, USD, AFRICA, 2017 - 2029
- Figure 198:
- VOLUME SHARE OF FEED ADDITIVE BY ANIMAL TYPE, %, AFRICA, 2017,2023 AND 2029
- Figure 199:
- VALUE SHARE OF FEED ADDITIVE BY ANIMAL TYPE, %, AFRICA, 2017,2023 AND 2029
- Figure 200:
- VOLUME OF AQUACULTURE FEED ADDITIVE BY SUB ANIMAL TYPE, METRIC TON, AFRICA, 2017 - 2029
- Figure 201:
- VALUE OF AQUACULTURE FEED ADDITIVE BY SUB ANIMAL TYPE, USD, AFRICA, 2017 - 2029
- Figure 202:
- VOLUME SHARE OF AQUACULTURE FEED ADDITIVE BY SUB ANIMAL TYPE, %, AFRICA, 2017,2023 AND 2029
- Figure 203:
- VALUE SHARE OF AQUACULTURE FEED ADDITIVE BY SUB ANIMAL TYPE, %, AFRICA, 2017,2023 AND 2029
- Figure 204:
- VOLUME OF FISH FEED ADDITIVE, METRIC TON, AFRICA, 2017 - 2029
- Figure 205:
- VALUE OF FISH FEED ADDITIVE, USD, AFRICA, 2017 - 2029
- Figure 206:
- VALUE SHARE OF FISH FEED ADDITIVE BY ADDITIVE CATEGORIES, %, AFRICA, 2022 AND 2029
- Figure 207:
- VOLUME OF SHRIMP FEED ADDITIVE, METRIC TON, AFRICA, 2017 - 2029
- Figure 208:
- VALUE OF SHRIMP FEED ADDITIVE, USD, AFRICA, 2017 - 2029
- Figure 209:
- VALUE SHARE OF SHRIMP FEED ADDITIVE BY ADDITIVE CATEGORIES, %, AFRICA, 2022 AND 2029
- Figure 210:
- VOLUME OF OTHER AQUACULTURE SPECIES FEED ADDITIVE, METRIC TON, AFRICA, 2017 - 2029
- Figure 211:
- VALUE OF OTHER AQUACULTURE SPECIES FEED ADDITIVE, USD, AFRICA, 2017 - 2029
- Figure 212:
- VALUE SHARE OF OTHER AQUACULTURE SPECIES FEED ADDITIVE BY ADDITIVE CATEGORIES, %, AFRICA, 2022 AND 2029
- Figure 213:
- VOLUME OF POULTRY FEED ADDITIVE BY SUB ANIMAL TYPE, METRIC TON, AFRICA, 2017 - 2029
- Figure 214:
- VALUE OF POULTRY FEED ADDITIVE BY SUB ANIMAL TYPE, USD, AFRICA, 2017 - 2029
- Figure 215:
- VOLUME SHARE OF POULTRY FEED ADDITIVE BY SUB ANIMAL TYPE, %, AFRICA, 2017,2023 AND 2029
- Figure 216:
- VALUE SHARE OF POULTRY FEED ADDITIVE BY SUB ANIMAL TYPE, %, AFRICA, 2017,2023 AND 2029
- Figure 217:
- VOLUME OF BROILER FEED ADDITIVE, METRIC TON, AFRICA, 2017 - 2029
- Figure 218:
- VALUE OF BROILER FEED ADDITIVE, USD, AFRICA, 2017 - 2029
- Figure 219:
- VALUE SHARE OF BROILER FEED ADDITIVE BY ADDITIVE CATEGORIES, %, AFRICA, 2022 AND 2029
- Figure 220:
- VOLUME OF LAYER FEED ADDITIVE, METRIC TON, AFRICA, 2017 - 2029
- Figure 221:
- VALUE OF LAYER FEED ADDITIVE, USD, AFRICA, 2017 - 2029
- Figure 222:
- VALUE SHARE OF LAYER FEED ADDITIVE BY ADDITIVE CATEGORIES, %, AFRICA, 2022 AND 2029
- Figure 223:
- VOLUME OF OTHER POULTRY BIRDS FEED ADDITIVE, METRIC TON, AFRICA, 2017 - 2029
- Figure 224:
- VALUE OF OTHER POULTRY BIRDS FEED ADDITIVE, USD, AFRICA, 2017 - 2029
- Figure 225:
- VALUE SHARE OF OTHER POULTRY BIRDS FEED ADDITIVE BY ADDITIVE CATEGORIES, %, AFRICA, 2022 AND 2029
- Figure 226:
- VOLUME OF RUMINANTS FEED ADDITIVE BY SUB ANIMAL TYPE, METRIC TON, AFRICA, 2017 - 2029
- Figure 227:
- VALUE OF RUMINANTS FEED ADDITIVE BY SUB ANIMAL TYPE, USD, AFRICA, 2017 - 2029
- Figure 228:
- VOLUME SHARE OF RUMINANTS FEED ADDITIVE BY SUB ANIMAL TYPE, %, AFRICA, 2017,2023 AND 2029
- Figure 229:
- VALUE SHARE OF RUMINANTS FEED ADDITIVE BY SUB ANIMAL TYPE, %, AFRICA, 2017,2023 AND 2029
- Figure 230:
- VOLUME OF BEEF CATTLE FEED ADDITIVE, METRIC TON, AFRICA, 2017 - 2029
- Figure 231:
- VALUE OF BEEF CATTLE FEED ADDITIVE, USD, AFRICA, 2017 - 2029
- Figure 232:
- VALUE SHARE OF BEEF CATTLE FEED ADDITIVE BY ADDITIVE CATEGORIES, %, AFRICA, 2022 AND 2029
- Figure 233:
- VOLUME OF DAIRY CATTLE FEED ADDITIVE, METRIC TON, AFRICA, 2017 - 2029
- Figure 234:
- VALUE OF DAIRY CATTLE FEED ADDITIVE, USD, AFRICA, 2017 - 2029
- Figure 235:
- VALUE SHARE OF DAIRY CATTLE FEED ADDITIVE BY ADDITIVE CATEGORIES, %, AFRICA, 2022 AND 2029
- Figure 236:
- VOLUME OF OTHER RUMINANTS FEED ADDITIVE, METRIC TON, AFRICA, 2017 - 2029
- Figure 237:
- VALUE OF OTHER RUMINANTS FEED ADDITIVE, USD, AFRICA, 2017 - 2029
- Figure 238:
- VALUE SHARE OF OTHER RUMINANTS FEED ADDITIVE BY ADDITIVE CATEGORIES, %, AFRICA, 2022 AND 2029
- Figure 239:
- VOLUME OF SWINE FEED ADDITIVE, METRIC TON, AFRICA, 2017 - 2029
- Figure 240:
- VALUE OF SWINE FEED ADDITIVE, USD, AFRICA, 2017 - 2029
- Figure 241:
- VALUE SHARE OF SWINE FEED ADDITIVE BY ADDITIVE CATEGORIES, %, AFRICA, 2022 AND 2029
- Figure 242:
- VOLUME OF OTHER ANIMALS FEED ADDITIVE, METRIC TON, AFRICA, 2017 - 2029
- Figure 243:
- VALUE OF OTHER ANIMALS FEED ADDITIVE, USD, AFRICA, 2017 - 2029
- Figure 244:
- VALUE SHARE OF OTHER ANIMALS FEED ADDITIVE BY ADDITIVE CATEGORIES, %, AFRICA, 2022 AND 2029
- Figure 245:
- VOLUME OF FEED ADDITIVE BY COUNTRY, METRIC TON, AFRICA, 2017 - 2029
- Figure 246:
- VALUE OF FEED ADDITIVE BY COUNTRY, USD, AFRICA, 2017 - 2029
- Figure 247:
- VOLUME SHARE OF FEED ADDITIVE BY COUNTRY, %, AFRICA, 2017,2023 AND 2029
- Figure 248:
- VALUE SHARE OF FEED ADDITIVE BY COUNTRY, %, AFRICA, 2017,2023 AND 2029
- Figure 249:
- VOLUME OF EGYPT FEED ADDITIVE, METRIC TON, AFRICA, 2017 - 2029
- Figure 250:
- VALUE OF EGYPT FEED ADDITIVE, USD, AFRICA, 2017 - 2029
- Figure 251:
- VALUE SHARE OF EGYPT FEED ADDITIVE BY ADDITIVE CATEGORIES, %, AFRICA, 2022 AND 2029
- Figure 252:
- VOLUME OF KENYA FEED ADDITIVE, METRIC TON, AFRICA, 2017 - 2029
- Figure 253:
- VALUE OF KENYA FEED ADDITIVE, USD, AFRICA, 2017 - 2029
- Figure 254:
- VALUE SHARE OF KENYA FEED ADDITIVE BY ADDITIVE CATEGORIES, %, AFRICA, 2022 AND 2029
- Figure 255:
- VOLUME OF SOUTH AFRICA FEED ADDITIVE, METRIC TON, AFRICA, 2017 - 2029
- Figure 256:
- VALUE OF SOUTH AFRICA FEED ADDITIVE, USD, AFRICA, 2017 - 2029
- Figure 257:
- VALUE SHARE OF SOUTH AFRICA FEED ADDITIVE BY ADDITIVE CATEGORIES, %, AFRICA, 2022 AND 2029
- Figure 258:
- VOLUME OF REST OF AFRICA FEED ADDITIVE, METRIC TON, AFRICA, 2017 - 2029
- Figure 259:
- VALUE OF REST OF AFRICA FEED ADDITIVE, USD, AFRICA, 2017 - 2029
- Figure 260:
- VALUE SHARE OF REST OF AFRICA FEED ADDITIVE BY ADDITIVE CATEGORIES, %, AFRICA, 2022 AND 2029
- Figure 261:
- MOST ACTIVE COMPANIES BY NUMBER OF STRATEGIC MOVES, COUNT, AFRICA, 2017 - 2023
- Figure 262:
- MOST ADOPTED STRATEGIES, COUNT, AFRICA, 2017 - 2023
- Figure 263:
- VALUE SHARE OF MAJOR PLAYERS, %, AFRICA
Africa Feed Additives Industry Segmentation
Acidifiers, Amino Acids, Antibiotics, Antioxidants, Binders, Enzymes, Flavors & Sweeteners, Minerals, Mycotoxin Detoxifiers, Phytogenics, Pigments, Prebiotics, Probiotics, Vitamins, Yeast are covered as segments by Additive. Aquaculture, Poultry, Ruminants, Swine are covered as segments by Animal. Egypt, Kenya, South Africa are covered as segments by Country.| Additive | Acidifiers | By Sub Additive | Fumaric Acid | |
| Lactic Acid | ||||
| Propionic Acid | ||||
| Other Acidifiers | ||||
| Amino Acids | By Sub Additive | Lysine | ||
| Methionine | ||||
| Threonine | ||||
| Tryptophan | ||||
| Other Amino Acids | ||||
| Antibiotics | By Sub Additive | Bacitracin | ||
| Penicillins | ||||
| Tetracyclines | ||||
| Tylosin | ||||
| Other Antibiotics | ||||
| Antioxidants | By Sub Additive | Butylated Hydroxyanisole (BHA) | ||
| Butylated Hydroxytoluene (BHT) | ||||
| Citric Acid | ||||
| Ethoxyquin | ||||
| Propyl Gallate | ||||
| Tocopherols | ||||
| Other Antioxidants | ||||
| Binders | By Sub Additive | Natural Binders | ||
| Synthetic Binders | ||||
| Enzymes | By Sub Additive | Carbohydrases | ||
| Phytases | ||||
| Other Enzymes | ||||
| Flavors & Sweeteners | By Sub Additive | Flavors | ||
| Sweeteners | ||||
| Minerals | By Sub Additive | Macrominerals | ||
| Microminerals | ||||
| Mycotoxin Detoxifiers | By Sub Additive | Binders | ||
| Biotransformers | ||||
| Phytogenics | By Sub Additive | Essential Oil | ||
| Herbs & Spices | ||||
| Other Phytogenics | ||||
| Pigments | By Sub Additive | Carotenoids | ||
| Curcumin & Spirulina | ||||
| Prebiotics | By Sub Additive | Fructo Oligosaccharides | ||
| Galacto Oligosaccharides | ||||
| Inulin | ||||
| Lactulose | ||||
| Mannan Oligosaccharides | ||||
| Xylo Oligosaccharides | ||||
| Other Prebiotics | ||||
| Probiotics | By Sub Additive | Bifidobacteria | ||
| Enterococcus | ||||
| Lactobacilli | ||||
| Pediococcus | ||||
| Streptococcus | ||||
| Other Probiotics | ||||
| Vitamins | By Sub Additive | Vitamin A | ||
| Vitamin B | ||||
| Vitamin C | ||||
| Vitamin E | ||||
| Other Vitamins | ||||
| Yeast | By Sub Additive | Live Yeast | ||
| Selenium Yeast | ||||
| Spent Yeast | ||||
| Torula Dried Yeast | ||||
| Whey Yeast | ||||
| Yeast Derivatives | ||||
| Animal | Aquaculture | By Sub Animal | Fish | |
| Shrimp | ||||
| Other Aquaculture Species | ||||
| Poultry | By Sub Animal | Broiler | ||
| Layer | ||||
| Other Poultry Birds | ||||
| Ruminants | By Sub Animal | Beef Cattle | ||
| Dairy Cattle | ||||
| Other Ruminants | ||||
| Swine | ||||
| Other Animals | ||||
| Country | Egypt | |||
| Kenya | ||||
| South Africa | ||||
| Rest of Africa | ||||
Need A Different Region or Segment?
Customize Now
Market Definition
- FUNCTIONS - For the study, feed additives are considered to be commercially manufactured products that are used to enhance characteristics such as weight gain, feed conversion ratio, and feed intake when fed in appropriate proportions.
- RESELLERS - Companies engaged in reselling feed additives without value addition have been excluded from the market scope, to avoid double counting.
- END CONSUMERS - Compound feed manufacturers are considered to be end-consumers in the market studied. The scope excludes farmers buying feed additives to be used directly as supplements or premixes.
- INTERNAL COMPANY CONSUMPTION - Companies engaged in the production of compound feed as well as the manufacturing of feed additives are part of the study. However, while estimating the market sizes, the internal consumption of feed additives by such companies has been excluded.
| Keyword | Definition |
|---|---|
| Feed additives | Feed additives are products used in animal nutrition for purposes of improving the quality of feed and the quality of food from animal origin, or to improve the animals’ performance and health. |
| Probiotics | Probiotics are microorganisms introduced into the body for their beneficial qualities. (It maintains or restores beneficial bacteria to the gut). |
| Antibiotics | Antibiotic is a drug that is specifically used to inhibit the growth of bacteria. |
| Prebiotics | A non-digestible food ingredient that promotes the growth of beneficial microorganisms in the intestines. |
| Antioxidants | Antioxidants are compounds that inhibit oxidation, a chemical reaction that produces free radicals. |
| Phytogenics | Phytogenics are a group of natural and non-antibiotic growth promoters derived from herbs, spices, essential oils, and oleoresins. |
| Vitamins | Vitamins are organic compounds, which are required for normal growth and maintenance of the body. |
| Metabolism | A chemical process that occurs within a living organism in order to maintain life. |
| Amino acids | Amino acids are the building blocks of proteins and play an important role in metabolic pathways. |
| Enzymes | Enzyme is a substance that acts as a catalyst to bring about a specific biochemical reaction. |
| Anti-microbial resistance | The ability of a microorganism to resist the effects of an antimicrobial agent. |
| Anti-microbial | Destroying or inhibiting the growth of microorganisms. |
| Osmotic balance | It is a process of maintaining salt and water balance across membranes within the body's fluids. |
| Bacteriocin | Bacteriocins are the toxins produced by bacteria to inhibit the growth of similar or closely related bacterial strains. |
| Biohydrogenation | It is a process that occurs in the rumen of an animal in which bacteria convert unsaturated fatty acids (USFA) to saturated fatty acids (SFA). |
| Oxidative rancidity | It is a reaction of fatty acids with oxygen, which generally causes unpleasant odors in animals. To prevent these, antioxidants were added. |
| Mycotoxicosis | Any condition or disease caused by fungal toxins, mainly due to contamination of animal feed with mycotoxins. |
| Mycotoxins | Mycotoxins are toxin compounds that are naturally produced by certain types of molds (fungi). |
| Feed Probiotics | Microbial feed supplements positively affect gastrointestinal microbial balance. |
| Probiotic yeast | Feed yeast (single-cell fungi) and other fungi used as probiotics. |
| Feed enzymes | They are used to supplement digestive enzymes in an animal’s stomach to break down food. Enzymes also ensure that meat and egg production is improved. |
| Mycotoxin detoxifiers | They are used to prevent fungal growth and to stop any harmful mold from being absorbed in the gut and blood. |
| Feed antibiotics | They are used both for the prevention and treatment of diseases but also for rapid growth and development. |
| Feed antioxidants | They are used to protect the deterioration of other feed nutrients in the feed such as fats, vitamins, pigments, and flavoring agents, thus providing nutrient security to the animals. |
| Feed phytogenics | Phytogenics are natural substances, added to livestock feed to promote growth, aid in digestion, and act as anti-microbial agents. |
| Feed vitamins | They are used to maintain the normal physiological function and normal growth and development of animals. |
| Feed flavors and sweetners | These flavors and sweeteners help to mask tastes and odors during changes in additives or medications and make them ideal for animal diets undergoing transition. |
| Feed acidifiers | Animal feed acidifiers are organic acids incorporated into the feed for nutritional or preservative purposes. Acidifiers enhance congestion and microbiological balance in the alimentary and digestive tracts of livestock. |
| Feed minerals | Feed minerals play an important role in the regular dietary requirements of animal feed. |
| Feed binders | Feed binders are the binding agents used in the manufacture of safe animal feed products. It enhances the taste of food and prolongs the storage period of the feed. |
| Key Terms | Abbreviation |
| LSDV | Lumpy Skin Disease Virus |
| ASF | African Swine Fever |
| GPA | Growth Promoter Antibiotics |
| NSP | Non-Starch Polysaccharides |
| PUFA | Polyunsaturated Fatty Acid |
| Afs | Aflatoxins |
| AGP | Antibiotic Growth Promoters |
| FAO | The Food And Agriculture Organization of the United Nations |
| USDA | The United States Department of Agriculture |
Need More Details on Market Definition?
Ask a Question
Research Methodology
Mordor Intelligence follows a four-step methodology in all our reports.
- Step-1: IDENTIFY KEY VARIABLES: In order to build a robust forecasting methodology, the variables and factors identified in Step-1 are tested against available historical market numbers. Through an iterative process, the variables required for market forecast are set and the model is built on the basis of these variables.
- Step-2: Build a Market Model: Market-size estimations for the forecast years are in nominal terms. Inflation is not a part of the pricing, and the average selling price (ASP) is kept constant throughout the forecast period.
- Step-3: Validate and Finalize: In this important step, all market numbers, variables and analyst calls are validated through an extensive network of primary research experts from the market studied. The respondents are selected across levels and functions to generate a holistic picture of the market studied.
- Step-4: Research Outputs: Syndicated Reports, Custom Consulting Assignments, Databases & Subscription Platforms

Get More Details On Research Methodology
Download PDF


