
Market Overview
| Study Period | 2020 - 2031 |
|---|---|
| Forecast Data Period | 2026 - 2031 |
| Base Year Market Size (2025) | USD 297.59 Million |
| Market Size (2026) | USD 308.30 Million |
| Market Size (2031) | USD 367.92 Million |
| Growth Rate (2026 - 2031) | 3.60 % |
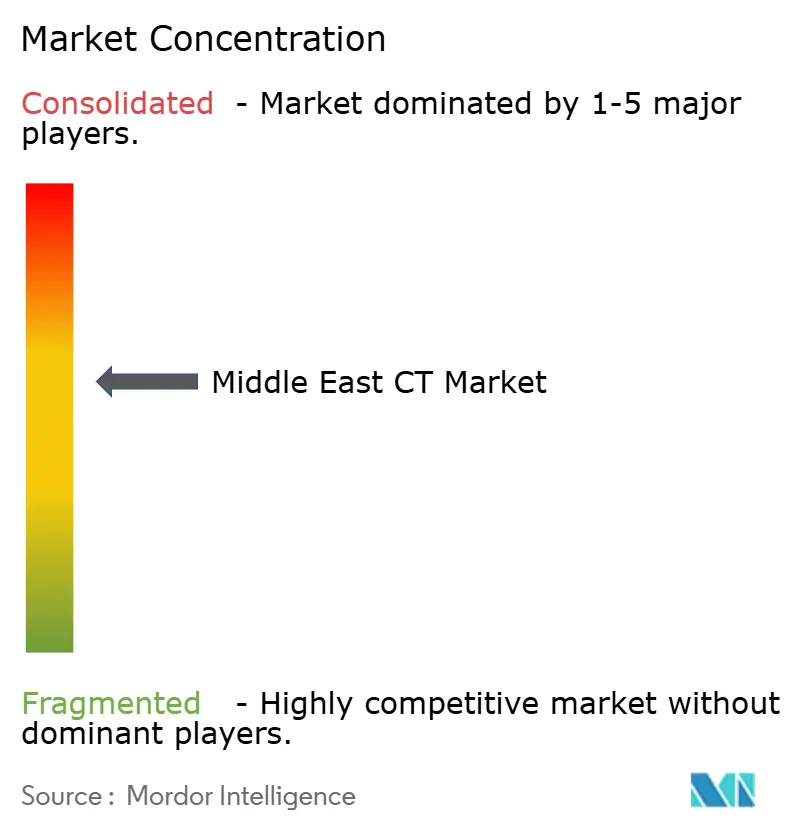
| Market Concentration | Medium |
Major Players
*Disclaimer: Major Players sorted in no particular order Image © Mordor Intelligence. Reuse requires attribution under CC BY 4.0. |
|
Middle East CT Market Analysis by Mordor Intelligence
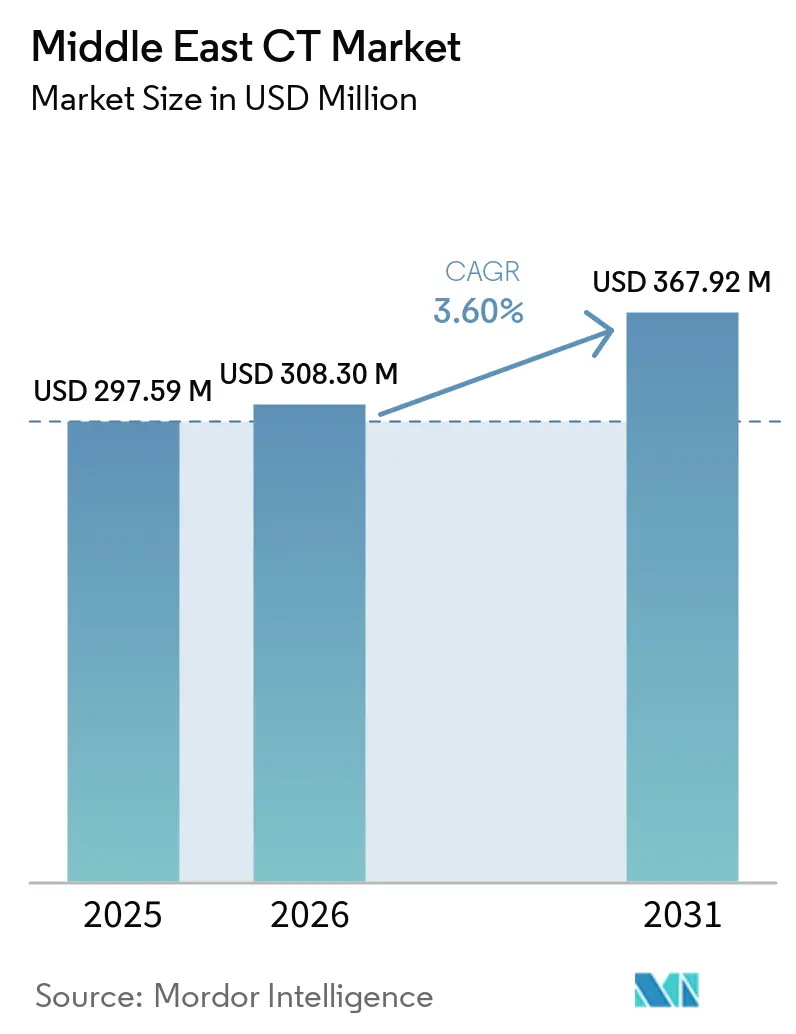
Middle East CT Market size in 2026 is estimated at USD 308.3 million, growing from 2025 value of USD 297.59 million with 2031 projections showing USD 367.92 million, growing at 3.60% CAGR over 2026-2031.
Rising chronic disease incidence, large-scale infrastructure programs under Saudi Arabia’s and the UAE’s national visions, and steady medical tourism inflows are the primary demand catalysts. Vendor strategies focus on mid-range 64-slice platforms that strike a balance between cost and image quality, while dual-energy and photon-counting upgrades enhance clinical outcomes and reduce radiation exposure. Stationary scanners remain the workhorses of hospital imaging suites, yet mobile CT growth outpaces the total market as defense, emergency medicine, and disaster response agencies pursue point-of-care diagnostics. AI-ready workflow tools, low-dose protocols, and equipment-as-a-service financing models are shaping competitive differentiation. Supply-chain resilience and workforce development remain key watch items for market participants, as radiologist shortages and global contrast-media disruptions test operational agility.
Key Report Takeaways
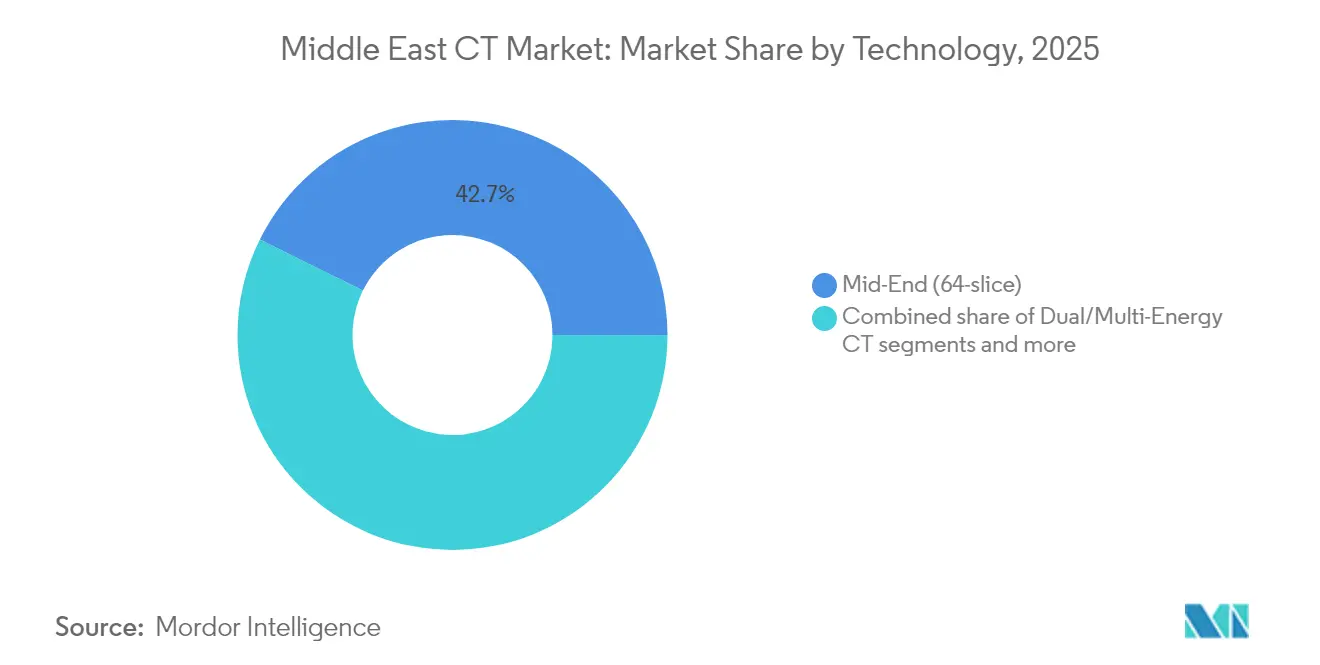
- By 2025, mid-end 64-slice systems led the Middle East computed tomography market with a 42.68% share, while dual/multi-energy CT is projected to advance at a 6.19% CAGR through 2031.
- By device architecture, stationary scanners commanded 91.20% share of the Middle East computed tomography market size in 2025, whereas portable CT is set to expand at 6.78% CAGR over 2026-2031.
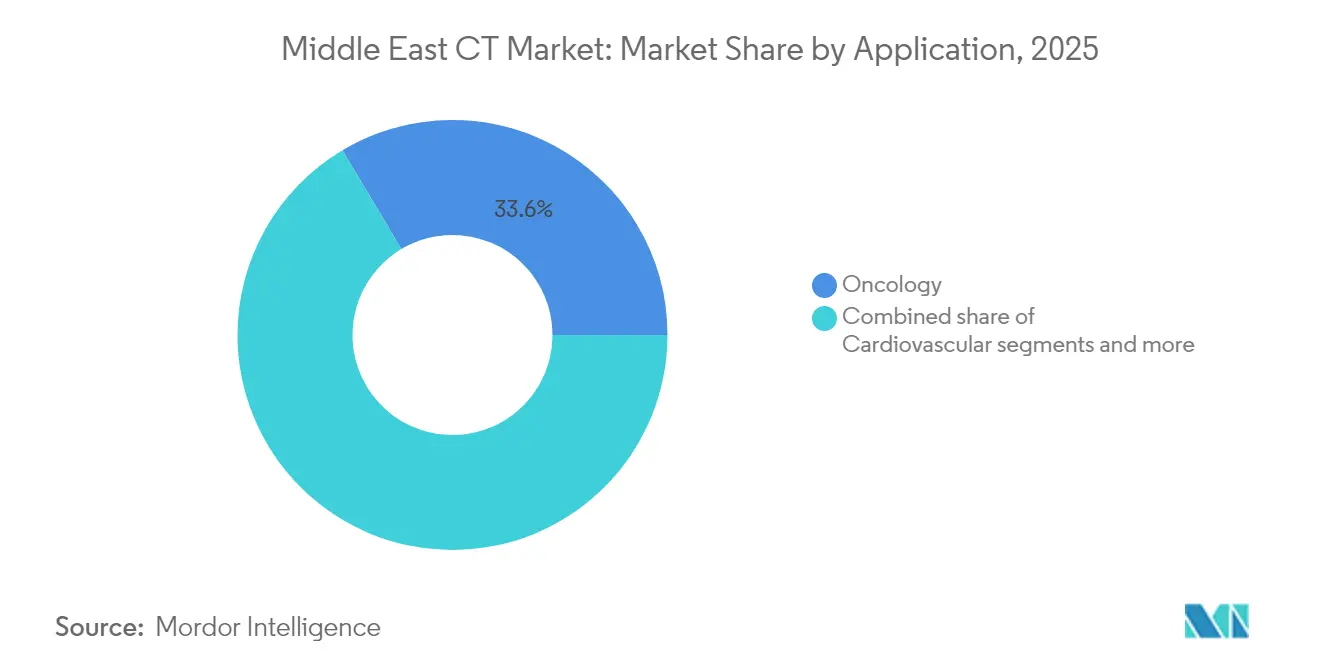
- By application, oncology accounted for 33.55% of the Middle East computed tomography market size in 2025; cardiovascular imaging is poised for the quickest growth at 6.52% CAGR to 2031.
- By end-user, hospitals dominated the market with a 71.62% revenue share in 2025; diagnostic imaging centers are forecast to grow at a 6.18% CAGR through 2031.
Note: Market size and forecast figures in this report are generated using Mordor Intelligence’s proprietary estimation framework, updated with the latest available data and insights as of 2026.
Market Trends and Insights
Drivers Impact Analysis of Middle East CT Market*
| Driver | (~) % Impact on CAGR Forecast | Geographic Relevance | Impact Timeline |
|---|---|---|---|
| Rising chronic-disease burden demanding advanced imaging | +1.2% | Global, with highest impact in UAE, Saudi Arabia, Egypt | Medium term (2-4 years) |
| GCC infrastructure investments under Vision 2030 programmes | +0.8% | Saudi Arabia, UAE, Qatar | Short term (≤ 2 years) |
| Rapid technology upgrades (low-dose, spectral, AI-ready CT) | +0.6% | Gulf states leading, gradual adoption across Africa | Medium term (2-4 years) |
| Adoption of AI-enabled diagnostic workflows | +0.5% | UAE, Saudi Arabia, South Africa | Long term (≥ 4 years) |
| Medical-tourism boom boosting high-end imaging demand | +0.4% | UAE, Turkey, Saudi Arabia | Short term (≤ 2 years) |
| Defence & emergency medicine programmes driving mobile CT procurement | +0.3% | Regional, with focus on conflict-prone areas | Medium term (2-4 years) |
| Source: Mordor Intelligence | |||
Rising Chronic-Disease Burden Demanding Advanced Imaging
Cancer incidence in the WHO Eastern Mediterranean Region is projected to double by 2040, and cardiovascular disease already accounts for 40% of deaths in the UAE. These epidemiological trends underpin sustained CT demand as health systems scale early-detection programs. The population aged 65+ across MENA is expected to rise from 28 million in 2018 to 92 million in 2050. Late-stage presentations and rural access gaps amplify the requirement for higher-resolution scanners capable of precise staging and treatment planning. Refugee inflows into Jordan further strain centralized diagnostic hubs, reinforcing the need for expanded regional imaging capacity.
GCC Infrastructure Investments Under Vision 2030 Programmes
Saudi Arabia has allocated USD 66 billion for healthcare modernization by 2030, with private-sector participation targeted to increase from 40% to 65%. Twenty-one planned “health clusters,” each serving about 1 million residents, are generating systematic procurement cycles for CT equipment. The UAE mirrors this pattern through dedicated medical-tourism initiatives, underpinned by ongoing capital expenditure in acute-care hospitals and outpatient imaging centers. Such government-backed projects favor vendors offering turnkey installation, local service staff and AI-ready detectors.
Rapid Technology Upgrades (Low-Dose, Spectral, AI-Ready CT)
Philips introduced the Spectral CT 7500 at Arab Health 2025, citing a 34% shorter time-to-diagnosis versus conventional systems . Ultra-low-dose spectral protocols deliver 91.2% dose reduction in lung-cancer screening while maintaining diagnostic quality. Photon-counting detectors promise 25-50% contrast-media savings for abdominal scans, and GE HealthCare’s acquisition of Prismatic Sensors accelerates commercialization timelines.
Adoption of AI-Enabled Diagnostic Workflows
A survey of 549 Middle East radiographers shows 86% believe AI is critical to future radiology, yet only 12.2% feel comfortable operating AI tools SPRINGEROPEN.COM. Primary barriers include skill gaps and budgeting for integration, although dose-monitoring and automated image-quality checks rank as top-priority applications. Facilities with formal AI roadmaps remain below 30%, suggesting partnership opportunities for vendors offering training and cloud-based analytics.
Restraints Impact Analysis of Middle East CT Market*
| Restraint | (~) % Impact on CAGR Forecast | Geographic Relevance | Impact Timeline |
|---|---|---|---|
| High capital & lifecycle costs of CT systems | -0.9% | Africa primarily, secondary impact in emerging GCC markets | Short term (≤ 2 years) |
| Shortage of trained radiologists / technologists | -0.7% | Regional, most acute in Sub-Saharan Africa | Long term (≥ 4 years) |
| Import-supply risks amid geo-political disruptions | -0.5% | Global, with highest impact in import-dependent African markets | Medium term (2-4 years) |
| Growing public radiation-safety concerns amplified on social media | -0.3% | Regional, particularly in educated urban populations | Medium term (2-4 years) |
| Source: Mordor Intelligence | |||
High Capital & Lifecycle Costs of CT Systems
High-end CT scanners range from USD 500,000 to USD 2 million, a hurdle for hospitals reliant on constrained public budgets. Lifecycle expenses—annual service contracts, tube replacements, and facility retrofits—compound total ownership costs. The utilization rates exceed safe thresholds because sites lack funds for additional capacity. Equipment-as-a-service offerings now allow pay-per-scan arrangements that shift spending from CapEx to OpEx, while refurbished units cut purchase prices by up to 70% and improve supply-chain sustainability by 32% energy savings.
Shortage of Trained Radiologists / Technologists
WHO estimates show fewer than 23 radiologists per million population across much of developing nations, versus over 100 per million in high-income countries. Saudi Arabia reports a deficit of roughly 1,000 radiologists, creating workflow bottlenecks despite adequate equipment capacity. Teleradiology networks and vendor-led up-skilling programs are mitigating wait times, yet long-term human-capital solutions remain essential as scan volumes rise.
*Our forecasts treat driver/restraint impacts as directional, not additive. The impact forecasts reflect baseline growth, mix effects, and variable interactions.
Middle East CT Market Segment Analysis
By Technology (Slice Count):
Mid-Range Systems Drive UtilizationMid-end 64-slice configurations captured 42.68% of the Middle East computed tomography market share in 2025. Hospitals and diagnostic centers choose these platforms because they cover routine oncology, trauma, and cardiac work-ups without the price premium of 128- or 256-slice scanners. The Middle East computed tomography market size for dual- or multi-energy CT is projected to grow at a 6.19% CAGR between 2026 and 2031, reflecting the clinical value of single-scan spectral protocols. Photon-counting prototypes preview the next upgrade cycle and are expected to reach commercial volumes post-2027 as reimbursement pathways mature.
Demand patterns diverge across income tiers. Lower-slice (< 64) units dominate primary clinics in developing nations, often secured via donor funding and refurbished import channels. Conversely, Gulf tertiary centers favor systems with 128-slice capabilities or higher for coronary CT angiography and whole-body trauma imaging; vendors bundle AI-enabled reconstruction and dose monitoring to satisfy regulatory dose index limits. Over the forecast period, software upgrades—rather than hardware replacement—will generate an increasing share of segment revenue as providers unlock latent detector performance.

By Device Architecture:
Stationary Systems Remain Core While Mobile Gains TractionStationary installations represented 91.20% of total revenues in 2025. Integrated RIS/PACS workflows, high throughput, and full-body imaging capability secure their position as the backbone of acute-care diagnostics. Service contracts and tube-exchange cycles underpin predictable aftermarket revenue for OEMs. The Middle East computed tomography market size for portable scanners is advancing ata 6.78% CAGR on the back of defense deployments, ambulance-based stroke units, and rural outreach initiatives.
Mobile configurations priced between USD 95,000 and USD 730,000 allow multi-site utilization, maximizing uptime in resource-limited settings. In the Gulf, field hospitals and medical teams for sporting events adopt lightweight, wheeled platforms that plug into existing power infrastructure. OEM differentiation now hinges on battery runtime, image stabilization and tele-radiology integration.
By Application:
Oncology Dominance Meets Rapid Cardiac UptakeOncology generated 33.55% of 2025 revenues as rising incidence, coupled with expanded screening initiatives, sustains scan growth. Ultra-low-dose lung-cancer protocols slash radiation by 91.2% without sacrificing lesion detectability. Breast cancer staging via chest CT is also scaling amid increased awareness campaigns. Cardiovascular imaging shows the highest upside, with segment revenue forecast to climb at a 6.52% CAGR. Guideline updates position coronary CT angiography as a first-line test for suspected coronary artery disease, accelerating the installation of 256-slice detectors.
Neurological and trauma indications experience stable volumes as road-traffic accidents and stroke prevalence remain high. Musculoskeletal and dental imaging flourish in private clinics, whereas veterinary CT emerges as a niche but high-margin segment. AI-driven calcium-scoring, plaque analysis, and bone-density applications further expand use cases and support incremental software licensing revenue.
By End-User:
Hospitals Anchor Demand as Diagnostic Centers ScaleHospitals contributed 71.62% of 2025 revenue thanks to broad case-mix coverage, government funding and integrated emergency departments. Public mega-projects such as Saudi Arabia’s 21-cluster rollout deploy multi-modality suites that lock in long-term service agreements. Private hospital groups, particularly in the UAE, leverage premium imaging to attract medical tourists and insured expatriates.
Diagnostic imaging centers are growing at 6.18% CAGR as health systems decentralize non-acute services. Chains offer shorter wait times and package pricing, drawing elective CT referrals away from hospitals. Equipment-as-a-service deals reduce up-front spending, enabling rapid network expansion. Academic institutes drive protocol research and AI validation, while dental and veterinary clinics adopt compact cone-beam and extremity-specific units to diversify revenue streams.
Geography Analysis
GCC CT Market
GCC members lead market value owing to Vision-aligned megaprojects and stable reimbursement frameworks. Saudi Arabia’s USD 66 billion healthcare allocation under Vision 2030 establishes predictable tender volumes across upcoming health clusters. The UAE’s strong medical-tourism inflows and government healthcare spending underpin a robust installed base that increasingly favors dual-energy and AI-driven upgrades. Qatar, Kuwait, and Bahrain pursue similar modernization trajectories, albeit on smaller budgets, often negotiating multi-vendor service frameworks to secure pricing leverage.
Turkey and Egypt CT Market
Turkey acts as a regional hub for cross-border patients from the Middle East. Large private hospital groups install wide-coverage CT platforms to differentiate transplant, oncology, and orthopedics programs. Egypt’s February 2025 introduction of Siemens Healthineers’ Biograph Trinion PET/CT marks a significant shift toward hybrid imaging adoption in the region.
Broader Middle East CT Market
The Middle East computed tomography market has demonstrated impressive growth over the forecast period of 2026-2031, registering a 6.8% CAGR. Multiple factors, including significant improvements in healthcare infrastructure across major economies, have supported this growth trajectory. The market has benefited from increasing adoption of advanced diagnostic imaging technologies in both public and private healthcare sectors. Regional governments' focus on healthcare sector development has played a crucial role in market expansion through increased healthcare spending and modernization initiatives. The period has witnessed substantial investments in medical imaging capabilities, particularly in major medical centers and specialized diagnostic facilities. The growing awareness of early disease detection and diagnosis has further contributed to market growth. The expansion of private healthcare facilities and diagnostic centers has created additional demand for CT systems. Moreover, the increasing burden of lifestyle-related diseases and cancer has necessitated greater access to advanced imaging technologies across the region.
Middle East Forecast CT Market
Looking ahead, the Middle East computed tomography market is projected to maintain strong growth momentum, with an expected CAGR of approximately 3.6% during the forecast period 2026-2031. The market's future growth trajectory will be shaped by continuing healthcare infrastructure development and increasing adoption of advanced medical imaging technologies. Rising investments in healthcare digitalization and the integration of artificial intelligence in imaging systems are expected to drive market expansion. The growing focus on preventive healthcare and early disease detection is likely to boost demand for CT scanning services. Healthcare providers' increasing emphasis on improving diagnostic capabilities and patient care quality will continue to drive the adoption of technology. The market is also expected to benefit from the expansion of medical tourism activities in key regional markets. Additionally, the increasing prevalence of chronic diseases and a growing aging population will sustain demand for advanced imaging solutions. Technological advancements in CT systems, offering improved image quality and reduced radiation exposure, are expected to drive replacement demand in established healthcare facilities.
Regulatory Landscape
CT systems are regulated as medical devices through country-specific authorities and pre-market controls, which affect import timelines, installation readiness, and post-market obligations. In the UAE, the Emirates Drug Establishment (EDE) was established as the federal regulator for medical devices (September 2023) and assumed full authority for medical device marketing authorizations in December 2025 under Federal Decree-Law No. 38 of 2024, adding a centralized pathway that requires establishment registration followed by product registration for marketing authorization holders.
Saudi Arabia operates under the Law of Medical Devices and Supplies (Royal Decree No. M/54, 2021), with the Saudi Food and Drug Authority (SFDA) requiring device registration and a Marketing Authorization (MDMA) prior to distribution, alongside licensing for establishments engaged in medical device activities. In Bahrain, medical device registration is routed via the National Health Regulatory Authority (NHRA) under Ministerial Resolution No. (48) of 2020, while Egypt and Oman maintain import approval and manufacturer registration requirements through the Egyptian Drug Authority (EDA) and Oman Ministry of Health, respectively. Across these markets, OEMs and distributors need documented quality systems (commonly aligned to ISO 13485) and defined post-market processes to support multi-country deployments.
Value Chain Analysis
The Middle East CT value chain is import-led, anchored by global OEMs (Siemens Healthineers, GE HealthCare, Philips, Canon Medical, and others) that supply stationary and mobile CT hardware, detectors, and accessories. Monetization then follows through installation services, applications training, service contracts, and software upgrades, including AI reconstruction, dose monitoring, and workflow tools. Procurement flows are shaped by government tenders and hospital group buying, while distributors and systems integrators provide in-country registration support, site planning, and first-line service where OEM direct coverage is limited.
Downstream, specialized logistics and inventory platforms increasingly support distribution out of UAE free zones and hubs such as Dubai Investments Park and Dubai Science Park. This setup supports regional warehousing, spare-parts positioning, and controlled transport. Provider-side outsourcing is also becoming more visible: in May 2026, M42 contracted Global Medical Supply Chain (GMSC) to manage an integrated supply chain model covering sourcing, procurement, demand planning, warehousing, and distribution for its healthcare network. In June 2026, AKI Logistics signed a three-year agreement with NMC Group Services to run end-to-end logistics from a dedicated Dubai Investments Park facility. Local manufacturing for clinical CT remains limited, but adjacent capabilities exist, including Iran-based Behin Negareh producing micro-CT for industrial and pre-clinical use. Turkey-based representatives (for example, MEC) also support regional access to imaging portfolios and service coverage.
Competitive Landscape
Global OEMs dominate the Middle East computed tomography market through diverse portfolios and embedded service networks. Siemens Healthineers posted EUR 22.4 billion in revenue in fiscal 2024 and continues to seed emerging markets with photon-counting roadmaps and AI workflow modules. GE HealthCare leverages local joint ventures, exemplified by its 2024 Saudi digital-transformation pact, to bundle hardware and cloud analytics. Philips focuses on spectral CT and dose-optimization suites launched at Arab Health 2025.
Chinese manufacturers are expanding regional footprints. United Imaging operates a Dubai headquarters and has secured cardiac CT deals across Saudi Arabia, Qatar, and Morocco. Canon Medical opened a Dubai division in 2024 to reinforce direct sales and service coverage. These entrants compete on the basis of price-performance ratios and flexible financing.
Service-centric differentiation grows in relevance. OEM-backed AI marketplaces, uptime guarantees and in-country training academies appeal to health ministries aiming to future-proof investments. Mobile CT niche players—Micro-X, MinFound and Neusoft—pursue defense and humanitarian contracts, often partnering with logistic specialists for rapid deployment. Overall, consolidation remains moderate: the top five players account for roughly 60-65% of regional revenue, leaving room for challenger brands and systems integrators to carve specialized segments.
Middle East CT Industry Leaders
-
Canon Medical Systems Corporation
-
GE Healthcare
-
Hitachi Healthcare Systems
-
Koninklijke Philips NV
-
Siemens Healthineers
- *Disclaimer: Major Players sorted in no particular order
Middle East CT Market Companies Covered in this Report
- Accuray
- Canon
- Carestream Health
- FUJIFILM
- GE Healthcare
- Hitachi (Fujifilm)
- Mobile Scanners Gulf
- Neusoft
- Koninklijke Philips
- Planmeca
- PointNix
- Samsung (NeuroLogica)
- Shenzhen Anke High-Tech
- Shimadzu
- Siemens Healthineers
- United Imaging Healthcare
- Vatech Co.
- Xoran Technologies
Market Opportunities and Future Outlook
Quality and safety standardization is creating upgrade and software opportunities across CT fleets, particularly around dose governance and protocol optimization. In April 2026, Emirates Health Services published a multicenter dose survey establishing local Diagnostic Reference Levels (DRLs) for adult CT in UAE hospitals, reinforcing demand for dose-management tools, low-dose reconstruction software, and protocol consulting that can be applied as upgrades on mid-range 64-slice systems as well as on high-end spectral and photon-counting platforms.
Health-system restructuring and localization programs are widening routes to market beyond traditional capital procurement. This is favoring vendors that can package equipment, uptime guarantees, and training into multi-year agreements while building local service capability. Saudi Arabia is advancing Health Sector Transformation initiatives that increase private sector participation and activate PPP-style models for radiology capacity, while the UAE is running Operation 300bn with medical devices and equipment identified as a priority sector for industrial growth. That structure supports joint-venture assembly, local warehousing, and in-country service academies. With AI adoption constrained by skills and integration budgets, near-term whitespace also sits in vendor-led enablement, including workflow integration, cloud-based analytics, and operator upskilling, which helps facilities deploy AI-ready CT features without full hardware replacement.
Recent Industry Developments in Middle East CT Market
- June 2026: AKI Logistics signed a three-year agreement with NMC Group Services Ltd to manage end-to-end logistics, including medical equipment, from a dedicated facility in Dubai Investments Park. The move tightens control over warehousing, distribution, and service-part flows for a major private provider network, reducing downtime risk for installed imaging assets such as CT systems.
- February 2025: Dubai Health Authority partnered with Siemens Healthineers to use the Syngo.Carbon platform to integrate radiology image exchange across the NABIDH network. Broader image exchange increases interoperability requirements at the modality and PACS layers, strengthening demand for CT systems and upgrades that integrate cleanly with regional health information exchanges.
- March 2024: GE HealthCare Arabia strengthened collaboration with Cloud Solutions in Saudi Arabia focused on digital transformation and radiology workflow optimization aligned with Vision 2030. The initiative reinforced the shift from standalone scanner sales toward bundled digital workflow, integration, and service-led models that influence CT procurement decisions by large health systems.
Middle East CT Market Report Scope and Research Methodology
Market Definition and Coverage
For this study, the Middle East CT market covers revenue generated from computed tomography systems and related installations sold into healthcare providers across the Middle East, captured in current USD for the stated year.
Scope exclusions: We exclude MRI, ultrasound, X-ray (non-CT), and PET systems. We also exclude refurbished gray-market units where values are not consistently reportable.
Segments Covered in This Report
-
By Technology (Slice Count)
- Low-slice (<64)
- Mid-slice (64)
- High-slice (128–256)
-
By Product Type
- Stationary CT Scanners
- Portable / Mobile CT Scanners
-
By Application
- Oncology
- Cardiology
- Neurology
- Vascular
- Musculoskeletal
- Dental & Maxillofacial
- Trauma & Emergency
- Other Applications
-
By End-User
- Hospitals
- Diagnostic Imaging Centers
- Dental Clinics
- Academic & Research Institutes
-
By Device Architecture
- Spiral / Helical CT
- Ring-Gantry CT
- C-arm CT
- O-arm CT
-
By Geography
- Saudi Arabia
- United Arab Emirates
- Egypt
- Iran
- Rest of Middle East
Data Sources, Market Sizing, and Validation
Desk Research
Desk research was used to build a clean regional demand picture before sizing. We reviewed public health system updates and procurement signals, plus disease and utilization indicators that point to where CT capacity is being added and upgraded.
Key reference inputs came from non-paywalled sources such as World Health Organization health statistics, World Bank population and health spending series, International Atomic Energy Agency radiology and safety publications, national health ministry releases for large Middle East markets, and selected peer-reviewed radiology journals for procedure and technology trends. We also used company annual reports, investor presentations, and credible press coverage for product refresh timelines, then cross-checked tender activity using a paid global contracts and tenders subscription where available. These examples are illustrative rather than exhaustive, and other public sources were also consulted for collection, validation, and clarification.
Primary Interviews and Surveys
Primary work focused on converting desk inputs into workable assumptions that match how CT systems are bought and used across the region. We spoke with a mix of hospital imaging heads, radiology managers, distributors, and service partners to validate replacement cycles, procurement timing, and price realization, then aligned those inputs with what was seen in public tender notices and budgeting patterns.
Distribution of primary research fieldwork respondents
| Company type | Respondent position |
|---|---|
| Top tier: 26% | CXOs: 12% |
| Mid tier: 59% | Functional/Unit leaders: 40% |
| Smaller Players: 15% | Managers: 48% |
Market-Sizing & Forecasting
Sizing starts with a top-down build where healthcare capacity and imaging activity are reconstructed by country using population, diagnostic imaging utilization, and public and private investment direction, then filtered to CT share. To keep the total realistic, we corroborate outputs with selective bottom-up checks, such as sampled average selling prices by slice class multiplied by likely annual unit placements, followed by channel checks with installers and service partners.
A few inputs drive most of the work in the model, so we track them closely: installed base aging and replacement timing, mix shift toward higher-slice systems, average selling price movement with service and software bundles, public tender cadence, and the split of demand between hospitals and imaging centers. When unit visibility is weaker for smaller markets, assumptions are constrained using proxy indicators such as bed additions, imaging center openings, and budget announcements, before being reconciled back to regional totals.
Forecasts are developed using scenario analysis around capital spending cycles and technology upgrades. The final path is selected after expert consensus checks on near-term procurement timing and pricing direction. This keeps the forecast explainable and repeatable, while still reflecting actual buying behavior in the Middle East.
Data Validation & Update Cycle
Outputs are validated through multiple checks so outliers do not silently flow into the final numbers. We compare modeled revenue against independent signals such as tender values, expected unit placement ranges, and country-level healthcare investment direction, then re-open assumptions when variances do not reconcile.
Before sign-off, the work is reviewed in steps, starting with logic checks on units, pricing, and mix, followed by a second analyst review focused on trend consistency across years. Reports refresh annually, and interim updates are triggered when material events occur, including policy shifts, major procurement programs, or sharp currency moves. Right before delivery, a final pass is completed so clients receive the most current view available.
Mordor Intelligence's Middle East Ct Market Size Versus Other Published Estimates
Published market sizes for Middle East CT often differ because each publisher uses a different geographic basket, equipment scope, and timing for currency conversion. Variation also shows up when one estimate is built from installed base thinking, while another relies more on shipment momentum or a narrow technology subset.
In the table, one gap comes from combining Africa with the Middle East, and another comes from counting only dual and multi-energy CT systems. The sizing here keeps Middle East-only coverage and counts full CT system demand (not just a technology subset), after checking unit placement and pricing signals from tenders and interviews, which is how the total is kept grounded by Mordor Intelligence.
Benchmark comparison
| Source | Market Size | Gaps in Research Methodology |
|---|---|---|
| Mordor Intelligence | USD 0.30 B (2025) | |
| Regional Consultancy A | USD 0.61 B (2025) | Uses a Middle East and Africa (MEA) geography, so the total expands beyond the Middle East-only country set, which lifts the stated value even if CT definitions are similar. |
| Global Consultancy B | USD 0.45 B (2024) | Focused on dual and multi-energy CT only, and the base year differs, so the figure reflects a narrower technology subset and a different timing for pricing and currency assumptions. |
Taken together, the spread is mainly explained by geography and scope choices, followed by year selection and how price progression is handled. By keeping the market tied to observable procurement and mix signals, the resulting value stays traceable to a few clear inputs that can be reviewed and updated.
Key Questions Answered in the Report
How large is the Middle East computed tomography market in 2026?
It stands at USD 308.3 million, with steady public- and private-sector demand.
What is the forecast CAGR through 2031?
The market is projected to grow at 3.60% annually, reaching USD 367.92 million.
Which technology tier holds the biggest share?
Mid-range 64-slice systems capture 42.68% of 2025 revenue.
Why is cardiovascular CT the fastest-growing application?
Guideline shifts endorsing coronary CT angiography and AI-assisted plaque analysis support a 6.52% CAGR.
What hampers wider CT adoption?
High capital costs and a chronic shortage of radiologists limit utilization outside major metros.
Who are the dominant manufacturers?
Siemens Healthineers, GE HealthCare and Philips lead, while United Imaging and Canon Medical are expanding regionally.