
Market Overview
| Study Period | 2020 - 2031 |
|---|---|
| Forecast Data Period | 2026 - 2031 |
| Base Year Market Size (2025) | USD 93.01 Billion |
| Market Size (2026) | USD 97.87 Billion |
| Market Size (2031) | USD 126.34 Billion |
| Growth Rate (2026 - 2031) | 5.23 % |
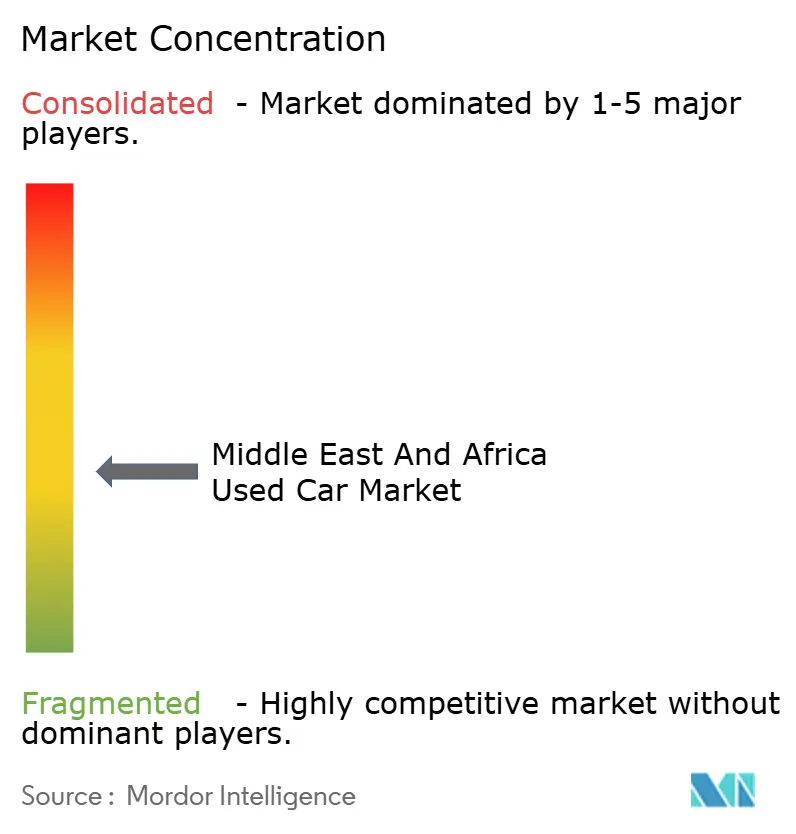
| Market Concentration | Medium |
Major Players *Disclaimer: Major Players sorted in no particular order Image © Mordor Intelligence. Reuse requires attribution under CC BY 4.0. | |
Middle East And Africa Used Car Market Analysis by Mordor Intelligence
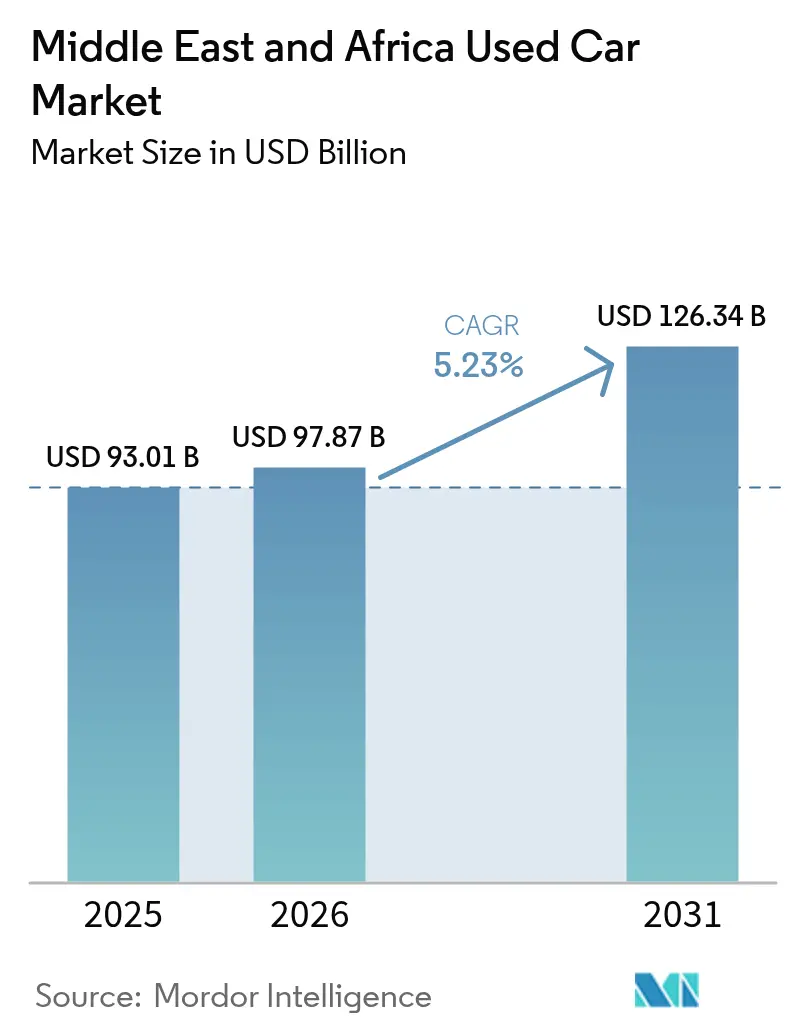
The Middle East and Africa used car market size was valued at USD 93.01 billion in 2025 and estimated to grow from USD 97.87 billion in 2026 to reach USD 126.34 billion by 2031, at a CAGR of 5.23% during the forecast period (2026-2031). Market growth is fueled by persistent new-vehicle supply constraints, accelerated digital adoption, and government import-liberalization measures that collectively reshape demand dynamics. Elevated new-car prices following Red Sea shipping disruptions, rapid mobile-internet penetration, and the influx of competitively priced Chinese brands amplify consumer migration toward the Middle East and Africa used car market[1]. Organized vendors gain momentum through certified pre-owned programs, while inspection and history-verification services improve buyer confidence and catalyze formalization. SUVs dominate sales as harsh-terrain adaptability remains paramount, and battery-electric vehicles emerge as the fastest-growing fuel class despite heat-induced battery-degradation concerns.
Key Report Takeaways
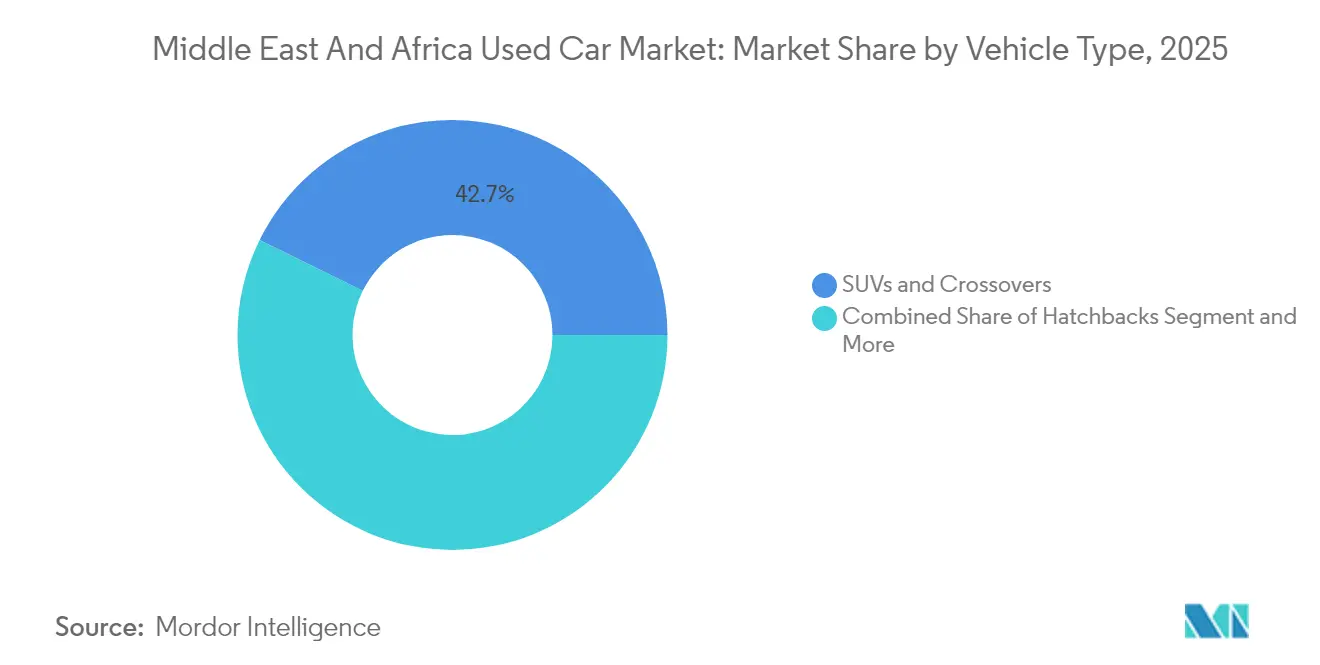
- By vehicle type, SUVs and crossovers led with 42.72% revenue share in 2025; the segment is projected to advance at a 5.55% CAGR through 2031.
- By vendor type, unorganized channels held 61.70% of the Middle East and Africa used car market share in 2025, while organized vendors are growing at a 6.55% CAGR to 2031.
- By fuel type, petrol vehicles captured 78.60% of the Middle East and Africa used car market size in 2025 while battery-electric vehicles are poised to expand at a 9.92% CAGR through 2031.
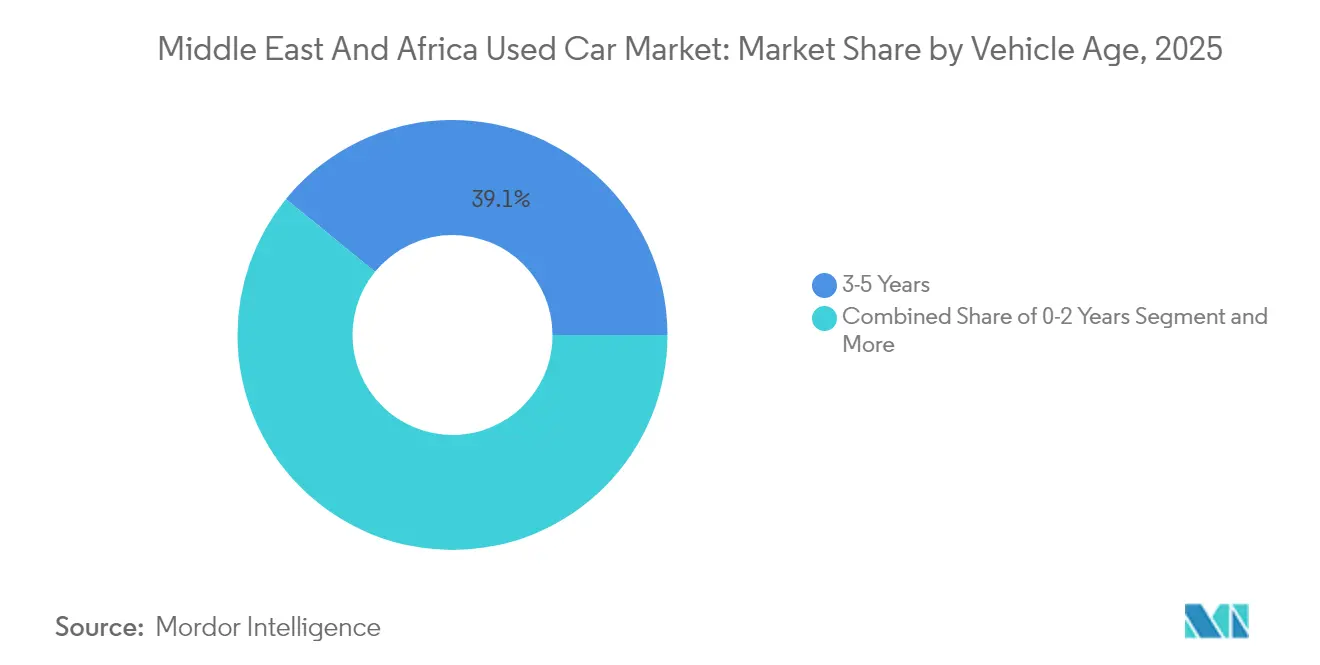
- By vehicle age, the 3-5 year category accounted for 39.10% share of the Middle East and Africa used car market size in 2025 and 0-2 year category is rising at a 7.45% CAGR through 2031.
- By distribution channel, online classified and e-commerce platforms commanded 73.60% share of the Middle East and Africa used car market size in 2025 and continue to grow at a 6.05% CAGR through 2031.
- By country, Saudi Arabia held 34.20% of the Middle East and Africa used car market share in 2025, whereas the United Arab Emirates posts the highest 6.82% CAGR to 2031.
Note: Market size and forecast figures in this report are generated using Mordor Intelligence’s proprietary estimation framework, updated with the latest available data and insights as of 2026.
Market Trends and Insights
Drivers Impact Analysis of Middle East And Africa Used Car Market*
| Driver | (~) % Impact on CAGR Forecast | Geographic Relevance | Impact Timeline |
|---|---|---|---|
| High New-Vehicle Prices, Supply Delays | +1.2% | GCC and North Africa | Short term (≤ 2 years) |
| Influx of Affordable Chinese Brands | +0.9% | Egypt, Ethiopia, GCC | Medium term (2–4 years) |
| Digital Classifieds and O2O Platforms | +0.8% | United Arab Emirates, Saudi Arabia, Egypt | Medium term (2–4 years) |
| SUV and Pickup Preference | +0.6% | Middle East and North Africa | Long term (≥ 4 years) |
| Expansion of Inspection Services | +0.4% | GCC | Medium term (2–4 years) |
| Early Electrified Fleets Supply | +0.3% | Urban GCC and Egypt | Long term (≥ 4 years) |
| Source: Mordor Intelligence | |||
High New-Vehicle Prices and Supply-Chain Delays
Red Sea shipping bottlenecks have extended delivery lead times by up to six weeks, prompting regional distributors to raise new-car prices during 2024 and pushing budget-sensitive buyers into the Middle East and Africa used car market. Affordability gaps intensify demand for 2–3-year-old vehicles, while corporate fleets shorten replacement cycles to lock in residual values ahead of further price inflation. Dealer inventories of popular models remain tight for four to six months, compelling consumers to consider used options previously out of scope. Leasing companies capitalize by remarketing low-mileage returns, creating a steady pipeline of nearly-new stock. Collectively, these factors elevate transaction volumes and sustain premium resale values across high-demand nameplates.
Influx of Affordable Chinese Brands Boosts Turnover
Aggressive expansion by BYD, Geely, and Chery delivers attractively priced alternatives often below legacy competitors, stoking new-vehicle uptake that swiftly filters into secondary channels. Local assembly joint ventures shorten supply cycles and raise model familiarity among service workshops, lowering perceived ownership risk. Fleet operators embrace Chinese sedans and SUVs to contain capital outlays, thereby feeding a pipeline of 2–4-year returns. Competitive feature sets—such as panoramic cameras and advanced infotainment—heighten appeal to tech-savvy buyers. Consequently, turnover accelerates, deepening inventory across price tiers within the Middle East and Africa used car market.
Digital Classifieds and O2O Platforms Proliferation
Platform consolidation is redefining supply chains as Dubizzle Motors, CarSwitch, and Syarah scale verification and financing solutions that reduce friction and widen the buyer pool. Data-driven pricing algorithms equalize information asymmetry, boosting consumer trust and compressing negotiation spreads. Online-to-offline (O2O) fulfillment unlocks cross-border sourcing that broadens inventory diversity, while mobile-first interfaces resonate with digital-native demographics. Strategic funding rounds, such as Syarah’s USD 60 million Series C, bankroll regional expansion and technology upgrades. Traditional dealers, recognizing foot-traffic erosion, fast-track digital storefronts and hybrid models to retain relevance and capture incremental share within the Middle East and Africa used car market.
SUV and Pickup Preference for Harsh Terrain
Desert environments shape purchasing behavior as consumers prioritize vehicles offering superior cooling, elevated ride height, and sand-resistant components. Certified Toyota Land Cruiser and Nissan Patrol models attract 15–20% premiums over sedan counterparts due to proven durability [2]. Commercial operators in construction, oil services, and tourism sectors extend demand beyond private-use contexts. Aftermarket upfitters specialize in grille guards, ceramic coatings, and reinforced suspensions that bolster resale values. Chinese OEMs capitalize by releasing lower-priced SUVs equipped with region-specific thermal management systems. The enduring preference fortifies segment leadership in the Middle East and Africa used car market.
Restraints Impact Analysis of Middle East And Africa Used Car Market*
| Restraint | (~) % Impact on CAGR Forecast | Geographic Relevance | Impact Timeline |
|---|---|---|---|
| Dominance of Unorganized Vendors | −0.8% | Sub-Saharan and North Africa | Long term (≥ 4 years) |
| Restrictive Cross-Border Regulations | −0.6% | Pan-African corridors and GCC | Short term (≤ 2 years) |
| Odometer Fraud and Limited Transparency | −0.5% | Africa and select Middle East | Medium term (2–4 years) |
| Heat-Induced Battery Degradation | −0.4% | Gulf and North Africa | Long term (≥ 4 years) |
| Source: Mordor Intelligence | |||
Dominance of Unorganized Vendors in Africa
Informal street-level traders retain control over a majority of transactions across key African economies, perpetuating cash-only dealings and opaque pricing that hinder credit penetration. Absence of standardized inspections allows quality variance that suppresses consumer confidence and limits regional export prospects. Regulatory agencies struggle with enforcement owing to limited resources and entrenched familial trading networks. Although digital classifieds gain traction, resistance to registration and taxation slows formalization. Foreign investors remain cautious, citing legal uncertainties that dilute return predictability in the Middle East and Africa used car market.
Restrictive Cross-Border Import Regulations
Several governments maintain tight import‐age caps, environmental standards, and document-authentication rules that slow vehicle inflows and elevate compliance costs. Nigeria’s enforcement of a 12-year age limit in 2025 redirected older inventory toward neighboring states and trimmed regional supply, squeezing price-sensitive buyers and reducing transaction volumes along major corridors. GCC authorities periodically raise inspection fees and require origin certificates that lengthen clearance times, compelling dealers to hold higher working capital and pass the burden to consumers. Fragmented tariff structures across East African Community and Economic Community of West African States members complicate multi-country sourcing strategies, undermining economies of scale for organized retailers. Traders respond by channeling stock through informal border points, but heightened patrols and digital customs systems are raising seizure risks and discouraging gray-market flows.
*Our forecasts treat driver/restraint impacts as directional, not additive. The impact forecasts reflect baseline growth, mix effects, and variable interactions.
Middle East And Africa Used Car Market Segment Analysis
By Vehicle Type:
SUVs Sustain SuperioritySUVs posted 42.72% share of the Middle East and Africa used car market in 2025, outpacing sedans and hatchbacks and expanding at a 5.55% CAGR to 2031. The Middle East and Africa used car market size for SUVs in 2025, reflected entrenched demand for high-ground-clearance designs that withstand desert terrains. Durability advantages translate into slower depreciation, enabling certified pre-owned SUVs to command premiums over equivalent mileage sedans. Emerging Chinese SUV models introduce competitive price tiers, enticing fleet managers to broaden procurement beyond traditional Japanese nameplates.
Growing aftermarket sectors-from ceramic protective coatings to adaptive suspension kits-further elevate perceived value, contributing to higher turnover velocity. Sedans hold a stable share, driven by urban commuters prioritizing fuel economy and compact parking footprints, while hatchbacks remain the entry point for budget-constrained first-time buyers. MPVs cater to large families and niche commercial segments. Nevertheless, SUV dominance is expected to persist as infrastructure expansions in construction, oil, and tourism sectors sustain off-road-capable vehicle requirements across the Middle East and Africa used car market.

By Vendor Type:
Organized Momentum BuildsUnorganized dealers accounted for 61.70% of transactions in 2025, but organized vendors are growing with fastest 6.55% CAGR by 2031, underscoring shifting consumer preferences toward structured warranties and transparent pricing. The Middle East and Africa used car market size recorded significant organized sales during 2025, reflecting rising adoption of certified pre-owned programs. Regulatory reforms in GCC states compel dealers to digitize inventories and provide inspection documentation, reducing asymmetry and increasing lender confidence.
Digital platforms empower organized vendors to syndicate listings across borders, tapping inventory pools previously constrained by geography. Conversely, informal traders face punitive penalties for non-compliance, enhancing the relative attractiveness of formal channels. Momentum is most evident in Saudi Arabia, where removal of the customs-broker requirement trims import processing times, enabling organized players to rotate stock faster. The share shift is expected to accelerate as banks deepen auto-finance penetration, tethering credit approvals to verifiable vehicle data.
By Fuel Type:
Electrification Gains GroundPetrol vehicles dominate the Middle East and Africa used car market with 78.60% share, but battery-electric vehicles register the highest CAGR at 9.92% through 2031. The Middle East and Africa used car market size for electric cars in 2025 was low, yet early fleet dispositions by ride-hailing and logistics firms seed supply channels. Hybrid powertrains serve as transitional options for buyers favoring fuel efficiency without range constraints.
Thermal-management challenges constrain secondary EV uptake, particularly in Gulf states where high ambient temperatures accelerate battery wear. Nonetheless, policy incentives including reduced import duties and free-parking privileges foster incremental demand. Investment in liquid-cooled charging infrastructure and battery-reconditioning start-ups promises to mitigate longevity concerns over the forecast horizon. The enduring predominance of internal-combustion vehicles will gradually erode as technology costs fall and climate-adapted battery chemistries enter OEM portfolios.
By Vehicle Age:
Premium on YouthVehicles aged 3-5 years captured 39.10% share in 2025, positioning this bracket as the volume anchor of the Middle East and Africa used car market. Buyers perceive the category as balancing modern features with palatable capital outlays. Yet the 0-2-year cohort grows fastest at 7.45% CAGR, as supply-chain disruptions nudge consumers toward nearly new alternatives available immediately. The Middle East and Africa used car market share for 0-2-year models climbed in 2025, supported by extended OEM warranties and advanced climate-adaptation technologies.
Older brackets, spanning 6-8 years and above 8 years, maintain relevance among budget-focused segments, especially in Sub-Saharan Africa where purchasing power lags GCC levels. Nigeria’s enforcement of a 12-year import age cap curtails inflows of high-mile vehicles, gradually elevating fleet quality and pressuring informal vendors to source newer stock. Over time, tightening regulatory regimes across Africa are likely to prune the aging tail of the vehicle-age distribution.
By Distribution Channel:
Digital AscendancyOnline Classified and E-commerce controlled 73.60% of the Middle East and Africa used car market in 2025 and sustain a 6.05% CAGR through 2031. Convenience, comprehensive listing data, and integrated financing propel adoption among millennials and Generation Z. Mobile-optimized portals facilitate rapid cross-border sourcing, expanding buyer choice and pressuring offline dealers to match pricing transparency. The Middle East and Africa used car market size transacted through online channels expected to grow further, underpinning platform profitability and attracting continued venture funding.
Offline showrooms retain cultural resonance in select markets where physical inspection and interpersonal negotiation remain embedded norms. Hybrid O2O models flourish, blending digital lead-generation with on-site verification centers that reassure risk-averse buyers. Regulatory bodies increasingly mandate digital record-keeping for tax compliance, inadvertently steering transactions onto traceable platforms. Consequently, brick-and-mortar dealerships accelerate digitization efforts, integrating CRM systems and virtual showrooms to remain competitive.
Geography Analysis
Saudi Arabia Used Car Market
Saudi Arabia commanded 34.20% share of the Middle East and Africa used car market in 2025, underpinned by high disposable incomes, an extensive highway network, and Vision 2030 diversification projects that elevate commercial-fleet turnover. Customs-procedure simplification introduced has shortened import cycles and widened model availability, elevating transaction liquidity. Organized retailers leverage the kingdom’s mature financing ecosystem to scale certified pre-owned operations, capturing aspirational buyers seeking warranty-covered vehicles.
United Arab Emirates and Egypt Used Car Market
The United Arab Emirates posts the region’s fastest 6.82% CAGR through 2031, reflecting its role as a trade nexus and early adopter of digital classifieds. Free-zone logistics enable efficient re-export to African buyers, while progressive consumer-protection rules enhance confidence in cross-border online transactions. Platform operators pilot blockchain-based vehicle-history passports, strengthening resale propositions and drawing regional demand onto UAE hubs within the Middle East and Africa used car market. Egypt, with its sizeable population and growing middle class, ranks among the top volume contributors despite price sensitivity. Local assembly agreements with Chinese OEMs guarantee future inflows of competitively priced models into secondary channels.
MEA Used Car Market
Currency volatility encourages consumers to hedge against future price hikes by locking in used-car purchases, lifting volumes in the 3-5-year bracket. In sub-Saharan Africa, Kenya and South Africa exhibit robust informal trading networks, though gradual digitization fosters transparency improvements. Policy interventions such as Nigeria’s 12-year import-age restriction elevate fleet quality but redirect older vehicles to neighboring jurisdictions with lenient rules, reshaping intra-African trade flows. Morocco benefits from proximity to Europe and an established manufacturing base, while Kuwait and Oman maintain high per-capita ownership but smaller absolute volumes.
Regulatory Landscape
Used-vehicle trade across the Middle East and Africa is shaped by import-age caps, technical conformity rules, and tax and customs frameworks that determine what inventory can reach organized channels. In the GCC, the Unified Customs Law anchors a 5% customs duty on CIF value for imported vehicles, while country-level VAT (for example, 15% in Saudi Arabia and 5% in the UAE) changes total landed cost and dealer and platform pricing strategies.
Compliance is increasingly digital and standards-led. Saudi Arabia requires a Certificate of Conformity routed through the SABER platform under SASO requirements, alongside a 5-year maximum age limit for imported light vehicles (with specified exceptions). The UAE generally applies an import-age ceiling around 10 years and tightened emissions requirements by mandating Euro 6b pollutant limits for road motor vehicles from January 1, 2026, raising the compliance bar for older or non-GCC-spec units. In contrast, South Africa remains restrictive on used-vehicle imports via permit-based entry (ITAC), limiting broad commercial inflows and keeping cross-border supply more concentrated in relatively open hubs such as the UAE and parts of North Africa.
Value Chain Analysis
The used-car value chain in the Middle East and Africa runs from sourcing (trade-ins, fleet de-fleets, repossessions, and imports), to aggregation (dealers, informal traders, and digital marketplaces), to conditioning (inspection, reconditioning, and documentation), and finally to distribution (online classifieds and O2O fulfillment and offline showrooms). Organized players differentiate through certified pre-owned programs, finance and warranty bundling, and standardized inspections, while unorganized and P2P channels continue to dominate in many African markets where cash transactions and limited record-keeping constrain lender participation.
Logistics and trade infrastructure shape cross-border flows. The UAE operates as a regional gateway supported by vehicle and parts corridors around Jebel Ali Port, Khalifa Port, and Dubai South, while North Africa relies on nodes such as Tanger Med Port to connect with Europe-facing supply and re-export activity. Regulatory requirements, including origin certificates, conformity documentation, and varying import-age caps, add time and working-capital needs across the chain, reinforcing the role of platforms and intermediaries that can integrate verification, customs readiness, and transport into a single transaction experience.
Competitive Landscape
The Middle East and Africa used car market remains fragmented. Digital consolidation intensifies competitive pressure as Dubizzle Motors scales verification, financing, and logistics into a one-stop ecosystem. Al-Futtaim Automotive leverages its OEM franchises to extend certified pre-owned warranties, creating differentiation on quality assurance. Syarah’s Series C infusion funds inventory expansion and AI-driven pricing tools that compress dealer margins in Saudi Arabia [3].
White-space opportunities center on cross-border transaction facilitation, AI-enabled valuation algorithms, and battery-health analytics for EV resale. Chinese OEMs such as BYD and Geely cultivate residual-value confidence by partnering with inspection firms and offering extended battery guarantees. Fintech lenders penetrate underserved demographics by integrating platform-verified data into credit-scoring models, lowering default risk and capturing incremental market share.
Traditional unorganized vendors grapple with tightening compliance requirements that favor formal operators. The competitive environment rewards entities adept at combining localized market intelligence with scalable digital infrastructure, accelerating sector formalization within the Middle East and Africa used car market.
Middle East And Africa Used Car Industry Leaders
-
Dubizzle Motors (OLX UAE)
-
Al-Futtaim Automotive
-
Abdul Latif Jameel Motors
-
Kayishha (SellAnyCar KSA)
-
DubiCars
- *Disclaimer: Major Players sorted in no particular order
Middle East And Africa Used Car Market Companies Covered in this Report
- Al-Futtaim Automotive
- Dubizzle Motors (OLX UAE)
- Kayishha (SellAnyCar KSA)
- Abdul Latif Jameel Motors
- YallaMotor
- DubiCars
- Cars24 Middle East
- CarSwitch
- OpenSooq Motors
- Motory Saudi Arabia
- CarMax East Africa Limited
- Alba Cars
- CFAO Mobility South Africa
- Expat Motors
Market Opportunities and Future Outlook
Formalization opportunities cluster around compliance-ready cross-border trade, faster refurbishment capacity, and data-enabled trust layers that turn online demand into financed transactions. The market already shows strong digital pull, with online classifieds and e-commerce accounting for 73.60% of transactions in 2025. That mix creates room for dealer management system integrations, unified inventory syndication, and inspection and history-verification services that support lenders and reduce disputes.
Investment activity in 2026 also points to enabling infrastructure that improves used-vehicle liquidity through aftersales and parts availability. In June 2026, Hellmann Worldwide Logistics and INDU Group broke ground on a 300,000 square foot automotive logistics hub in Jebel Ali Free Zone (Jafza), focused on accelerating spare-parts distribution across the GCC and Africa. That capability supports faster reconditioning speed and uptime for higher-mileage vehicles. Regional localization programs, including TASARU Mobility Investments bringing global Tier-1 suppliers into King Abdullah Economic City (announced February 2026), and new component manufacturing investments in Morocco (LEONI cable plant groundbreaking in June 2026), strengthen the service ecosystem that underpins residual values and consumer confidence, including for newer technologies where battery and electronics readiness influence resale decisions.
Recent Industry Developments in Middle East And Africa Used Car Market
- June 2026: MW Motors expanded its partnership with DubiCars by listing over 100 premium and luxury vehicles with an "Exclusively On DubiCars" designation. The move strengthens differentiated online inventory strategies and supports platform-led demand capture in higher-ticket used segments across the UAE.
- July 2025: Al-Futtaim Automotive opened a new Al-Futtaim Automall and Al-Futtaim Auto Center near Dalma Mall in Abu Dhabi, adding onsite capacity for over 150 certified pre-owned vehicles. Added retail and aftersales capacity supports faster vehicle turnover and reinforces CPO-style buying experiences that compete directly with unorganized sellers.
- March 2024: Al-Futtaim Automotive highlighted its UAE pre-owned scale, citing sales of over 25,000 used vehicles in 2023 and referencing a dedicated Used Cars Prep Centre inaugurated in 2023 with capacity to prepare 25,000+ units annually. Higher-throughput reconditioning improves consistency and warranty readiness, which helps organized dealers defend pricing and capture more digitally sourced leads.
Middle East And Africa Used Car Market Report Scope and Research Methodology
Market Definition and Coverage
For this study, the market counts the value of used passenger vehicles sold across the Middle East and Africa, covering transactions completed through organized dealers and certified programs as well as unorganized and peer-to-peer channels.
Scope exclusions: We exclude brand-new vehicle sales, most aftersales services, and financing or insurance fees when they are billed separately from the used-vehicle selling price.
Segments Covered in This Report
- By Vehicle Type
- Hatchbacks
- Sedans
- SUVs and Crossovers
- MPVs
- By Vendor Type
- Organized (Dealerships and CPO)
- Unorganized (Independents and P2P)
- By Fuel Type
- Petrol
- Diesel
- Hybrid
- Battery-Electric
- By Vehicle Age
- 0-2 Years
- 3-5 Years
- 6-8 Years
- Above 8 Years
- By Distribution Channel
- Online Classified and E-commerce
- Offline / Brick-and-Mortar
- By Country
- United Arab Emirates
- Saudi Arabia
- Egypt
- Kenya
- South Africa
- Morocco
- Nigeria
- Kuwait
- Oman
- Rest of Middle East and Africa
Data Sources, Market Sizing, and Validation
Desk Research
Desk research was used to set the demand and supply context and to anchor country-level assumptions that later get tested in interviews. We typically review public sources such as national statistics offices and transport authorities in key MEA countries, customs and trade portals for used vehicle imports, and road safety and vehicle registration publications.
We also refer to sources such as central bank and ministry releases for inflation and FX context, automotive association updates, and large dealer group disclosures and investor materials that describe inventory turns, pricing, and consumer preferences by body type. In addition, patent databases and reputable press archives help us track verification, inspection, and online listing trends that can affect how quickly used cars transact. We also use paid subscriptions for company financials and news screening, plus import and export shipment-level checks in select corridors where trade materially influences supply. The sources listed here are illustrative and not exhaustive, and many other references are consulted to collect, validate, and clarify data points.
Primary Interviews and Surveys
Primary work focused on validating how used-car prices move, how volumes split across organized and unorganized channels, and how online discovery converts into offline closures. We spoke with dealer operators, independent traders, marketplace and inspection stakeholders, and country-focused experts across the Middle East and Africa to pressure-test assumptions, close data gaps, and align the final model with what is happening in the market.
Distribution of primary research fieldwork respondents
| Company type | Respondent position |
|---|---|
| Top tier: 29% | CXOs: 14% |
| Mid tier: 56% | Functional/Unit leaders: 27% |
| Smaller Players: 15% | Managers: 59% |
Market-Sizing & Forecasting
The core model is built using a top-down approach, where national used-vehicle demand pools are reconstructed from vehicle parc signals, replacement cycles, and cross-border supply flows, and then rolled up to the MEA total. To keep the numbers practical, the value is then derived by applying country and segment level average selling price (ASP) logic to estimated transaction volumes, followed by channel and vendor-type splits.
To corroborate totals, we also run selective bottom-up approximations using dealer throughput benchmarks, sampled price points from listings and auctions, and channel checks on how much of the market is organized versus unorganized. When gaps appear for smaller countries or informal trade routes, assumptions are filled using proxy indicators such as import unit trends, scrappage and age distribution, and urban population and income direction, and then re-tested with interview feedback.
For the forecast, scenario analysis is used because policy shifts, FX swings, and import rules can change used-car affordability quickly in MEA markets. The scenarios are guided by a small set of inputs that were repeatedly cited in validation, such as FX and inflation expectations, availability of used imports, new-car supply tightness, fuel price direction by country, and body-type mix shifts (for example, higher SUV share changing ASP behavior).
Data Validation & Update Cycle
Outputs are checked against independent market signals so obvious breaks get caught early, such as registration trends, import unit movements, and observed pricing behavior by vehicle age band. Variance checks are run at the country level and then again after rolling up to the regional total, and any outliers are reviewed in a second analyst pass before sign-off.
We refresh the model annually, and interim updates are made when material events occur, such as sharp currency moves, import duty changes, or sudden shifts in new-car availability that push demand into used vehicles. Before delivery, the full dataset is re-checked to ensure the latest macro inputs and interview notes are reflected in the final view clients receive.
Mordor Intelligence's Middle East and Africa Used Car Market Size Measured Against Other Published Estimates
Published market values for MEA used cars can differ quite a bit, even when the topic sounds identical, because the underlying timing and pricing choices are not always handled the same way. Differences usually come from what gets counted as a used-car transaction, which countries are included as "Rest of MEA," and whether values are converted using average-year FX or a point-in-time rate.
In this study, the refresh cadence and currency timing were treated as first-order choices, and the ASP path was rechecked against observed mix shifts (SUV share, vehicle age bands, and organized versus unorganized channel behavior). This is also aligned with the repeatable set of checks used by Mordor Intelligence.
Benchmark comparison
| Source | Market Size | Gaps in Research Methodology |
|---|---|---|
| Mordor Intelligence | USD 93.01 B (2025) | |
| Regional Consultancy A | USD 88.40 B (2025) | Uses a narrower country roll-up that appears to undercount Rest of MEA markets and applies conservative ASPs by relying more on informal trade price points without fully adjusting for organized dealer premiums. |
| Trade Journal B | USD 101.20 B (2025) | Tends to blend used passenger cars with adjacent categories in some countries and applies spot FX conversion that can inflate USD values during weaker local-currency periods, without a consistent check against registration and import-unit signals. |
Overall, the spread is mainly explained by how country coverage is rolled up and how ASP and FX timing are treated in value conversion. By tying the total back to observable demand signals and keeping the conversion and refresh rules consistent, the estimate stays easier to audit and reproduce across MEA markets as conditions change over the year.
Key Questions Answered in the Report
What is the forecast value of the Middle East and Africa used car market by 2031?
The market is expected to reach USD 126.34 billion by 2031, reflecting a 5.23% CAGR.
Which vehicle type leads regional used-car sales?
SUVs and crossovers hold the top position with 42.72% share in 2025 due to superior desert adaptability.
How dominant are digital platforms in used-car transactions?
Online classifieds and e-commerce sites controlled 73.60% of transactions in 2025 and continue to expand.
Why are battery-electric vehicles the fastest-growing segment?
Early fleet electrification and supportive incentives drive a 9.92% CAGR, even though heat-induced degradation remains a challenge.
Which country shows the highest growth rate in regional used-car sales?
The United Arab Emirates leads with a 6.82% CAGR through 2031, supported by advanced digital marketplaces and favorable regulations.
How is vendor formalization progressing?
Organized channels are growing faster than the overall market at 6.55% CAGR, driven by certified pre-owned programs and regulatory support.