
Market Overview
| Study Period | 2020 - 2031 |
|---|---|
| Forecast Data Period | 2026 - 2031 |
| Base Year Market Size (2025) | USD 345.04 Billion |
| Market Size (2026) | USD 381.79 Billion |
| Market Size (2031) | USD 633.38 Billion |
| Growth Rate (2026 - 2031) | 10.65 % |
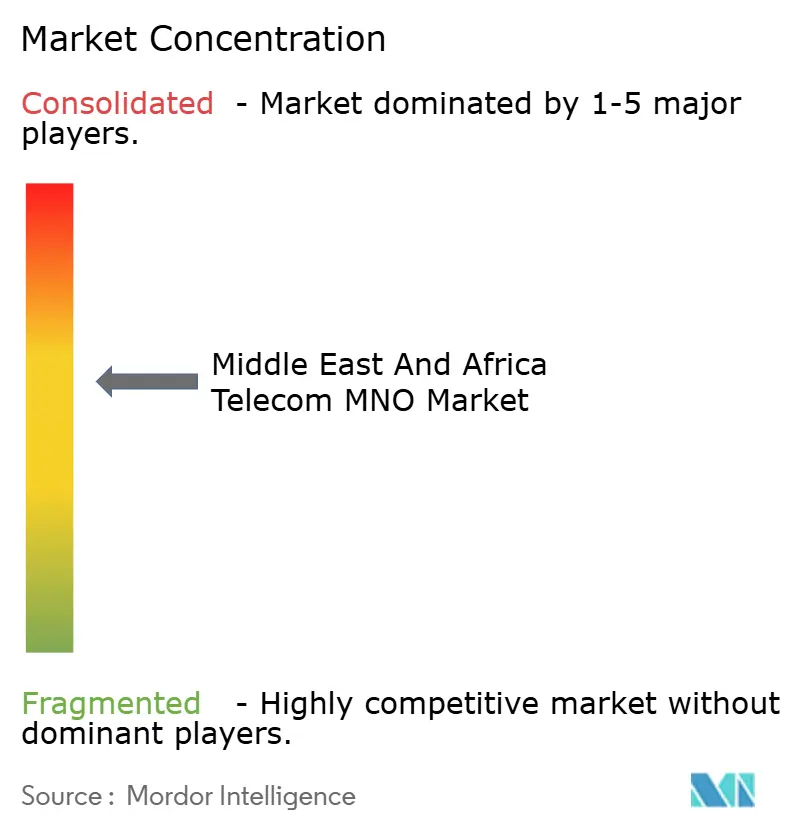
| Market Concentration | Medium |
Major Players *Disclaimer: Major Players sorted in no particular order Image © Mordor Intelligence. Reuse requires attribution under CC BY 4.0. | |
Middle East and Africa Telecom MNO Market Analysis by Mordor Intelligence
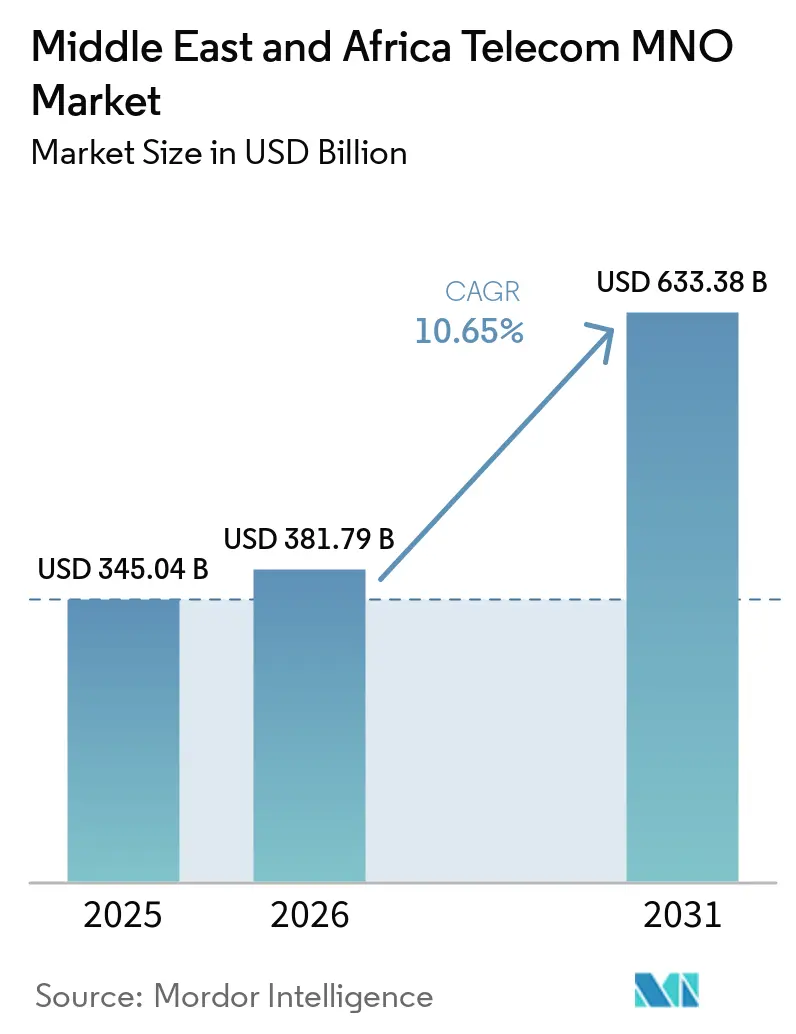
The Middle East And Africa Telecom MNO Market size is projected to be USD 345.04 billion in 2025, USD 381.79 billion in 2026, and reach USD 633.38 billion by 2031, growing at a CAGR of 10.65% from 2026 to 2031. In terms of subscriber volume, the market was valued at 1.81 billion Subscribers in 2025 and is expected to grow from 1.95 billion Subscribers in 2026 to 2.84 billion Subscribers by 2031, at a CAGR of 7.80% during the forecast period (2026-2031).
Rapid 5G deployments, expanding fiber backhaul, and rising smartphone penetration combine to keep the region on a structurally high-growth trajectory. Investment intensity remains elevated: Egypt paid USD 150 million for its first 5G license, while Saudi Arabia pushed 5G Fixed Wireless Access (FWA) to 78% population coverage in 2025. Morocco committed USD 475 million to reach 25% 5G coverage by end-2025, underscoring a broad policy focus on next-generation access. Competitive pressure from low-earth-orbit (LEO) satellite broadband and geopolitical risks around the Red Sea cable corridor temper sentiment, but are offset by enterprise digitalization and mobile-money-driven ARPU gains.
Key Report Takeaways
- By service type, data and Internet services held 39.35% of the Middle East and Africa telecom MNO market share in 2025; IoT and M2M services are projected to expand at a 10.74% CAGR between 2026 and 2031, the fastest growth among service categories.
- By end-user, consumer connections contributed 72.95% revenue in 2025, while enterprise subscriptions are poised for an 11.05% CAGR through 2031.
- By geography, the Middle East commanded 52.10% revenue share in 2025; Africa is advancing at a 10.70% CAGR to 2031.
Note: Market size and forecast figures in this report are generated using Mordor Intelligence’s proprietary estimation framework, updated with the latest available data and insights as of 2026.
Market Trends and Insights
Drivers Impact Analysis of Middle East and Africa Telecom MNO Market*
| Driver | (~) % Impact on CAGR Forecast | Geographic Relevance | Impact Timeline |
|---|---|---|---|
| Video-centric mobile data boom | +2.8% | Gulf cities, Cairo, Johannesburg | Short term (≤ 2 years) |
| Supportive spectrum auctions for 4G/5G | +2.1% | Saudi Arabia, UAE, North Africa | Medium term (2-4 years) |
| Enterprise IoT/M2M adoption | +1.9% | UAE, South Africa, Nigeria | Medium term (2-4 years) |
| Youth-led smartphone uptake | +1.7% | Nigeria, Kenya, Tanzania | Long term (≥ 4 years) |
| Cross-border mobile-money use | +1.4% | Kenya–Gulf, West Africa corridors | Medium term (2-4 years) |
| Private 5G for mega-projects | +1.3% | UAE, Saudi giga cities | Long term (≥ 4 years) |
| Source: Mordor Intelligence | |||
Explosive growth in mobile data traffic from video-centric apps
Video viewing reshapes operator revenue architecture as users pivot from voice and SMS to high-definition streaming. SMS revenue in the Gulf fell from USD 4.3 billion in 2013 to a projected USD 3.2 billion in 2018, while mobile data volumes rose 180% in the same span [1]. Operators respond by densifying 5G small cells; the MENA small-cell market is projected to reach USD 412.54 million by 2030, a 40.9% CAGR [2]. FWA subscriptions, priced near USD 70 each month, monetize in-home streaming traffic without fresh fiber builds. Network planners now weigh the cost of massive-MIMO upgrades against the rising willingness of premium users to pay for gigabit packages. In Sub-Saharan Africa, monthly data usage is forecast to triple to 14 GB per user by 2030, demanding parallel investment in both spectrum and backhaul.
Accelerated 4G and 5G roll-outs enabled by supportive spectrum auctions
Regulators across the Gulf and North Africa now favor coverage targets over windfall auction fees. Saudi Arabia’s 2025-2027 Spectrum Outlook sets aside new bands for non-terrestrial networks and FWA via light licensing, slashing time-to-market for operators. South Africa’s draft 2025 National Radio Frequency Plan similarly carves out dedicated private-network spectrum that encourages industrial 5G [3]. The UAE already operates 7,000 5G sites, with a policy aiming for 500 on-campus private networks by 2025. Concurrent 2G/3G switch-offs in Bahrain, Jordan, Kuwait, and Saudi Arabia release low-band spectrum for 5G, further boosting spectral efficiency. The collective result is faster rural broadband coverage and lower per-bit delivery cost, crucial for sustaining the Middle East and Africa telecom MNO market’s profit pool.
Enterprise digitization fueling IoT/M2M connectivity demand
Industrial players demand deterministic latency and on-site data sovereignty, propelling private LTE/5G investment that will top USD 6 billion by 2027, with 60% earmarked for standalone 5G cores. e& built what it calls the world’s largest private 5G network for ADNOC, validating the business case for high-volume, low-latency industrial connectivity. Verticals such as mining, oil and gas, and utilities rely on network slicing to segregate mission-critical traffic. The rise of Network-as-a-Service platforms lowers capex thresholds, enabling mid-tier enterprises and smart-city authorities to order pay-as-they-grow connectivity. As these use cases scale, IoT SIM activations accrue directly to the Middle East and Africa telecom MNO market.
Youth-driven smartphone adoption across Sub-Saharan Africa
Africa’s median age of 19.7 years supports a long runway for first-time smartphone ownership. Devices in use will grow from 540 million in 2024 to 890 million by 2030, and average monthly data per user will triple to 14 GB. Backhaul remains the key bottleneck: 584 million people already live within reach of fiber nodes, but many landlocked states still lack affordable middle-mile routes. Governments that streamline rights-of-way and import duties, such as Côte d’Ivoire, are rewarded with 23.8 Mbps median 4G speeds that stimulate further device adoption [4]. Youth cohorts also embrace mobile wallets, deepening operator relevance in daily commerce and raising blended ARPU.
Restraints Impact Analysis of Middle East and Africa Telecom MNO Market*
| Restraint | (~) % Impact on CAGR Forecast | Geographic Relevance | Impact Timeline |
|---|---|---|---|
| Price competition plus SIM registration | −1.8% | Ghana, Kenya, South Africa | Short term (≤ 2 years) |
| Geopolitical instability | −1.2% | Red Sea corridor, Sahel, Gaza | Medium term (2-4 years) |
| LEO satellite substitution | −0.9% | Rural Nigeria, remote Oman | Long term (≥ 4 years) |
| Limited fiber backhaul | −0.7% | Chad, Central African Republic | Long term (≥ 4 years) |
| Source: Mordor Intelligence | |||
Aggressive price competition and SIM registration curbing ARPU
Mandatory biometric SIM registration raises compliance costs even as new entrants trigger price wars in markets like Kenya and Ghana. Inflation adds a second squeeze by eroding consumer spend capacity, while regulators cap tariff hikes to protect households. Operators counter with content bundles and loyalty apps, but execution is uneven in fragmented regulatory environments, restraining monetization in the Middle East and Africa telecom MNO market.
Geopolitical instability delaying infrastructure investment
The February 2024 Red Sea cable cut disrupted connectivity for more than 100 million users and forced rerouting of traffic, underscoring the vulnerability of a region that handles up to 17% of the world’s Internet flows. Khartoum historically delivered more than one-third of the Sudan telecom MNO market size, yet repeated tower damage compelled operators to reroute traffic to Port Sudan, where international undersea cables land. Capital-intensive projects such as new landing stations face financing delays when conflict risk rises, slowing coverage expansion in Yemen, Sudan, and Ethiopia. To mitigate single points of failure, investors now insist on dual-path designs and on-shoring of key equipment, measures that add cost and extend build timelines.
*Our forecasts treat driver/restraint impacts as directional, not additive. The impact forecasts reflect baseline growth, mix effects, and variable interactions.
Middle East and Africa Telecom MNO Market Segment Analysis
By Service Type:
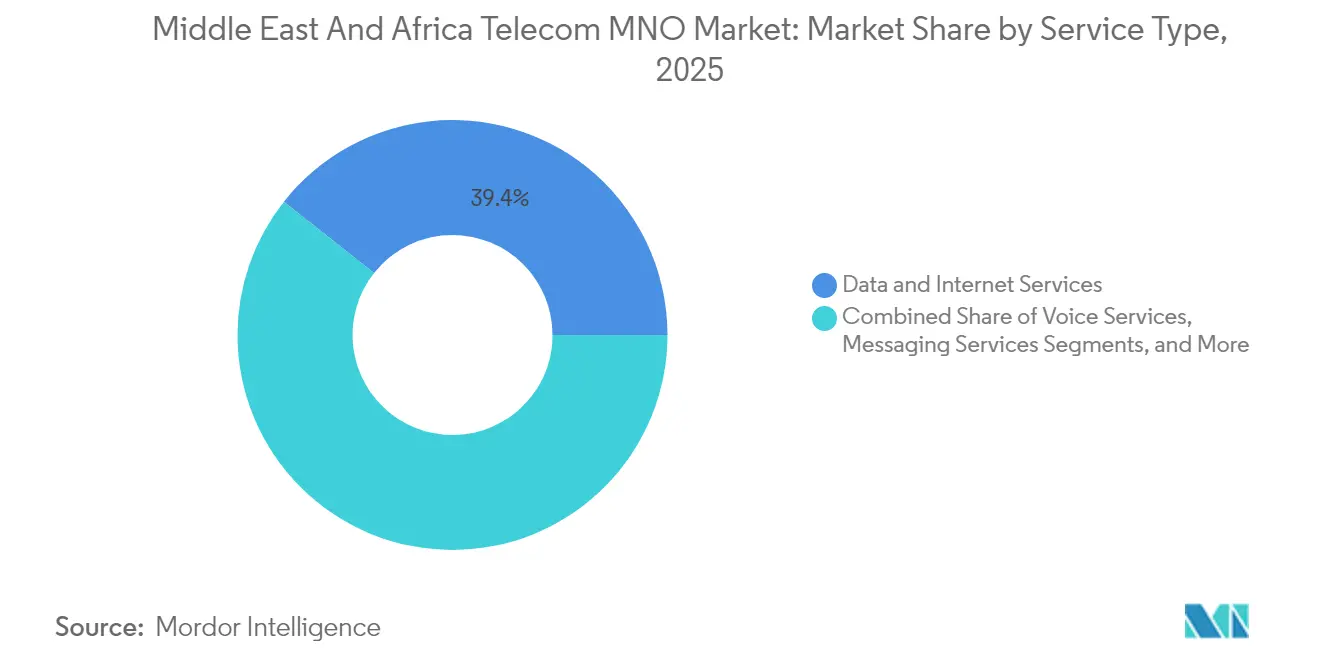
Data services consolidate revenue leadershipData and Internet plans accounted for 39.35% of 2025 revenue, making them the single largest contributor to the Middle East and Africa telecom MNO market. IoT/M2M is the standout, expanding at a CAGR of 10.74% in the Middle East and Africa telecom MNO market size by 2031. Voice and messaging together will slip below 25% as OTT platforms cannibalize usage. Operators respond by zero-rating video services and bundling PayTV to sustain stickiness. Edge computing nodes and API monetization emerge as adjacent revenue streams that complement data plans.
Over the forecast horizon, Apps-as-a-Service models will lean on 5G standalone cores, opening low-latency use cases in gaming and telemedicine. Roaming and wholesale traffic, once cyclical, stabilize as intra-Africa trade flows broaden. Average data pricing will continue its southward drift but remain offset by strong volume elasticity, supporting the Middle East and Africa telecom MNO market size expansion.

By End-User:
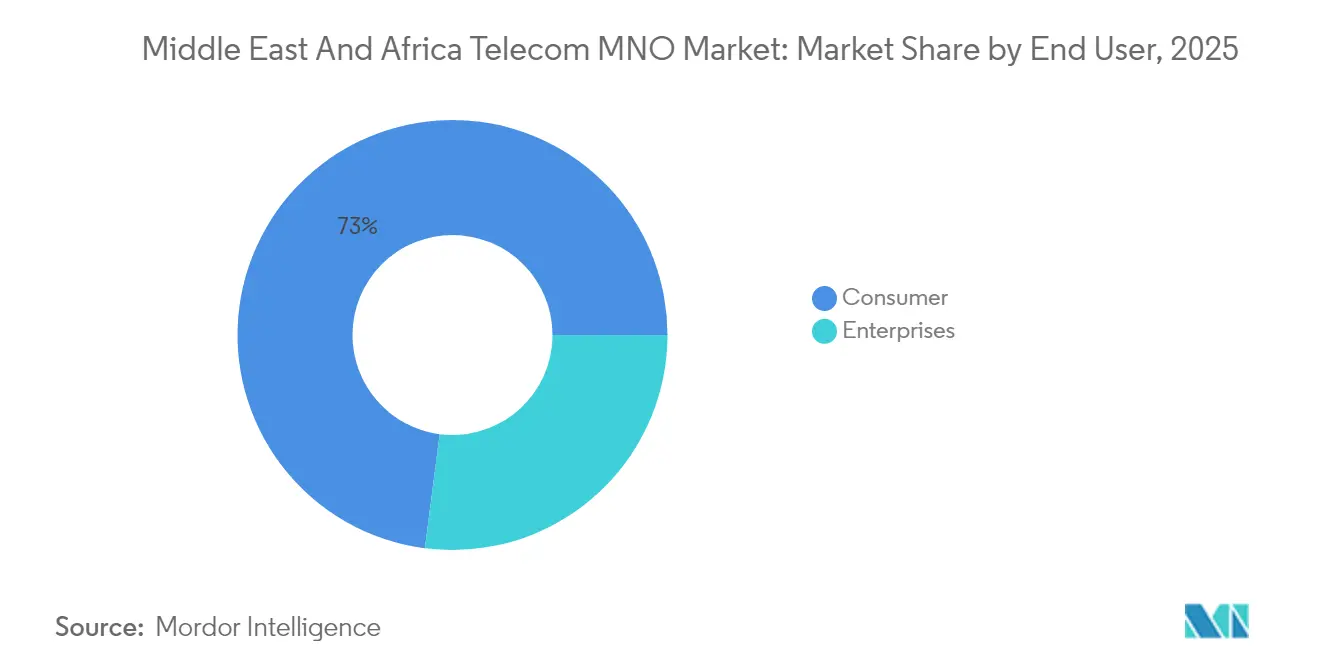
Enterprise acceleration chips away at consumer dominanceConsumers still delivered 72.95% of 2025 revenue, but their share will dip by 2031 as enterprises ramp dedicated networks. The enterprise slice of the Middle East and Africa telecom MNO market size is projected to reach 11.05% CAGR by 2031. Manufacturing, oil and gas, and logistics drive demand for low-latency connectivity and deep indoor coverage. Private 5G proofs-of-concept in Saudi giga-projects and South African mines validate willingness to pay premiums of 2-2.5× consumer ARPU.
In parallel, consumer growth is fueled by smartphone affordability. Sub-USD 60 handsets now support 4G, widening the addressable base. Mobile-money interoperability, live across 28 African markets, has raised average user spend from USD 2.2 to USD 3.2 per month, cushioning the Middle East and Africa telecom MNO market against unit price erosion.
Geography Analysis
MEA Telecom MNO Market
The Middle East delivered 52.10% of revenue in 2025 on the back of higher ARPU; Saudi postpaid averages USD 34 per month. Operators leverage extensive fiberized towers and dense small-cell overlays to upsell premium FWA packages, ensuring the Middle East and Africa telecom MNO market share of the sub-region remains robust. Independent TowerCos held 47.55% of the Middle East telecom towers market in 2024, expanding at a 6.52% CAGR as carriers offload passive assets for 5G funding. Africa delivers the fastest 10.70% CAGR. Nigeria, Kenya, and South Africa account for two-thirds of sub-Saharan data traffic, yet large white spaces persist in the Sahel and Central Africa, preserving long-term upside.
North Africa and Gulf Telecom MNO Market
Forecast models show that by 2031, Africa will contribute 49.20% of the Middle East and Africa telecom MNO market size, nearly closing the gap with the Gulf. North Africa acts as a swing region: Egypt’s USD 150 million 5G license and Morocco’s 25% coverage target illustrate rapid modernization trajectories that pull average regional speeds upward.
Regulatory Landscape
Regulatory priorities across the Middle East and Africa are shifting toward coverage-led 5G licensing and stronger consumer protection, with more explicit market-power remedies where competition is uneven. In Ghana, the National Communications Authority (NCA) removed Next-Gen InfraCo (NGIC) exclusivity for wholesale 5G in July 2026 under the Electronic Communications Act, 2008, and moved to an open-market spectrum award process. The NCA also applied Significant Market Power rules to MTN Ghana, increasing the effective price of targeted 5G spectrum in the 700 MHz and 3 GHz bands via a premium on reserve prices.
Across other key markets, regulators are tightening conduct requirements while enabling capital market and infrastructure reforms. South Africa’s ICASA gazetted updated consumer rules in January 2026 that extend data bundle validity and require opt-in for out-of-bundle charges, directly influencing retail-pack design and monetization levers. In Qatar, the Communications Regulatory Authority (CRA) issued Decision No. (12) of 2026 to standardize access offers for submarine cable landing stations, reinforcing transparency and non-discriminatory terms for co-location and backhaul. Kenya’s Capital Markets Authority (CMA) granted an exemption tied to Safaricom’s shareholding changes in June 2026, signaling a willingness to accommodate strategic ownership adjustments while keeping public-market safeguards in place.
Competitive Landscape
Competitive intensity is bifurcated. Gulf markets remain oligopolistic: STC, e&, and Ooredoo together hold a significant share of regional revenue, allowing scale efficiencies. Africa is more fragmented, with over 230 licensed operators. Consolidation is accelerating; STC gained regulatory clearance for a Public Investment Fund purchase that deepens domestic integration and frees capital for cross-border expansion. Vodacom and Orange are evaluating infrastructure-sharing in multiple African markets to cut duplicated capex and speed rural rollouts.
Technology strategies differ by market maturity. Gulf incumbents deploy AI for predictive maintenance and launch open API platforms via the GSMA Open Gateway initiative, an effort e& joined through a strategic stake in Aduna. African challengers focus on cash-generating mobile-money ecosystems; Safaricom’s M-Pesa clone partnerships now span 12 markets. Private 5G is a new battleground: Nokia, Ericsson, and Huawei are chasing contracts in mining, ports, and petrochemicals with solutions already live or in trial across Saudi gigaprojects and South African platinum pits. LEO operators upend rural economics; traditional MNOs counter with hybrid satellite-cellular bundles to retain subscribers.
Regulatory acceptance of in-market mergers has loosened. The number of consumer-facing brands is expected to fall by 15% through 2027 as spectrum scarcity encourages rationalization. Despite this, entry barriers remain modest for virtual operators focused on diaspora voice and fintech-adjacent niches, preserving innovation dynamics within the Middle East and Africa telecom MNO market.
Middle East and Africa Telecom MNO Industry Leaders
-
eand (Etisalat Group)
-
MTN Group
-
STC Group
-
Zain Group
-
Vodacom Group
- *Disclaimer: Major Players sorted in no particular order
Middle East and Africa Telecom MNO Market Companies Covered in this Report
- e& (Etisalat Group)
- STC Group
- Ooredoo Group
- Zain Group
- MTN Group
- Vodacom Group
- Orange Middle East and Africa
- Airtel Africa
- Safaricom PLC
- Maroc Telecom SA
- Telecom Egypt (WE)
- Globacom Limited (Glo Mobile)
- 9mobile (EMTS)
- Telkom SA SOC Limited
- Cell C
- Omantel
- Batelco (Beyon Group)
- du (EITC)
- Sudan Telecom Group Limited (Sudatel)
- Ethio Telecom
- AXIAN Telecom
- Econet Wireless Zimbabwe
- MTC Namibia
Read Analysis of Middle East and Africa Telecom MNO Companies
Market Opportunities and Future Outlook
A visible opportunity is emerging in newly opened or restructured 5G licensing pathways that translate policy intent into near-term network build programs and enterprise use-case capacity. Ghana’s July 2026 shift to an open 5G spectrum award, including a stated minimum reserve value of USD 230 million across the 700 MHz, 2.3 GHz, and 3 GHz bands, creates a concrete pipeline for 5G radio and transport upgrades. It also supports packaged FWA propositions that complement limited fixed broadband availability in many cities. Alongside this, enterprise connectivity demand continues to offer a clear monetization route, supported by regional proof points including e& building what it describes as the world’s largest private 5G network for ADNOC, and by broader interest in private-network spectrum frameworks.
International connectivity and civil-works coordination are another area where policy can change rollout economics and service resilience. Qatar’s CRA access framework for submarine cable landing stations, effective in 2026, lowers friction for capacity buyers and can widen wholesale and enterprise service portfolios for MNOs and their infrastructure affiliates. Nigeria’s Dig-Once policy workstream, formalized under consultation in 2026, provides a mechanism to reduce repeated trenching and accelerate fiber and backhaul extensions. These policy signals align with operator strategies to unbundle towers, fintech, and data-center layers, helping attract specialized capital and accelerate investment cadence without relying solely on traditional mobile service margins.
Recent Industry Developments in Middle East and Africa Telecom MNO Market
- July 2026: Zain Group secured a 25-year telecom license in the Syrian Arab Republic for USD 747 million and announced an USD 800 million plan to modernize the network with 5G and AI technologies. The license expands its regional footprint and positions the group to deploy long-cycle CAPEX in a high-potential market. This move could enable monetization through advanced services as digital demand grows in the region.
- June 2026: Vodacom Group completed acquisition of an additional 20% effective stake in Safaricom PLC, increasing its holding to 55%. The stake increase strengthens cross-border mobile and fintech control within a leading East Africa ecosystem. The consolidation accelerates regional integration and value extraction across Kenya and adjacent markets.
- May 2026: MTN Group published Q1 2026 trading update confirming progress on the proposed structural separation of MoMo Payment Services Bank and the IHS Towers acquisition. The developments indicate ongoing portfolio optimization and potential cost-synergy realisation. The move reinforces MTN’s diversification into digital services and network infrastructure ownership.
Middle East and Africa Telecom MNO Market Report Scope and Research Methodology
Market Definition and Coverage
This market is measured as telecom mobile network operator (MNO) service revenue generated across the Middle East and Africa, including consumer and enterprise connectivity services delivered on mobile and related access networks.
Scope exclusions: We exclude handset device sales, pure network equipment sales, and non-operator digital services that sit outside telecom service revenue.
Segments Covered in This Report
- Overall Telecom Revenue and ARPU
- Service Type
- Voice Services
- Data and Internet Services
- Messaging Services
- IoT and M2M Services
- OTT and PayTV Services
- Other Services (VAS, Roaming, Enterprise and Wholesale, etc.)
- End-user
- Enterprises
- Consumer
- Geography
- Middle East
- Saudi Arabia
- United Arab Emirates
- Rest of the Middle East (Qatar, Kuwait, Bahrain, Oman, Jordan, Iraq, Lebanon, Israel, and Others)
- Africa
- South Africa
- Nigeria
- Rest of Africa (Egypt, Morocco, Algeria, Tunisia, Ghana, Tanzania, Senegal, Ethiopia, Uganda, Kenya, and Others)
- Middle East
Data Sources, Market Sizing, and Validation
Desk Research
Desk research was used to set the base structure of the model and to anchor it to consistent, publicly traceable indicators. We referenced official communications and statistical releases, such as telecom regulator dashboards and annual reports, ITU indicators, World Bank population and macro series, and GSMA Intelligence-style public snapshots where available, followed by central bank exchange-rate series for currency consistency.
To avoid building the model on one data stream, we also reviewed operator annual reports and investor presentations, spectrum award notes and license announcements, and reputable press coverage of major network rollouts and pricing changes. Where the public trail was thin, we used a few paid subscriptions for company financials and intelligence, news and financials, and patent databases to cross-check timelines and validate directional changes. These desk sources are illustrative, and many other public documents and datasets were also used for collection, validation, and clarification.
Primary Interviews and Surveys
We use expert interviews and surveys with operators, regulators, infrastructure specialists, enterprise buyers, and distribution managers across Middle East and Africa. Their feedback tests revenue, ARPU, data demand, 5G timing, and country gaps, helping us adjust assumptions and reconcile the final estimate.
Distribution of primary research fieldwork respondents
| Company type | Respondent position |
|---|---|
| Top tier: 29% | CXOs: 18% |
| Mid tier: 46% | Functional/Unit leaders: 31% |
| Smaller Players: 25% | Managers: 51% |
Market-Sizing & Forecasting
Our sizing starts with a top-down build that reconstructs telecom service revenue using subscriber volumes and mix, paired with ARPU and usage-led pricing signals by key MEA country clusters, which is then rolled up to a regional total. The totals were corroborated with selective bottom-up approximations, such as sampled operator revenue roll-ups, plan-level price checks, and volume cross-checks from subscriber additions, so the final number stays realistic when public reporting styles differ.
Inputs that mattered in this market included mobile subscriber base and net adds, smartphone and 4G and 5G adoption, prepaid versus postpaid mix, data traffic growth as a proxy for bundle upgrades, spectrum release timing, and inflation and currency movement that can distort USD reporting. When a sub-country or service line was not cleanly disclosed, we handled the gap through ratio-based allocations informed by comparable markets, then re-checked using interview feedback.
For forecasting, scenario analysis was used so growth could be flexed based on how quickly data revenue replaces voice, how fast 5G coverage expands in the Gulf, and how affordability and network quality improve across Africa. Assumptions were aligned to what experts described as the most likely commercial path, and then stress-tested for a slower price environment and for a faster adoption environment.
Data Validation & Update Cycle
We validated outputs by triangulating across independent signals, including subscriber trajectories, ARPU ranges, and operator revenue disclosures, and then checking whether implied revenue per user stayed sensible against pricing and usage realities. Any large variance by country cluster triggered a deeper review of currency timing, one-off items, and classification differences between mobile, fixed, and value-added lines.
Before sign-off, the model went through multi-step analyst reviews where calculations, assumptions, and unit consistency were checked, followed by re-contacting sources when a data break or a market event changes the story materially. Reports are refreshed annually, and interim updates are made when major spectrum awards, regulatory shifts, or macro shocks occur. Right before delivery, a fresh update pass is completed so clients receive the latest view.
Mordor Intelligence's Middle East and Africa Telecom Market Size Versus Other Published Estimates
Published market sizes for MEA telecom often do not match because studies choose different revenue boundaries, currency timing, and country coverage, and then carry those choices into the forecast. The table makes this visible by showing how one estimate can expand when adjacent categories are included, or contract when conservative ARPU progression is assumed.
The benchmark table shows a spread mainly because, in Mordor Intelligence's model, the scope is anchored to MNO telecom service revenue in MEA and is kept separate from handset sales and pure network equipment revenue, and the USD conversion is aligned to a consistent base-year window before forecasting forward.
Benchmark comparison
| Source | Market Size | Gaps in Research Methodology |
|---|---|---|
| Mordor Intelligence | USD 345.04 B (2025) | |
| Regional Consultancy A | USD 400.88 B (2026) | This figure appears to use a broader telecom boundary and a different base year, which can pull in adjacent services and apply a faster ARPU step-up from early 5G monetization in Gulf markets. |
| Industry Report B | USD 88.00 B (2025) | This type of estimate is often based on a narrower revenue slice (for example, fixed broadband or a single service category) and can exclude large parts of mobile service revenue across Africa, which reduces the total. |
Taken together, the comparison suggests the largest gaps come from what is counted as telecom revenue and how USD timing is handled, rather than from arithmetic mistakes. By keeping the model tied to subscriber and ARPU mechanics and then validating against operator disclosures and rollout milestones, the final number stays traceable to repeatable steps that can be rechecked as new data arrives.
Key Questions Answered in the Report
How large is the Middle East and Africa telecom MNO market in 2026?
It stands at USD 381.79 billion, with a projected rise to USD 633.38 billion by 2031.
Which service category leads regional revenue?
Data and Internet plans generate 39.35% of total revenue, far ahead of voice and messaging.
What CAGR is expected for IoT/M2M lines?
IoT and M2M connections are projected to grow at 10.74% CAGR through 2031, the fastest among all segments.
Which geography is growing quickest?
Africa is forecast to expand at a 10.70% CAGR as youth-driven smartphone adoption accelerates.
How will private 5G influence enterprise spending?
Private 5G networks are unlocking new industrial automation use cases and are expected to lift enterprise revenue to more than USD 190 billion by 2031.
What competitive threat do LEO satellites pose?
LEO services such as Starlink already serve rural customers in 18 African nations, pressuring MNOs to refine rural pricing and bundle strategies.