
Market Overview
| Study Period | 2020 - 2031 |
|---|---|
| Forecast Data Period | 2026 - 2031 |
| Base Year Market Size (2025) | USD 12.07 Billion |
| Market Size (2026) | USD 12.63 Billion |
| Market Size (2031) | USD 15.81 Billion |
| Growth Rate (2026 - 2031) | 4.60 % |
| Market Concentration | Medium |
Major Players *Disclaimer: Major Players sorted in no particular order Image © Mordor Intelligence. Reuse requires attribution under CC BY 4.0. | |
Middle East And Africa Soft Drinks Packaging Market Analysis by Mordor Intelligence
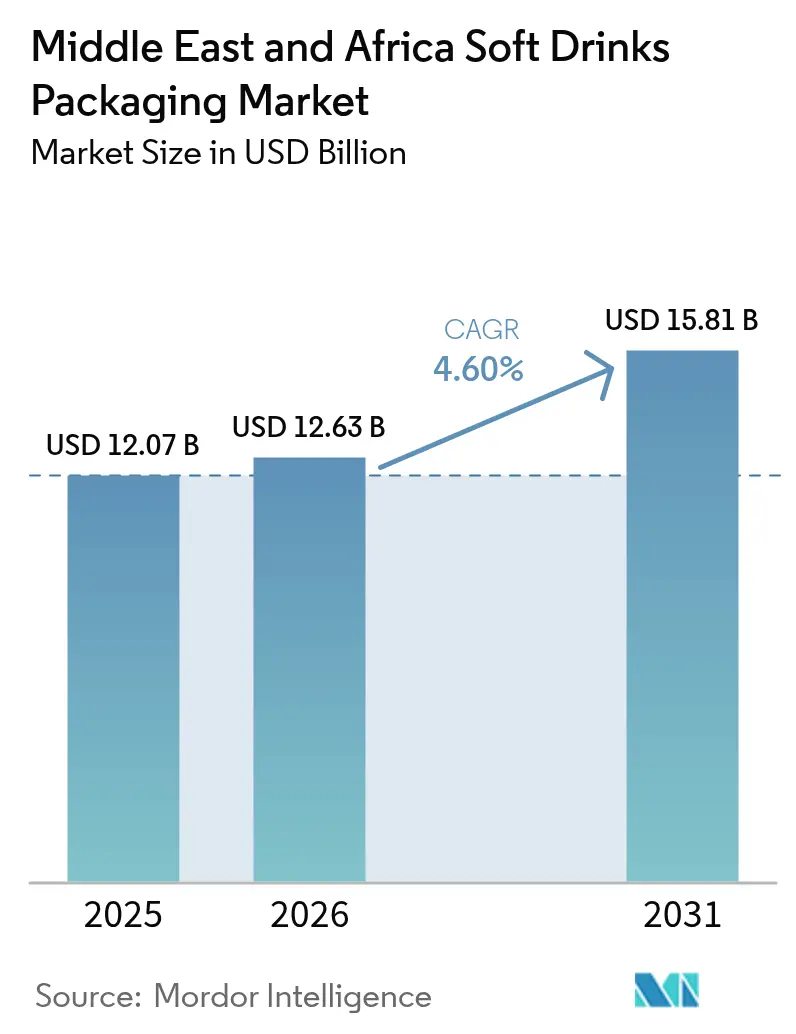
The Middle East and Africa soft drinks packaging market size in 2026 is estimated at USD 12.63 billion, growing from 2025 value of USD 12.07 billion with 2031 projections showing USD 15.81 billion, growing at 4.60% CAGR over 2026-2031. This trajectory flows from rapid urbanization, youthful demographics, and rising demand for convenient, ready-to-consume beverages across bottled water, carbonates, and emerging functional categories. Shrinking household sizes, the spread of modern retail, and government-backed industrial programs in the Gulf further intensify packaging requirements. Suppliers benefit from integrated petrochemical chains that lower PET resin costs, while investors target aseptic filling, lightweighting, and in-country manufacturing to align with localization mandates. Heightened Extended Producer Responsibility (EPR) fees and looming single-use plastic bans push brand owners toward aluminum, paperboard, and tethered-cap solutions, opening white-space for material innovators ready to meet tightening sustainability targets.
Key Report Takeaways
- By primary material, plastic held 52.05% of the Middle East and Africa soft drinks packaging market share in 2025, whereas paper and paperboard are forecast to expand at a 6.05% CAGR to 2031.
- By packaging format, bottles dominated with 61.10% revenue share of the Middle East and Africa soft drinks packaging market in 2025; cartons and aseptic bricks are projected to grow at a 5.78% CAGR through 2031.
- By beverage type, bottled water accounted for 46.15% of the Middle East and Africa soft drinks packaging market size in 2025, while ready-to-drink tea and coffee are advancing at a 5.95% CAGR to 2031.
- By pack capacity, the 501-1000 mL range led with 46.60% share of the Middle East and Africa soft drinks packaging market in 2025; packs of ≤330 mL register the fastest 5.55% CAGR through 2031.
- By country, Saudi Arabia commanded a 34.80% share of the Middle East and Africa soft drinks packaging market in 2025, whereas South Africa is set to post the highest 5.86% CAGR to 2031.
Note: Market size and forecast figures in this report are generated using Mordor Intelligence’s proprietary estimation framework, updated with the latest available data and insights as of 2026.
Market Trends and Insights
Drivers Impact Analysis of Middle East And Africa Soft Drinks Packaging Market*
| Driver | (~) % Impact on CAGR Forecast | Geographic Relevance | Impact Timeline |
|---|---|---|---|
| Rising bottled-water consumption in GCC | +0.8% | GCC core, wider MEA spillover | Medium term (2-4 years) |
| Surge in demand for convenience and on-the-go single-serve packs | +0.7% | UAE, Saudi Arabia, South Africa first movers | Short term (≤ 2 years) |
| Hydrocarbon-to-polymer capacity expansions lowering PET cost | +0.6% | Middle East core, North Africa secondary | Medium term (2-4 years) |
| Brand shift toward tethered and lightweight caps | +0.4% | Regionwide via EU rules influence | Long term (≥ 4 years) |
| Localization incentives under Saudi Vision 2030 encouraging can lines | +0.5% | Saudi Arabia primary | Medium term (2-4 years) |
| Growth of aseptic filling hubs for fermented and plant-based drinks | +0.6% | Saudi Arabia, UAE, South Africa hubs | Medium term (2-4 years) |
| Source: Mordor Intelligence | |||
Rising Bottled-Water Consumption in GCC
Persistent water-scarcity concerns and variable municipal supply quality continue to steer Gulf households toward packaged hydration. Saudi Arabia’s National Water Strategy 2030 has prioritized diversified sourcing, indirectly sustaining bottled water demand as utilities modernize.[1] Sidel’s 80,000-bph PET lines, deployed with regional bottlers, illustrate how plant investments capture this surge. A youthful population, more than 60% under 30, gravitates to premium and functional waters, lifting packaging value per unit and reinforcing the primacy of PET containers in the Middle East and Africa soft drinks packaging market.
Surge in Demand for Convenience and On-the-Go Single-Serve Packs
Compressed work routines and the expansion of convenience retail have made sub-330 mL packs commonplace. Unit volumes in this size band are rising at a 5.8% CAGR, outpacing larger formats as consumers blend portion control with mobility. SIG’s DomeMini carton bottle (180-350 mL) pairs portability with aseptic integrity, making carton options viable for on-the-go consumption.[2] Uptake concentrates in Riyadh, Dubai, and Johannesburg, where busy lifestyles and food-service channels intersect, propelling the Middle East and Africa soft drinks packaging market toward higher-margin, single-serve applications.
Hydrocarbon-to-Polymer Capacity Expansions Lowering PET Cost
Integrated refinery-to-polymer investments across Saudi Arabia and the broader Gulf generate material cost advantages. These chains insulate converters from global resin volatility and underpin PET’s 52.7% share. Lower feedstock expenses flow directly to high-volume bottled-water lines, preserving the cost competitiveness that keeps plastic the anchor substrate in the Middle East and Africa soft drinks packaging market.
Brand Shift Toward Tethered and Lightweight Caps
To anticipate EU Single-Use Plastics rules, multinationals now specify tethered closures for regional roll-outs. Crown’s 330 mL CrownSleek can embraces enhanced decoration while remaining compatible with lightweight cap assemblies. Filling OEMs and closure suppliers thus coordinate earlier in project cycles, opening consultancy and machinery upgrade revenue streams even before formal legislation arrives.
Restraints Impact Analysis of Middle East And Africa Soft Drinks Packaging Market*
| Restraint | (~) % Impact on CAGR Forecast | Geographic Relevance | Impact Timeline |
|---|---|---|---|
| Heightened EPR fees and potential plastic-tax roll-out in UAE and KSA | -0.9% | UAE primary, Saudi Arabia secondary, broader GCC adoption likely | Short term (≤ 2 years) |
| Chronic deficit in food-grade rPET collection infrastructure | -0.7% | Regional, with acute challenges in Africa | Long term (≥ 4 years) |
| Water-scarcity policies discouraging high-volume PET bottling licences | -0.5% | GCC core, North Africa secondary | Medium term (2-4 years) |
| Rising aluminium feedstock price volatility impacting can adoption | -0.4% | Global, with particular impact on cost-sensitive MEA markets | Short term (≤ 2 years) |
| Source: Mordor Intelligence | |||
Heightened EPR Fees and Potential Plastic-Tax Roll-out in UAE and KSA
Pilot EPR schemes in the UAE already lift compliance costs for high-volume segments such as bottled water. Legislators plan broader single-use plastic bans by 2026, sharpening price pressure on PET packaging. Saudi Arabia is evaluating comparable levies within its circular-economy roadmap, injecting uncertainty that could delay capital deployment or push brands toward aluminum and paperboard options. The Middle East and Africa soft drinks packaging market accordingly faces margin compression on legacy formats while sustainable alternatives gain traction.
Chronic Deficit in Food-Grade rPET Collection Infrastructure
Brand pledges to adopt recycled content to counter against scarce, food-grade rPET supply. Informal waste-picking networks dominate across many African cities, creating traceability gaps that preclude beverage-grade output.[3] Without a scale recycling backbone, converters must rely on virgin PET, limiting circularity progress and exposing the Middle East and Africa soft drinks packaging market to any surge in global resin prices.
*Our forecasts treat driver/restraint impacts as directional, not additive. The impact forecasts reflect baseline growth, mix effects, and variable interactions.
Middle East And Africa Soft Drinks Packaging Market Segment Analysis
By Primary Material Used:
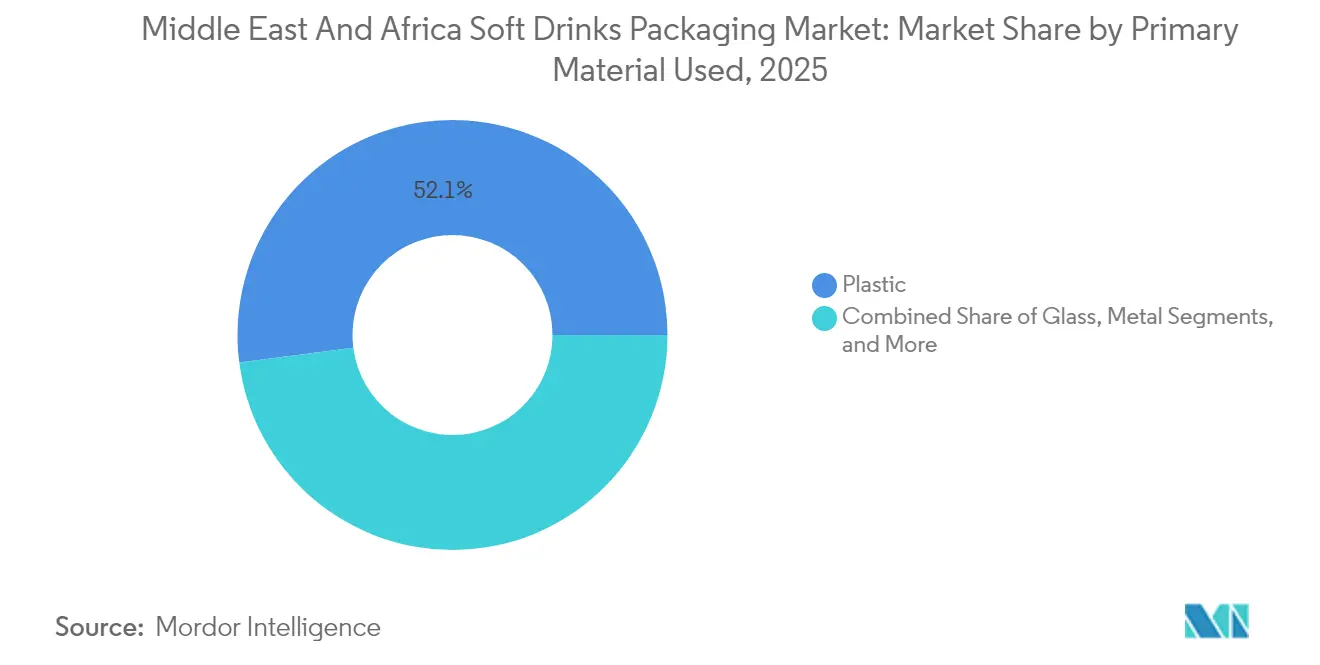
Plastic Dominance Faces Sustainable AlternativesPlastic retained a 52.05% share of the Middle East and Africa soft drinks packaging market in 2025, supported by abundant Gulf feedstocks and established PET blowing infrastructure. Favorable resin economics make PET the default for bottled water, carbonates, and sports drinks. However, paper and paperboard registered a 6.05% CAGR, accelerating on the back of plant-based beverage launches that leverage cartons’ extended shelf life and sustainable positioning.
Rising EPR fees and tethered-cap requirements push brand owners to diversify substrates, elevating carton suppliers as strategic partners. SIG’s Egyptian recycling pilot and Pulpac collaborations on paper closures exemplify innovation cycles aimed at lowering total environmental impact. Glass continues to serve premium juice and craft soda lines, whereas aluminum garners attention for energy drinks and premium waters. The material mix shift underscores how regulatory and consumer expectations reshape vendor roadmaps within the Middle East and Africa soft drinks packaging market.

By Packaging Format:
Bottles Lead While Cartons Gain MomentumBottles commanded 61.10% of 2025 revenues, anchored by the widespread PET base and familiarity among fillers and consumers. Large-scale lines such as Sidel’s 80,000-bph systems keep throughput high and unit costs low. Yet cartons and aseptic bricks grew fastest, clocking a 5.78% CAGR as dairy alternatives, probiotic drinks, and premium juices move into ambient-stable packs that signal sustainability.
SIG’s DomeMini bottle confirms how carton technology now targets traditionally plastic-dominated convenience occasions. Aluminum cans hold steady due to infinite recyclability, particularly for carbonates and energy drinks promoted through sports marketing. Pouches and sachets serve rural and price-sensitive shoppers, highlighting the divergent needs the Middle East and Africa soft drinks packaging market must satisfy across socio-economic tiers.
By Beverage Type:
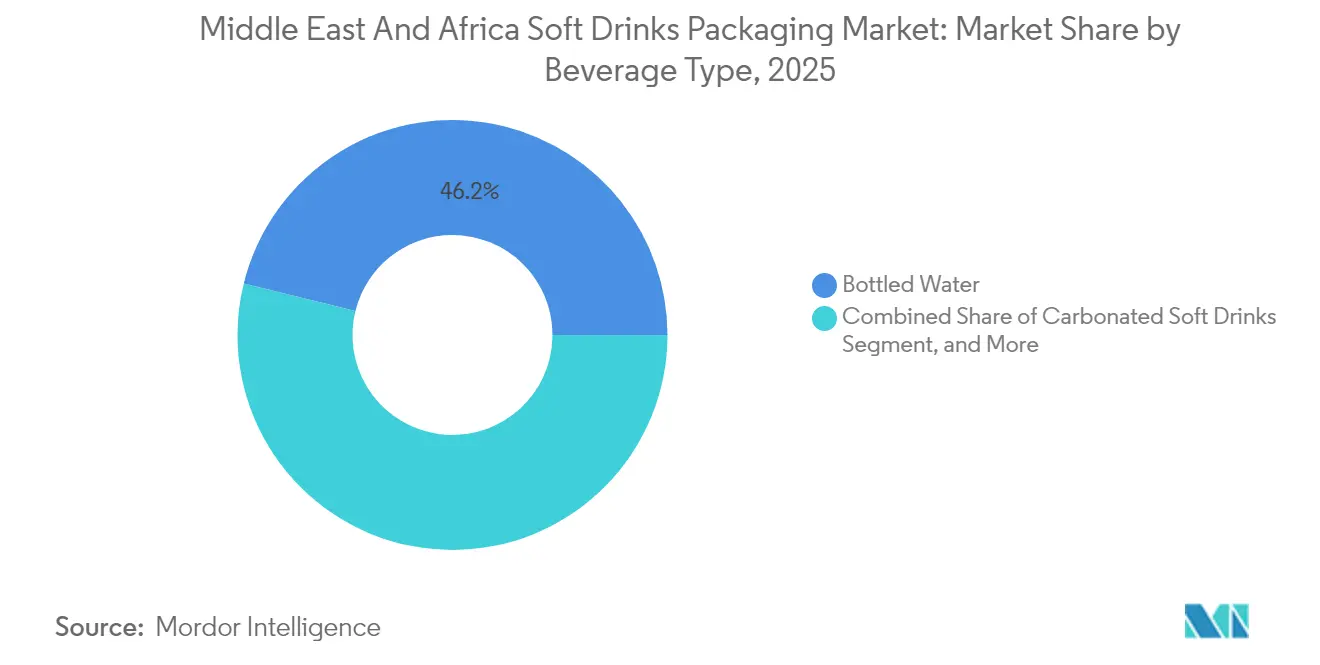
Bottled Water Dominates as RTD Categories AccelerateBottled water secured a 46.15% share of the Middle East and Africa soft drinks packaging market size in 2025, underpinned by water scarcity realities and desalination trust gaps. Premiumized functional variants further enhance package value density. Ready-to-drink tea and coffee delivered the quickest 5.95% CAGR as urban professionals seek flavor, caffeine, and convenience in one grab-and-go option.
Carbonated soft drinks stay prominent but face sugar-tax headwinds that redirect some budgets to low- and no-sugar RTD teas. Sports and energy drinks accelerate among fitness-focused youth, while juices straddle a premium–price tension amid fruit-cost inflation. Each sub-segment’s packaging demands orienting around barrier protection, shelf life, and branding real estate drive upstream investments in format flexibility across the Middle East and Africa soft drinks packaging market.
By Pack Capacity:
Mid-Size Formats Lead While Small Packs AccelerateThe 501-1000 mL range held 46.60% share in 2025, balancing multi-serve practicality and fridge fit. Family occasions and at-home consumption keep this size relevant across water and teas. Small packs of ≤330 mL, however, grew 5.55% CAGR as portion-controlled indulgence meets portability. Ball’s 330 mL can remains the archetypal carbonate pack, prized for distribution efficiency and merchandising density.
Intermediate 331-500 mL packs cater to personal hydration in gyms and offices, whereas large sizes above 1000 mL serve bulk buyers and cash-and-carry outlets. Capacity diversification shows how one beverage brand may require three or more pack sizes to satisfy divergent channel missions within the Middle East and Africa soft drinks packaging market.
Geography Analysis
Saudi Arabia Soft Drinks Packaging Market
Saudi Arabia captured a 34.80% share in 2025, propelled by Vision 2030 policies that blend localization incentives, youth-centric marketing, and capital access for fillers. Saudi Arabia anchors regional revenues through a combination of Vision 2030 industrialization, favorable demographics, and rising consumption of functional beverages. Localization grants spur investments in can lines and PET preform molding, deepening in-kingdom capabilities and shortening supplier lead times. The country’s regulatory dialogue on circular economy stimulates trials in tethered caps and higher recycled content, setting de facto standards that spill over to adjoining Gulf markets.
GCC Soft Drinks Packaging Market
The wider Gulf Cooperation Council benefits from high disposable income and chronic water scarcity, sustaining a robust bottled-water pipeline. The UAE’s impending single-use plastic restrictions, effective in 2026, act as a catalyst for aluminum and paperboard adoption. Kuwait and Qatar, though smaller, mirror sustainability mandates, nudging regional brand owners toward harmonized packaging portfolios across the Middle East and Africa soft drinks packaging market.
MEA Soft Drinks Packaging Market
Across Africa, South Africa’s enforced EPR since 2021 positions it as a regulatory bellwether. South Africa recorded the region’s fastest 5.86% CAGR as mandatory EPR raised awareness and bolstered recycling rates that justify premium formats. Rising middle-class purchasing power feeds demand for premium cartons and energy drinks, while established retail chains broaden distribution of convenience packs. Nigeria and Egypt, with large urban populations, promise volume but still wrestle with collection infrastructure deficits that restrain recycled substrate uptake. Cross-continental trade routes improve as Red Sea and East African ports modernize, allowing Middle Eastern polymer surplus to backfill African resin shortfalls and tightening MEA integration.
Regulatory Landscape
Packaging compliance across the Middle East and Africa is being shaped by the expansion of Extended Producer Responsibility (EPR) and tighter food-contact safety rules that increasingly reference recyclability and recycled-content controls. In Saudi Arabia, the Waste Management Law (Royal Decree D/3, 2021) and its executive regulation embed EPR obligations for packaging under Article 14. Market access also depends on meeting Saudi Standards, Metrology and Quality Organization (SASO) requirements for regulated products and on the conformity documentation for packaging used in food and beverages.
In the UAE, food-contact materials are governed through Ministerial Decision 20/2015. The Ministry of Industry and Advanced Technology (MoIAT) oversees the use of recycled plastics in sensitive applications, including rPET for water bottles, through conformity and approval pathways for recycling facilities, plus related migration-testing compliance. These frameworks, alongside South Africa’s enforced EPR since 2021 and Egypt’s move toward structured EPR implementation with material reporting and recyclability documentation, are increasing the importance of traceable inputs, especially food-grade rPET, and auditable supplier documentation for brand owners and converters serving soft drinks packaging demand.
Value Chain Analysis
The value chain starts upstream with feedstocks and resin production, notably Gulf hydrocarbon-to-polymer integration that supports PET economics. It then moves into material conversion into preforms, closures, labels, cartons, and can stock, followed by packaging manufacturing for bottles, cans, cartons/aseptic bricks, and pouches, and finally distribution to beverage fillers. Filling and packaging OEMs, including PET blowing providers, high-speed line suppliers, and aseptic filling specialists, sit at a critical midstream junction, since changeovers, lightweighting, and tethered-closure compatibility increasingly determine total packaging cost and compliance readiness for bottlers across GCC hubs and major African markets.
Downstream, EPR expansion and single-use restrictions are raising the strategic weight of collection, sorting, and recycling, particularly food-grade rPET. Constraints in traceability and recycling capacity create bottlenecks in many African countries. Supplier partnerships and localized capability upgrades are also showing up more often within the chain, such as CANPACK Middle East LLC formalizing a collaboration with Canovation in June 2026 to accelerate commercialization of re-sealable can technology. In parallel, regional metal packaging players like Nampak keep emphasizing aluminum and tinplate operations in markets such as South Africa and Angola, which is tightening integration between packaging suppliers, recyclers, and fillers as compliance requirements rise.
Competitive Landscape
Global incumbents maintain a balanced yet contested foothold. Ball Corporation streamlined its presence by selling a UAE joint venture stake but reinforcing Saudi assets, illustrating a portfolio pivot that retains exposure to the largest national market while trimming lower-return geographies. Crown Holdings completed a multi-year global can expansion, enabling MEA supply without large fresh capex and freeing funds for decorative and tethered-cap upgrades.[4]
M&A reshapes the supplier map. Sonoco’s USD 3.9 billion Eviosys buy enriches metal can depth, while Amcor’s planned USD 8.4 billion Berry Global acquisition would fuse rigid and flexible plastic expertise at scale. Both deals enhance end-to-end offerings, vital as brand owners seek fewer but broader suppliers. SIG’s carton bottle launch underscores a focus on convenience and on-the-go shifts, complemented by Egyptian recycling pilots that boost collection rates.
Technology competition centers on aseptic fillers, lightweighting, and digital decoration. OEMs that furnish modular changeovers and multi-substrate handling gain traction as beverage portfolios diversify. Regional converters such as Takween and Arabian Plastic Industrial Co. exploit proximity and cost advantages, partnering with European machine makers to bridge technology gaps. As EPR frameworks tighten, recyclers and rPET processors emerge as strategic assets, attracting private-equity interest and embedding circularity into the Middle East and Africa soft drinks packaging market’s value chain.
Middle East And Africa Soft Drinks Packaging Industry Leaders
-
Tetra Pak International SA
-
SIG Group AG
-
Amcor plc
-
Ball Corporation
-
Crown Holdings Inc.
- *Disclaimer: Major Players sorted in no particular order

Middle East And Africa Soft Drinks Packaging Market Companies Covered in this Report
- Tetra Pak International SA
- SIG Group AG
- Amcor plc
- Ball Corporation
- Crown Holdings Inc.
- ALPLA Werke Alwin Lehner GmbH and Co KG
- Plastipak Holdings Inc.
- Nampak Ltd.
- Takween Advanced Industries Co.
- Arabian Plastic Industrial Co. (Apico)
- GZI Industries Ltd.
- Huhtamaki Oyj
- Owens-Illinois Inc.
- Ardagh Metal Packaging S.A.
- Krones AG
- Sidel Group
- Mondi plc
- Greif Inc.
- Vetropack Holding AG
- AL-Jomaih Beverage Cans and Ends Co.
Read Analysis of Middle East And Africa Soft Drinks Packaging Companies
Market Opportunities and Future Outlook
Localization of packaging supply and investment in high-speed production lines remain a key whitespace across multiple subregions, supported by recent manufacturing moves in North Africa, East Africa, and the Gulf. In June 2026, Coca-Cola HBC inaugurated a USD 35 million PET bottle production line at its Amreya plant in Alexandria, Egypt (65,000 bottles per hour; 33 million cartons annually). This highlights demand for in-country packaging capability that reduces freight exposure and supports faster replenishment for bottled water and carbonates. In the UAE, Abu Dhabi Refreshment Company signed a lease for an AED 300 million facility in KEZAD (May 2026), further pointing to industrial zones as a source of beverage and packaging capacity that can feed modern retail and convenience channels.
Circularity infrastructure, especially food-grade rPET, is also a practical opportunity area because regulatory frameworks and brand commitments are moving ahead of collection and recycling capacity in many MEA markets. A concrete example is Indorama Ventures announcing in March 2026 a partnership with Nigerian Breweries and Genesis Power & Energy Solutions to build a 45,000-ton-per-annum food-grade rPET facility in Lagos, directly addressing a key bottleneck for PET packaging compliance and recycled-content availability. Aseptic and carton capability is another investment lane linked to category premiumization and shelf-life needs, illustrated by Asepto commissioning an advanced USD 126 million aseptic liquid packaging facility in Egypt (February 2026, designed for 12 billion packs annually), which supports growth in ambient-stable RTD and functional beverage formats where barrier performance and distribution reach are central.
Recent Industry Developments in Middle East And Africa Soft Drinks Packaging Market
- April 2026: Mediterrania Capital Partners signed a share purchase agreement to acquire 100% of Societe Marocaine des Manufactures de Mohammedia (the holding company of Amcor Flexibles Mohammedia) from Amcor Group. The transaction reshapes ownership of a key flexible packaging platform in Morocco, influencing local sourcing options for beverage brands and converters across North Africa.
- November 2025: SIG announced the sale of nine filling lines during Gulfood Manufacturing 2025 in Dubai. The deal volume highlights ongoing investment in filling and packaging line upgrades that support format diversification, including aseptic and convenience-led packs used across soft drink categories.
- September 2024: Tetra Pak released its inaugural Arabia Sustainability Report and cited a partnership with Union Paper Mills in the UAE to recycle 10,000 tons of carton waste annually. The program strengthens regional carton recycling pathways and raises the bar for circularity credentials demanded by beverage brand owners and retailers.
Middle East And Africa Soft Drinks Packaging Market Report Scope and Research Methodology
Market Definition and Coverage
This market covers the value of packaging used to contain and sell soft drinks across the Middle East and Africa, counted at the packaging level and reported in USD. We treat packaging as the pack formats and materials used for categories like bottled water and carbonated soft drinks.
Scope exclusions: We exclude soft drink liquid value, packaging machinery, and transport services, and we also exclude packaging used fully outside soft drink applications.
Segments Covered in This Report
- By Primary Material Used
- Plastic
- Paper and Paperboard
- Glass
- Metal
- Others
- By Packaging Format
- Bottles
- Cans
- Cartons / Aseptic Bricks
- Pouches and Sachets
- Others
- By Beverage Type
- Bottled Water
- Juices and Nectars
- Carbonated Soft Drinks
- Ready-to-Drink Tea and Coffee
- Sports and Energy Drinks
- Others
- By Pack Capacity
- ≤330 mL
- 331 – 500 mL
- 501 – 1 000 mL
- >1 000 mL
- By Region
- Middle East
- Saudi Arabia
- United Arab Emirates
- Qatar
- Rest of Middle East
- Africa
- South Africa
- Egypt
- Nigeria
- Rest of Africa
- Middle East
Data Sources, Market Sizing, and Validation
Desk Research
Desk research was used to set the factual base for the model, especially on soft drink output, packaging material context, and trade flows in the region. We leaned on public sources such as national statistics offices in key MEA countries, UN Comtrade for import and export signals, and FAO data where beverage related inputs were helpful for context.
To make the numbers usable for market sizing, we also reviewed sources such as packaging and beverage trade associations, government standards and environment agencies that publish packaging rules, and peer reviewed journals for material shifts and recyclability direction. Company annual reports, investor presentations, and reputable press were reviewed to understand capacity additions, format changes (like PET versus cans), and localized manufacturing plans. Those inputs then informed assumptions for the pack mix and intensity.
Where public reporting was thin, we referenced paid subscriptions for company financials and intelligence, shipment level trade checks, and patent databases to confirm the direction of material innovation. These examples are not exhaustive, and other public and paid sources were also used for data collection, validation, and clarification.
Primary Interviews and Surveys
Primary work was used to confirm what desk research cannot fully settle, like the real split of demand by pack type and the pace of price movement by material. We spoke with a mix of packaging converters, raw material distributors, beverage fillers, and retail channel stakeholders across MEA so we could check assumptions on volumes, pack mix, and procurement cycles, and correct them where needed.
Distribution of primary research fieldwork respondents
| Company type | Respondent position |
|---|---|
| Top tier: 36% | CXOs: 12% |
| Mid tier: 47% | Functional/Unit leaders: 28% |
| Smaller Players: 17% | Managers: 60% |
Market-Sizing & Forecasting
Market size was built using a top-down approach where regional soft drink consumption and production indicators are translated into packaging demand using pack mix and typical pack size patterns. Only after the demand pool was formed, we layered in packaging intensity assumptions by beverage type, followed by material and format shares, and then applied average pricing by material to convert volumes into value.
To keep the totals realistic, selective bottom-up approximations were used as cross-checks, such as sampling converter revenue exposure to soft drink packs, reviewing announced capacity additions, and doing simple ASP times volume checks for common packs like PET bottles and aluminum cans. Where country level data was missing, gaps were handled by using proxy indicators like population and urbanization, modern retail penetration, and beverage category shares discussed in interviews. We then normalized those signals back to regional totals.
For forecasting, we relied mainly on scenario analysis, since inflation, resin and aluminum price cycles, and deposit and recycling policy changes can shift outcomes quickly. Inputs tracked and projected include soft drink volume growth, pack mix shifts (PET versus cans versus cartons), lightweighting trends, recycled content requirements, and currency conversion timing for local pricing into USD. Assumptions were reviewed with industry respondents so the forecast stayed practical rather than purely trend-fitted.
Data Validation & Update Cycle
Validation is done by comparing outputs against independent signals such as trade flows for key packaging materials, public capacity and investment announcements, and consistency checks versus beverage consumption direction. When a country level result looks off, we recheck the drivers first, then trigger follow-up calls to confirm whether the issue is pack mix, pricing, or a reporting timing mismatch.
Before sign-off, the model goes through multi-step analyst review so calculation logic, unit conversions, and assumptions remain consistent across countries and formats. The report is refreshed annually, and interim updates are made when material events occur, like major tax changes, sharp resin moves, or new packaging mandates. Right before delivery, a fresh review pass is completed so clients receive the latest updated view.
Mordor Intelligence's Middle East and Africa Soft Drinks Packaging Market Size Versus Other Published Estimates
Published market sizes for MEA soft drinks packaging often do not match because the scope line is drawn differently, and pricing and currency handling can also shift the value. Differences also come from the base year chosen, and whether the estimate is anchored on beverage demand signals or on broad packaging revenue pools.
The main gap comes from counting wider beverage packaging or even non-soft drink end uses, where Mordor Intelligence keeps the model tied to soft drink packs and converts volumes to value using material-wise pricing and pack mix checks validated through regional interviews.
Benchmark comparison
| Source | Market Size | Gaps in Research Methodology |
|---|---|---|
| Mordor Intelligence | USD 12.07 B (2025) | |
| Global Consultancy A | USD 13.80 B (2024) | Uses a different base year and can reflect a broader packaging scope with less transparency on pack mix and material-wise ASP progression, which can lift the reported value when generalized pricing is applied. |
| Industry Publisher B | USD 15.12 B (2024) | Covers beverage packaging more broadly, which can include categories beyond soft drinks, and the value can rise further when application splits are not tightly reconciled back to soft drink volume indicators. |
Looking at the spread, the higher figures align with broader beverage packaging coverage and different base-year choices, which naturally change the USD total. Our approach stays traceable because the value is built from demand indicators, pack mix, and material pricing that can be reviewed and repeated when assumptions need updating.
Key Questions Answered in the Report
How large is the Middle East and Africa soft drinks packaging market today?
In 2026 the market stands at USD 12.63 billion and is tracking toward USD 15.81 billion by 2031.
Which material leads beverage packaging across the region?
Plastic—including PET bottles—held 52.05% share in 2025, though cartons are growing fastest at a 6.05% CAGR.
Why is Saudi Arabia pivotal for suppliers?
The kingdom commands 34.80% of regional value, fueled by Vision 2030 incentives that localize can and PET production.
What is driving demand for small packs?
Urban lifestyles and convenience retail boost ≤330 mL formats, which are expanding at a 5.55% CAGR.
How are sustainability rules reshaping packaging choices?
EPR fees and upcoming single-use bans in the Gulf accelerate shifts toward aluminum, paperboard, and tethered-cap solutions.
Which beverage category is growing quickest?
Ready-to-drink tea and coffee leads with a 5.95% CAGR, supported by aseptic filling and changing consumer routines.