
Market Overview
| Study Period | 2020 - 2031 |
|---|---|
| Forecast Data Period | 2026 - 2031 |
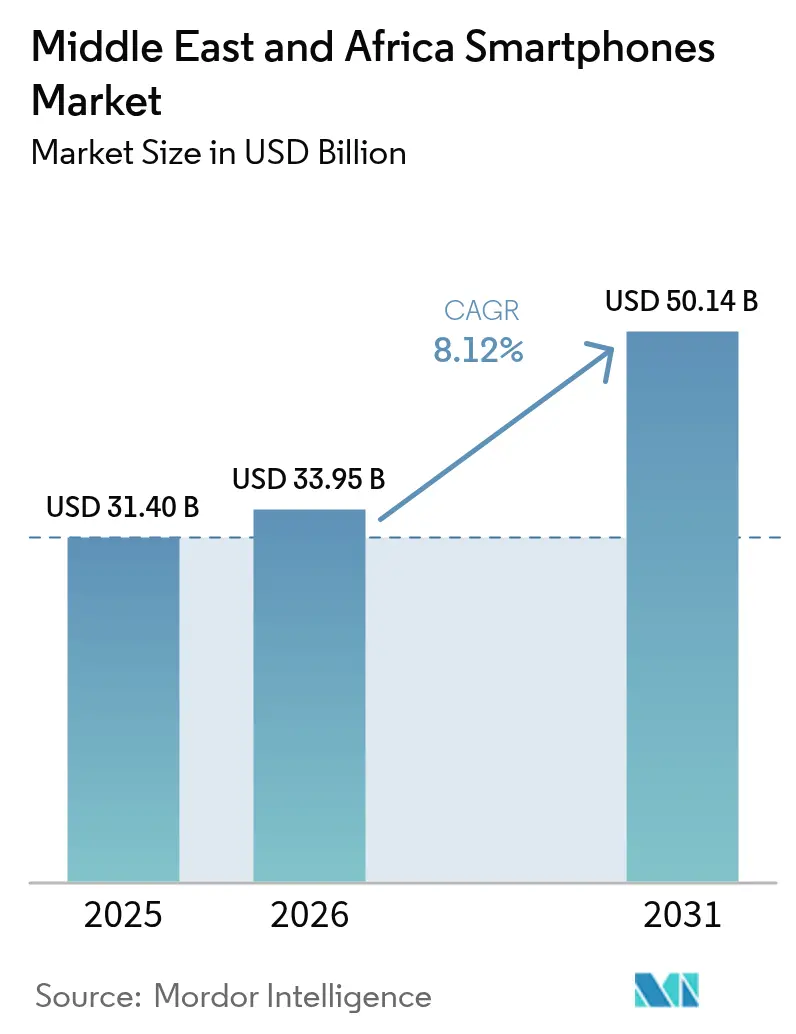
| Base Year Market Size (2025) | USD 31.40 Billion |
| Market Size (2026) | USD 33.95 Billion |
| Market Size (2031) | USD 50.14 Billion |
| Growth Rate (2026 - 2031) | 8.12 % |
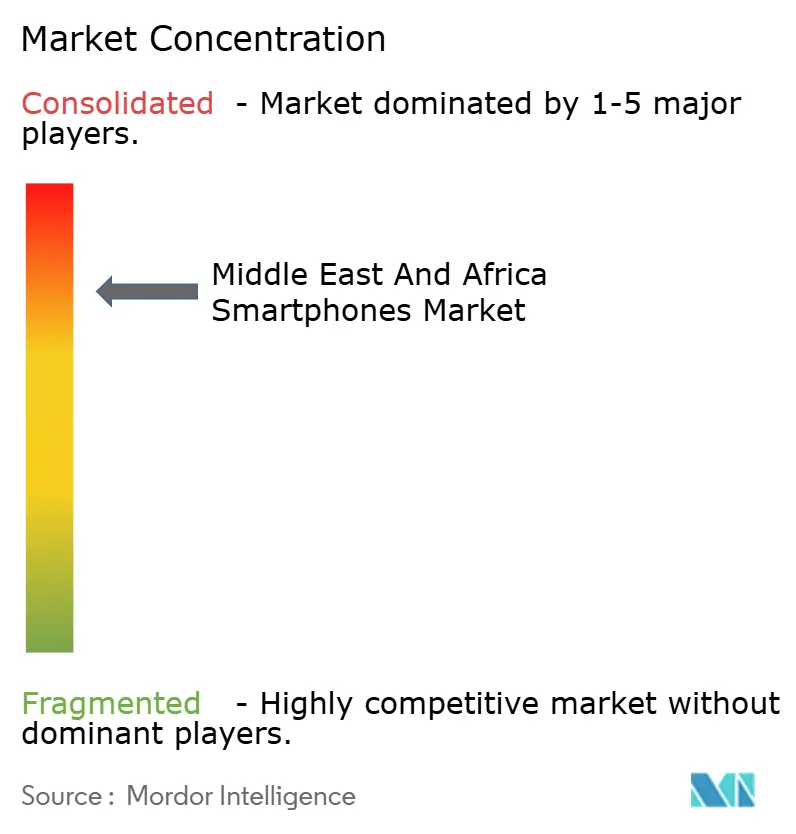
| Market Concentration | High |
Major Players *Disclaimer: Major Players sorted in no particular order Image © Mordor Intelligence. Reuse requires attribution under CC BY 4.0. | |
Middle East And Africa Smartphones Market Analysis by Mordor Intelligence
The Middle East and Africa smartphones market size is expected to grow from USD 31.40 billion in 2025 to USD 33.95 billion in 2026 and is forecast to reach USD 50.14 billion by 2031 at 8.12% CAGR over 2026-2031. This swift expansion stems from sovereign digital agendas across the Gulf Cooperation Council (GCC) and a demographic dividend in Sub-Saharan Africa that together elevate smartphones from communication tools to foundational access points for e-government, mobile finance, and social commerce. Saudi Arabia’s Vision 2030 super-app ecosystem, high-velocity 5G roll-outs, and rising average selling prices in the Gulf are steering premium device upgrades, while ultra-low-cost Chinese original equipment manufacturer (OEM) strategies extend first-time ownership deep into rural Africa. At the same time, Buy-Now-Pay-Later (BNPL) models, broader e-commerce adoption, and localized manufacturing help counter foreign-exchange (FX) volatility and tariff shocks, sustaining supply security and price discipline. Competitive intensity has sharpened as tier-one global brands defend share against region-born champions and value-focused Chinese disruptors, yet localized innovation and integrated service ecosystems are proving more decisive than sheer hardware specifications.
Key Report Takeaways
- By operating system, Android controlled 87.78% of Middle East and Africa smartphones market share in 2025 and is expanding at an 11.06% CAGR through 2031, underscoring entrenched platform consolidation.
- By price range, the budget segment captured 37.02% of the Middle East and Africa smartphones market size in 2025, whereas premium devices posted the fastest growth at 9.58% CAGR.
- By distribution channel, offline retail led with 59.92% revenue share in 2025 in the Middle East and Africa smartphones market; online retail is advancing at a 10.21% CAGR to 2031.
- By technology, 4G/LTE held 67.85% share in 2025 while 5G recorded the highest projected CAGR at 10.37% through 2031 in the Middle East and Africa smartphones market.
- By country, Saudi Arabia accounted for 19.21% share of the Middle East and Africa smartphones market in 2025 and is progressing at a 9.18% CAGR to 2031.
Note: Market size and forecast figures in this report are generated using Mordor Intelligence’s proprietary estimation framework, updated with the latest available data and insights as of 2026.
Market Trends and Insights
Drivers Impact Analysis of Middle East And Africa Smartphones Market*
| Driver | (~) % Impact on CAGR Forecast | Geographic Relevance | Impact Timeline |
|---|---|---|---|
| Rapid 5G roll-outs across GCC operators | +2.1% | GCC core, spill-over to North Africa | Medium term (2-4 years) |
| Youth-driven first-time adoption | +1.8% | Sub-Saharan Africa rural and peri-urban | Long term (≥ 4 years) |
| Ultra-low-cost Chinese OEM proliferation | +1.5% | Africa-wide, selective Middle East | Short term (≤ 2 years) |
| E-commerce and social-commerce momentum | +1.2% | Mobile-first urban centers | Medium term (2-4 years) |
| National e-ID / super-app programs | +1.0% | GCC leadership, gradual MEA uptake | Long term (≥ 4 years) |
| BNPL financing widening affordability | +0.9% | Kenya, Nigeria, South Africa urban clusters | Short term (≤ 2 years) |
| Source: Mordor Intelligence | |||
Rapid 5G roll-outs across GCC operators
GCC carriers view 5G as an economic catalyst rather than a routine network refresh, linking smartphones to smart-city services, fixed-wireless access, and enterprise Internet of Things (IoT) applications. Saudi Arabia alone expects 5G to inject USD 18 billion into its economy by 2030.[1] Operator investments by stc, Zain, and e& already support 54.70% population coverage, prompting demand for premium-capable devices and driving higher average selling prices.
Youth-driven first-time smartphone adoption in Sub-Saharan Africa
Africa’s median age of 19.7 fuels a surge of first-time owners who leapfrog feature phones and access mobile internet services straight through affordable handsets. TRANSSION’s market-leading 47% share results from devices optimized for multi-language support and darker skin-tone photography. Asset-financing models in Kenya lifted penetration to 68.3%, illustrating the structural nature of this demand.
E-commerce and social-commerce channels accelerating device sales
Mobile-first platforms convert browsing into purchases through in-app payments, shortening the sales funnel and unlocking underserved segments. Social commerce in emerging markets is forecast to top USD 720 billion, with Middle East uptake propelled by high smartphone usage and low credit-card penetration.[2]
National e-ID / super-app programs (e.g., Saudi Vision 2030)
Apps such as Nafath have logged 17.2 million downloads and 1.6 billion sign-on requests, anchoring government services to smartphone authentication and deepening device indispensability. These initiatives elevate switching costs and reinforce ongoing replacement cycles.
Restraints Impact Analysis of Middle East And Africa Smartphones Market*
| Restraint | (~) % Impact on CAGR Forecast | Geographic Relevance | Impact Timeline |
|---|---|---|---|
| FX volatility and import tariffs | -1.4% | Import-dependent economies | Short term (≤ 2 years) |
| Grey-market and counterfeit inflows | -1.1% | Africa-wide, limited Middle East exposure | Medium term (2-4 years) |
| Emerging data-localization and OTT rules | -0.8% | Regulation-active jurisdictions | Long term (≥ 4 years) |
| Power-supply unreliability in rural areas | -0.7% | Electrification-challenged Sub-Saharan regions | Long term (≥ 4 years) |
| Source: Mordor Intelligence | |||
FX volatility and import tariffs inflating ASPs
Currency depreciation and import duties raise device prices, constraining discretionary spending. Egypt’s 38.5% smartphone import tax initially lowered shipments, pushing OEMs toward local assembly to sidestep tariffs.[3] Manufacturers that dual-source components locally are best positioned to absorb price shocks.
Grey-market and counterfeit handset inflows
Counterfeits account for a signficiant portion of African sales, eroding legitimate revenues and exposing consumers to safety risks. Device registration and IMEI whitelisting, already in effect in Egypt, signal a regulatory shift toward clamping down on illicit channels.
*Our forecasts treat driver/restraint impacts as directional, not additive. The impact forecasts reflect baseline growth, mix effects, and variable interactions.
Middle East And Africa Smartphones Market Segment Analysis
By Operating System:
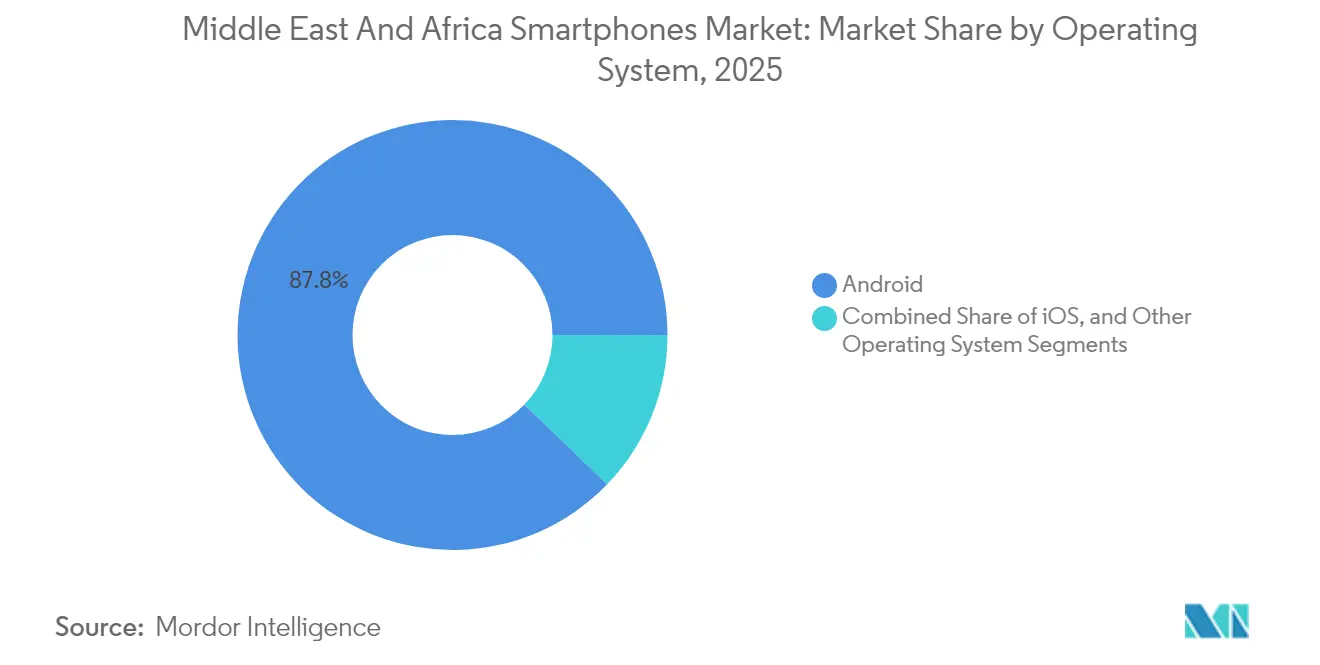
Android Ecosystem DominanceAndroid led the market with an 87.78% share in 2025 and is projected to register an 11.06% CAGR, reflecting the platform’s alignment with local price sensitivities and service ecosystems. This leadership reinforces the Middle East and Africa smartphones market as an Android-centric environment where open-source flexibility lowers development cost for apps in mobile banking, ride-hailing, and telemedicine. Chinese OEMs leverage Android’s customization layers to embed regional language packs and camera algorithms tailored to darker skin tones, which enhance consumer experience and loyalty. The platform’s synergy with near-field communication (NFC) standards propels digital-wallet adoption in Saudi Arabia, where Nafath’s 17.2 million users log daily transactions via biometric authentication.
The strategic edge expands beyond hardware as service bundling locks users deeper into cloud storage, payment, and identity ecosystems. Developers favor Android’s broader install base to reach scale quickly, while governments adopt Android-first approaches for national ID, tax, and health-record apps. Although iOS retains cachet in ultra-premium brackets, its niche presence does little to erode Android’s network effects. Over the forecast horizon, the Middle East and Africa smartphones market size tied to Android devices is expected to widen further as 5G coverage becomes near-ubiquitous in the Gulf and as Sub-Saharan operators sunset 2G networks.

By Price Range:
Budget Dominance Amid Premium GrowthBudget devices between USD 151 and USD 299 held 37.02% share in 2025, underscoring the income realities of mass-market buyers, yet premium smartphones priced USD 600-799 are on track for 9.58% CAGR growth. The bifurcation arises from parallel consumer bases: first-time rural owners and urban digital-service power users. Budget units capitalize on subsidy programs and BNPL schemes that spread repayments across micro-instalments. In contrast, affluent Gulf consumers upgrade to premium SKUs to harness 5G, augmented-reality (AR) features, and onboard AI accelerators.
Financing innovations blur these categories as operators in Kenya and Nigeria market premium devices through pay-as-you-go contracts. Transparent installment models enable mid-income earners to aspire to higher tiers without upfront cash, thereby enlarging the Middle East and Africa smartphones market size for premium devices. The challenge for OEMs lies in balancing feature proliferation with cost control to prevent cannibalization of mid-range models.
By Distribution Channel:
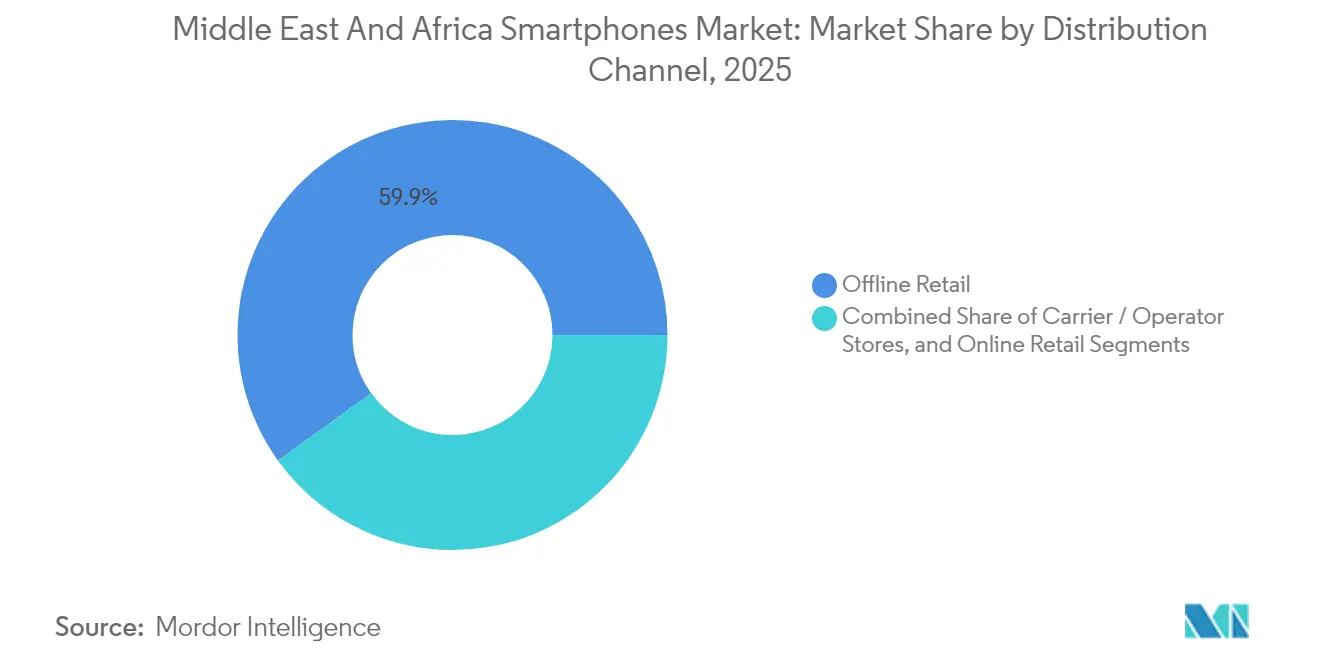
Digital Transformation AcceleratingOffline retail maintained a 59.92% share in 2025 because tactile inspection and immediate fulfillment still influence purchasing decisions. Yet online retail is scaling at 10.21% CAGR as logistics networks mature and last-mile costs decline. Post pandemic legacy of contactless commerce persists, driving consumer comfort with app-based transactions. Operators’ own portals contribute additional momentum through bundle offers that integrate data plans and content subscriptions.
Social-commerce ecosystems illustrate hybrid evolution: influencers run live device reviews while integrated payment links close the sale instantly. Distributors engage in omnichannel tactics whereby inventory visibility spans physical stores and online carts, letting shoppers reserve and collect locally. This synergy reduces stock-outs and aligns marketing spend closer to conversion events, heightening operational efficiency across the Middle East and Africa smartphones market.
By Technology:
5G Transition Momentum4G/LTE commanded 67.85% share in 2025, but 5G is scaling at a forecast 10.37% CAGR, elevating the performance baseline for smartphones. Gulf networks already cover three-quarters of their populations, and trials of 5.5G promise data rates exceeding 10 Gbps. Device makers now ship entry-level 5G chipsets below USD 200, accelerating democratization. In Africa, 5G rollout proceeds in metropolitan zones, yet 4G remains the workhorse for rural voice and data. Strategic timing of 5G handset launches hinges on tariff affordability and content partnerships that showcase tangible benefits such as ultra-high-definition streaming and cloud gaming.
As operators phase out 3G, spectrum refarming frees up frequencies for 4G and 5G expansion. This shift lowers network cost per bit delivered, facilitating wider geographic coverage without proportional capital-expenditure hikes. Together, these trends reinforce the Middle East and Africa smartphones market share gains for 5G-capable models, especially in urban clusters.
Geography Analysis
Saudi Arabia Smartphones Market
Saudi Arabia anchors regional value, combining a 19.21% market share in 2025 with Vision 2030 programs that migrate authentication, healthcare, and public services onto mobile platforms. Absher’s 94% adult wallet uptake and stc’s wide 5G footprint forge an ecosystem in which smartphones serve as gateways to banking, traffic management, and digital identity. Premium-device demand intensifies as users seek seamless performance across these always-on services.
North Africa Smartphones Market
North Africa exhibits divergent patterns. Egypt’s whitelisting regulations curtailed grey imports and spurred OEMs to localize assembly, which insulates supply from FX shocks and supports aggressive pricing. Vivo’s plant in the 10th of Ramadan City adds 500,000 units monthly and 1,500 jobs, reinforcing Egypt’s ambition to triple annual output to 9 million units by 2026. Algeria and Morocco pursue similar localization to lessen current-account deficits while imposing stricter safety labels that elevate consumer confidence.
Sub-Saharan Africa Smartphones Market
Sub-Saharan Africa remains the volume frontier where youth bulges, mobile-money ubiquity, and improving power grids converge. Research shows households with electricity access present significantly higher penetration, especially among women, underscoring infrastructure’s social dividends. TRANSSION dominates sales through deep rural distribution and culturally attuned user interfaces, while Xiaomi and Samsung target urban professionals with mid-range 5G models. Power-bank bundles and solar-charging kits mitigate off-grid limitations, ensuring sustained device usage despite patchy grid coverage.
Regulatory Landscape
Spectrum policy is a primary regulatory lever shaping smartphone addressability in the region, because multi-year spectrum roadmaps and refarming decisions influence 4G/5G device eligibility and operator rollout cadence. In March 2026, Egypts NTRA approved the Mobile Spectrum Roadmap 2026-2030, which includes 410 MHz of new frequencies across the 1800 MHz, 2600 MHz, and 3500 MHz bands, following an October 2025 shift toward a proactive five-year spectrum management model. Nigeria reinforced a similar planning approach with the NCCs Spectrum Roadmap for the Communications Sector 2026 to 2030, while South Africas Parliament tabled the Electronic Communications Amendment Bill, 2026 (B12-2026) to address topics such as roaming and MVNOs, shaping distribution and bundling pathways for smartphones via operator and virtual-operator channels.
Device-market formalization is also tightening through measures that target illicit supply and strengthen consumer protection in digital services tied to smartphones. Kenya updated its telecommunications market structure in January 2026 with tiered licensing for Network Facilities Providers, supporting wholesale and shared-infrastructure models that can accelerate coverage and indirectly expand the installed base of 4G/5G-capable handsets. Content and safety rules are moving closer to smartphone identity and age assurance, including a July 2026 UAE TDRA-linked cabinet resolution that bans under-15s from social media with a 12-month compliance window for technology companies, and Egypts MCIT launching Etmaen child-safe mobile internet services in July 2026 aligned with ITU standards. Regulators are also upgrading oversight tooling, exemplified by Chads ARCEP inaugurating digital monitoring platforms in June 2026 for real-time traffic and network-performance supervision, reinforcing quality-of-service requirements that raise the premium on certified devices and compliant distribution.
Value Chain Analysis
The MEA smartphone value chain remains import-heavy at the component and finished-device level, with OEM sourcing (chipsets, memory, displays, batteries), assembly (global factories plus rising regional SKD/CKD operations), certification, and multi-channel distribution (operator channels, offline retail, and online marketplaces) determining availability and pricing. Local assembly is strengthening as a resilience lever against FX volatility and import-duty shocks highlighted in the report context, with manufacturing footprints expanding beyond Egypt into Sub-Saharan hubs. In June 2026, Safaricom reported its EADAK assembly plant in Kenya produced 700,000 devices in its first year of operation and has an annual capacity of 3 million units, creating an in-region pathway for entry and mid-tier supply that can shorten lead times and support operator-led affordability programs.
Logistics and certification are key friction points across the chain, particularly for 5G models where carrier acceptance testing can take 8 to 16 weeks per model, affecting launch synchronization with operator network rollouts and promotional windows. Shipping volatility adds cost and timing risk: Red Sea disruption-driven rerouting via the Cape of Good Hope has been associated with 10 to 15 additional transit days and higher inventory carrying costs, reinforcing the role of regional distribution hubs and buffer inventory strategies. Market signals from Q1 2026 also show divergence across the chain, with overall MEA shipments down 7% year-over-year while 5G-enabled shipments increased 42% year-over-year, pushing OEMs and distributors toward higher-spec portfolios and financing bundles while managing bill-of-materials pressures that squeeze entry-tier economics.
Competitive Landscape
Competitive intensity in the Middle East and Africa smartphones market follows a three-tier hierarchy. TRANSSION heads Tier 1 with a 47% Africa share, capitalizing on price-sensitive niches and localized features that elevate user experience beyond mere affordability. Samsung occupies the premium end, leveraging brand equity, robust after-sales, and aspirational marketing to preserve a 21% regional share. Xiaomi, OPPO, and HONOR spearhead Tier 2 challengers armed with rapid product cycles and aggressive mid-range pricing; HONOR reported a 283% surge in Q1 2025 shipments, illustrating the acceleration potential of brand reinvention strategies.
Tier 3 comprises emerging GCC-based assemblers and refurbished-device suppliers clustering around Dubai’s logistics hub. The refurbished segment gains traction as inflation nudges price-conscious buyers toward certified pre-owned devices, extending handset life spans and compressing replacement cycles. Strategic differentiation is now defined more by ecosystem alignment-payments, identity, cloud storage-than by megapixel counts or chipset speeds.
OEMs shore up resilience through vertical integration. Vivo’s Egyptian factory and TRANSSION’s Ethiopian plant localize value chains, hedging against shipping disruptions and tariff shifts. Partnerships between handset brands and content platforms (e.g., Beyond ONE with TIMWETECH) embed subscription services into operator billing flows, fostering stickier revenue streams and deepening market entrenchment.
Middle East And Africa Smartphones Industry Leaders
-
Xiaomi Corporation
-
Samsung Electronics Co., Ltd.
-
Huawei Technologies Co., Ltd.
-
Infinix Mobility Limited
-
Oppo Guangdong Mobile Communications Co., Ltd.
- *Disclaimer: Major Players sorted in no particular order
Middle East And Africa Smartphones Market Companies Covered in this Report
- Samsung Electronics Co., Ltd.
- Transsion Holdings Limited
- Xiaomi Corporation
- Oppo Guangdong Mobile Communications Co., Ltd.
- Apple Inc.
- Vivo Communication Technology Co., Ltd.
- Huawei Technologies Co., Ltd.
- HMD Global Oy (Nokia)
- Google LLC
- ZTE Corporation
- Lenovo Group Limited
- Realme Chongqing Mobile Telecommunications Corp., Ltd.
- OnePlus Technology (Shenzhen) Co., Ltd.
- Honor Device Co., Ltd.
- Tecno Mobile Limited
- itel Mobile Limited
- Infinix Mobility Limited
- Motorola Mobility LLC
- TCL Technology Group Corporation (Alcatel brand)
- Sony Corporation
- Asustek Computer Inc.
- Lava International Limited
- Gionee Communication Equipment Co., Ltd.
Read Analysis of Middle East And Africa Smartphones Companies
Market Opportunities and Future Outlook
Network build-out and modernization programs across MEA create whitespace for broader 5G-capable portfolios, operator bundles, and app ecosystem partnerships that link smartphones more tightly to identity, payments, and public services. In June 2026, GSMA reported African mobile operators are planning USD 76 billion in network capital expenditure through 2030, and Orange introduced its Trust the Future plan in April 2026, committing over EUR 5 billion across Africa and the Middle East during 2026-2028 to expand network coverage. These commitments support opportunities for OEM-operator co-marketing of 5G devices, upgrade programs that pair smartphones with higher-value data plans, and enterprise mobility propositions where device procurement is tied to managed connectivity and security.
Affordability and supply resilience remain the largest execution constraints, but they also define actionable opportunity areas in financing, localized assembly, and certified-channel expansion that reduces grey-market leakage. The report context already points to localization momentum in Egypt (including Vivo capacity referenced in the geography analysis) and rising use of BNPL and pay-as-you-go structures in Africa, while recent market monitoring cited in the evidence pack links Q1 2026 shipment pressure to memory and component costs. This environment favors OEMs that combine local assembly (to manage tariffs and FX exposure) with structured consumer financing and trade-in programs, and it expands the addressable market for certified refurbished devices in inflation-sensitive segments. Regulatory moves that reinforce long-horizon spectrum planning (for example, Egypts 2026-2030 roadmap and Nigerias 2026-2030 roadmap) also create clearer guardrails for portfolio planning around band support and certification, enabling more consistent device roadmaps across GCC and key African markets.
Recent Industry Developments in Middle East And Africa Smartphones Market
- July 2026: Huawei launched the Pura 90s series in the United Arab Emirates, highlighting 5G connectivity and bundling services such as Huawei Care+ to strengthen the value proposition. The launch underscores renewed competitive pressure in 5G-capable Android devices in a premium-leaning Gulf market where operators are expanding high-speed coverage.
- July 2025: Egypt announced plans to scale local smartphone production capacity to 9 million units annually by 2026, supported by multiple global OEM manufacturing investments. The push adds an industrial-policy tailwind for regional assembly that can reduce exposure to FX swings and import-duty cost shocks affecting retail affordability.
- May 2024: Leading GCC operators continued expanding 5G coverage and service bundling programs around consumer mobility, reinforcing smartphones as the primary access layer for digital-government and commerce use cases. The momentum in operator roll-outs supported a larger addressable base for 5G-ready devices and accelerated portfolio refresh cycles among OEMs competing for upgrade demand.
Middle East And Africa Smartphones Market Report Scope and Research Methodology
Market Definition and Coverage
For this study, the market includes the value of smartphones sold and used by end users across the Middle East and Africa, measured in USD for the selected years. The scope focuses on mainstream consumer smartphones across major countries in the region and captures device value rather than service revenues.
Scope exclusions: Rugged and industrial smartphones are excluded from the market totals.
Segments Covered in This Report
- By Operating System
- Android
- iOS
- Other Operating Systems
- By Price Range
- Ultra-Premium (Above USD 800)
- Premium (USD 600-799)
- Mid-range (USD 300-599)
- Budget (USD 151-299)
- Ultra-Budget (Less Than or Equal USD 150)
- By Distribution Channel
- Online Retail
- Carrier / Operator Stores
- Offline Retail
- By Technology (Connectivity)
- 5G
- 4G / LTE
- 3G and Below
- By Country
- Saudi Arabia
- United Arab Emirates
- South Africa
- Egypt
- Nigeria
- Turkey
- Rest of Middle East and Africa
Data Sources, Market Sizing, and Validation
Desk Research
Desk work started with building a clean regional fact base on smartphone demand and supply signals, then aligning it with the country coverage used in the report. We relied on public sources such as ITU connectivity indicators, national statistics portals for population and household metrics, UN Comtrade trade flows for handset-related categories, and World Bank macro series that help frame affordability cycles and currency moves.
To keep the model grounded in observable market activity, we also reviewed company filings and investor presentations where available, along with regulator and telecom authority publications. We supplemented these with reputable press coverage on 4G and 5G rollout timelines and device import changes. In a few cases, we used paid subscriptions for company financials and news screening, and another paid dataset for shipment and import-export checks at a directional level. These examples are not exhaustive, and we referenced additional public and paid sources to collect, validate, and clarify data points.
Primary Interviews and Surveys
Primary work was used to pressure test the desk assumptions and to fill gaps that are difficult to see in published tables, including typical channel margins, the timing of promotions, and mix shifts across entry, mid, and premium models. We spoke with stakeholders across importers and distributors, retail and e-commerce participants, and telecom-linked device programs, then completed country level checks across key Middle East and African markets to confirm adoption and price trends.
Distribution of primary research fieldwork respondents
| Company type | Respondent position |
|---|---|
| Top tier: 29% | CXOs: 15% |
| Mid tier: 55% | Functional/Unit leaders: 30% |
| Smaller Players: 16% | Managers: 55% |
Market-Sizing & Forecasting
The core sizing starts with a top-down build where country demand pools are reconstructed using smartphone shipment and replacement patterns, followed by an applied average selling price (ASP) that reflects local mix and currency reality. After forming the totals, we corroborated them with selective bottom-up approximations, such as distributor channel checks and sampled ASP-to-volume calculations for key countries, then adjusted only when the gap was explainable.
Inputs that matter in this market include annual smartphone shipment direction, replacement cycle behavior, the split between 4G and 5G models, price-band mix movements, and exchange-rate driven price pass-through, since these can change USD value even when unit demand is steady. For forecasting, scenario analysis was used so alternative paths for inflation, consumer spending, and network rollout pacing could be captured, and the preferred path was aligned to what interviewees described as realistic for the next few years. Where country level data was thin, we used peer-country proxies and then normalized the result using region-level signals before finalizing.
Data Validation & Update Cycle
Outputs were cross-checked against independent indicators such as import and trade direction, public connectivity growth, and reported shipment trends to confirm that the trajectory looked plausible. When the model produced unusual spikes, the drivers were reviewed again country by country. Assumptions such as ASP steps, currency conversion points, and mix shifts were also rechecked before sign-off.
Reports refresh annually, with interim updates when material events occur, such as a sharp currency move, a major tax or duty change, or a visible demand shock. Before delivery, we run a final freshness pass so clients get the latest view based on the most recent public signals and expert input.
Mordor Intelligence's Middle East and Africa Smartphones Market Size Measured Against Other Published Estimates
Published market sizes for MEA smartphones often differ because authors choose different boundaries for what counts as a smartphone sale, and they handle currency conversion and pricing changes in different ways. In this region, even small shifts in exchange rates and model mix can move USD value quickly, so timing choices can be a deciding factor.
Key gaps typically come from whether estimates include rugged or enterprise devices, whether value is built from units times an ASP that is updated by quarter or kept flat, and whether country totals are validated with channel feedback when official data is delayed. By refreshing ASP assumptions close to the base year and applying currency timing consistently, followed by distributor and retailer validation checks, Mordor Intelligence reduces overstatement risk during volatile pricing cycles.
Benchmark comparison
| Source | Market Size | Gaps in Research Methodology |
|---|---|---|
| Mordor Intelligence | USD 31.40 B (2025) | |
| Regional Consultancy A | USD 35.52 B (2026) | Uses an estimated-year value and can blend a broader device set or optimistic unit growth assumptions, and the USD conversion timing is not always clear when local currencies are moving. |
| Trade Publisher B | USD 71.76 B (2025) | Appears to apply higher ASP levels across the region, which can happen when premium-heavy country mixes and retail sticker prices are used without normalizing for channel discounts and entry-model volumes. |
The spread mainly reflects how pricing and currency are treated, and whether adjacent device categories are quietly included. With clear exclusions and a repeatable units-and-ASP build that is checked with market participants, the final value stays traceable to practical demand and price drivers.
Key Questions Answered in the Report
What is the current value of the Middle East and Africa smartphones market?
The market is valued at USD 33.95 billion in 2026.
How fast is the market expected to grow through 2031?
It is projected to advance at a 8.12% CAGR over 2026-2031, reaching USD 50.14 billion.
Why is Saudi Arabia a pivotal growth engine?
Vision 2030 e-government platforms, extensive 5G coverage, and high disposable income drive premium upgrades.
What factors restrain smartphone adoption in rural Africa?
FX volatility, power-supply gaps, and counterfeit influxes hamper penetration.
How are OEMs mitigating tariff and currency risks?
By localizing assembly in countries such as Egypt and Ethiopia to reduce import costs and stabilize pricing.