
Market Overview
| Study Period | 2020 - 2031 |
|---|---|
| Forecast Data Period | 2026 - 2031 |
| Base Year Market Size (2025) | USD 25.42 Billion |
| Market Size (2026) | USD 27.61 Billion |
| Market Size (2031) | USD 41.76 Billion |
| Growth Rate (2026 - 2031) | 8.62% CAGR |
| Market Concentration | Medium |
Major Players *Disclaimer: Major Players sorted in no particular order Image © Mordor Intelligence. Reuse requires attribution under CC BY 4.0. | |
Middle East And Africa Smart Meters Market Analysis by Mordor Intelligence
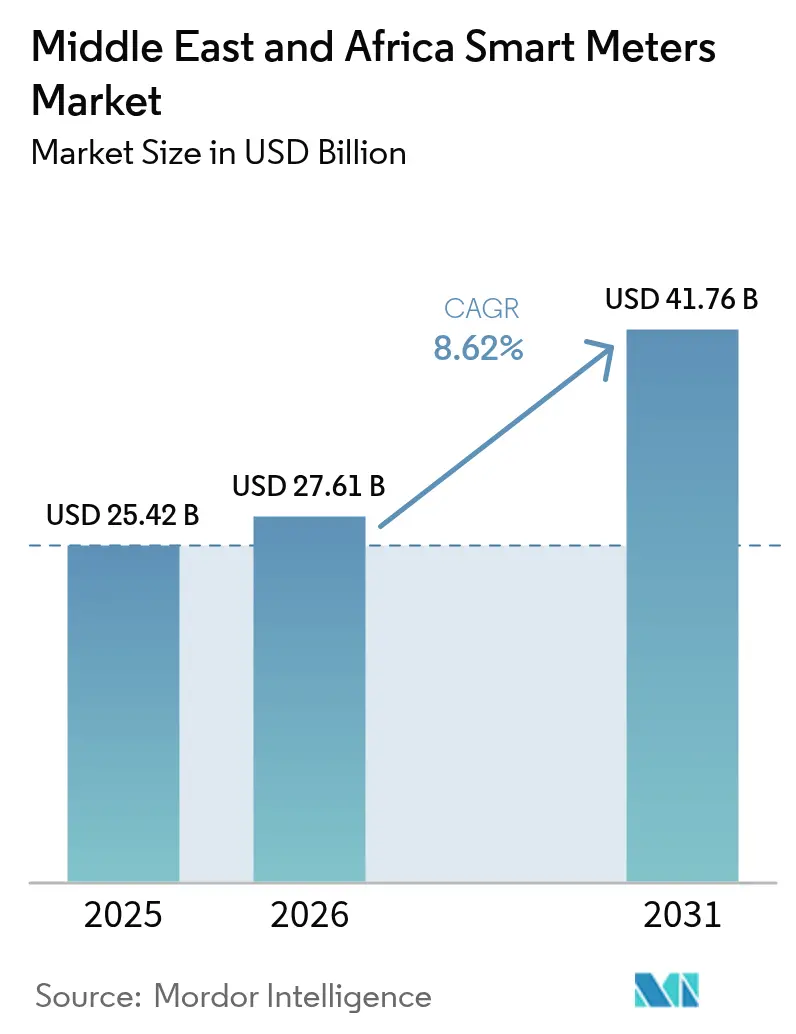
The Middle East and Africa smart meters market size is expected to grow from USD 25.42 billion in 2025 to USD 27.61 billion in 2026 and is forecast to reach USD 41.76 billion by 2031 at 8.62% CAGR over 2026-2031. Accelerated modernization programs that target aggregate technical and commercial losses, such as Dubai Electricity and Water Authority’s USD 1.9 billion smart-grid upgrade, continue to funnel large capital allocations into new deployments.[1]SaudiGulf Projects, “Dubai implementing smart grid project worth USD 1.9 billion,” saudigulfprojects.com Government mandates in the Gulf Cooperation Council (GCC) and South Africa embed smart-meter rollouts into utility compliance plans, while industrial customers adopt advanced metering faster to support manufacturing expansion and renewable-generation integration.[2]International Trade Administration, “UAE Renewable and Clean Energy Outlook,” trade.gov Desalination costs and water-scarcity pressures raise the profile of smart water-meter projects, and 5G availability lifts interest in cellular communications that complement incumbent RF mesh networks. Competitive intensity rises as local manufacturing gains momentum under harmonized Gulf standards that reduce certification complexity for new entrants.
Key Report Takeaways
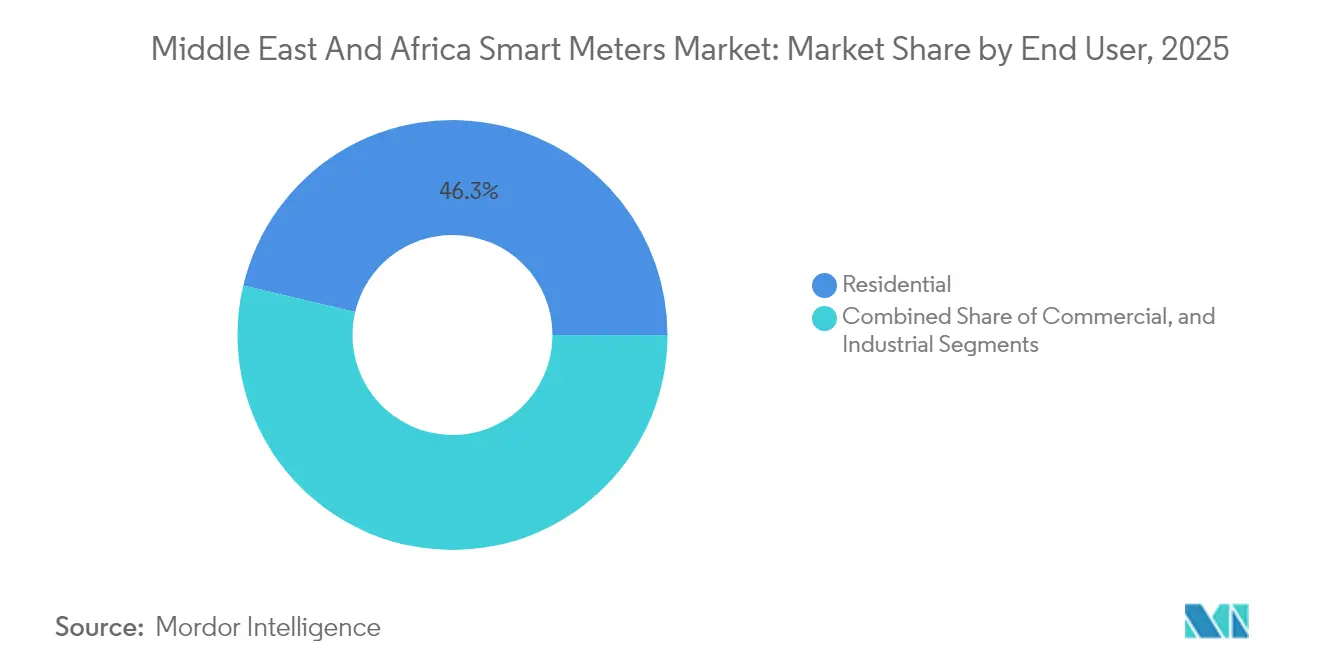
- By end user, residential accounted for 46.31% revenue share in 2025, while industrial is projected to expand at a 12.22% CAGR through 2031.
- By meter type, smart electricity devices held 60.85% of Middle East and Africa smart meters market share in 2025; smart water meters are forecast to grow at a 10.35% CAGR to 2031, contributing materially to Middle East and Africa smart meters market size expansion.
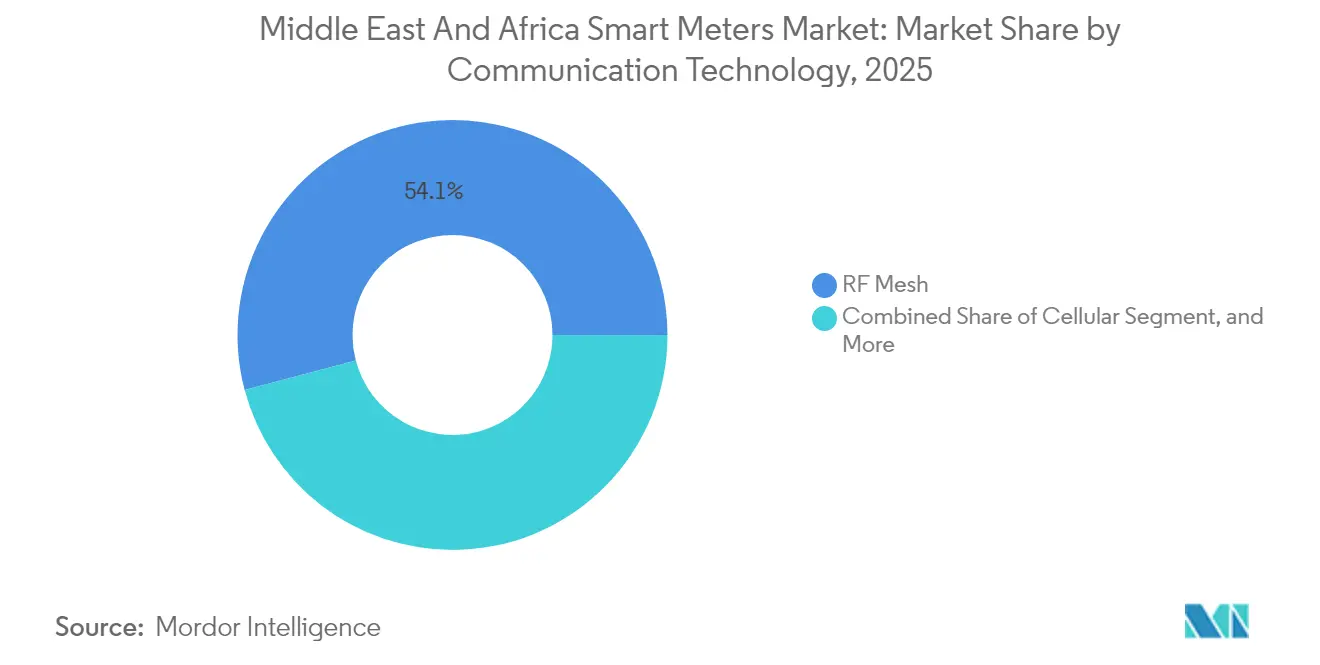
- By communication technology, RF mesh led with 54.12% share in 2025, whereas cellular networks are expected to post an 10.84% CAGR through 2031.
- By phase, single-phase units captured 63.15% market share in 2025, while three-phase systems are on track to increase at an 11.21% CAGR by 2031.
Note: Market size and forecast figures in this report are generated using Mordor Intelligence’s proprietary estimation framework, updated with the latest available data and insights as of 2026.
Middle East And Africa Smart Meters Market Trends and Insights
Drivers Impact Analysis*
| Driver | (~) % Impact on CAGR Forecast | Geographic Relevance | Impact Timeline |
|---|---|---|---|
| Rapid utility push for energy efficiency to reduce AT and C losses | +2.10% | Global MEA, with highest impact in Nigeria, South Africa, Egypt | Short term (≤ 2 years) |
| Government mandates and incentives for smart meter rollouts | +1.80% | GCC states, South Africa, Egypt, Morocco | Medium term (2-4 years) |
| Smart city and IoT infrastructure investments | +1.50% | UAE, Saudi Arabia, Qatar, South Africa | Medium term (2-4 years) |
| Rising demand for precise billing and customer engagement tools | +1.30% | Urban centers across MEA, particularly Dubai, Riyadh, Cape Town | Short term (≤ 2 years) |
| Surge in distributed solar rooftop connections necessitating bi-directional metering | +1.00% | GCC states, Jordan, Lebanon, South Africa | Long term (≥ 4 years) |
| Desalination plant electrification driving water meter digitization | +0.70% | GCC states, North Africa coastal regions | Long term (≥ 4 years) |
| Source: Mordor Intelligence | |||
Rapid utility push for energy efficiency to reduce AT and C losses
Utilities across the Middle East and Africa lose 15-25% of supplied electricity to technical and commercial inefficiencies, an unacceptable revenue drain that elevates smart-meter programs to strategic priority. Nigeria’s distribution companies launched a 1.4-million-meter initiative in 2024 to target theft hotspots, while Zimbabwe accelerated its own installations to tighten billing accuracy.[3]Utilities Middle East, “Zimbabwe, Nigeria utilities ramp up smart-meter rollouts,” utilities-me.com In parallel, Gulf efficiency-label regulations demand granular consumption evidence, so utilities increasingly treat smart-meter data as the compliance backbone.[4]Dubai Electricity and Water Authority, “Energy Efficient Appliances Campaign,” dewa.gov.ae The resulting procurement surge enlarges the Middle East and Africa smart meters market, encourages multi-vendor tenders, and positions analytics services as high-value add-ons. Utilities that quantify loss reductions faster secure tariff-review advantages, amplifying first-mover benefits across the region.
Government mandates and incentives for smart-meter rollouts
Regulatory shifts from voluntary to mandatory deployments create a powerful demand floor. South Africa’s National Regulatory System 049:2016 sets advanced-metering specifications, and Cape Town now requires smart meters in new buildings. The Gulf Cooperation Council’s G-Mark certification aligns multi-country technical standards, slashing vendor compliance costs and accelerating shipments. Egypt’s refreshed IoT framework clears cellular-meter ambiguity, a previous bottleneck. As mandates widen, the Middle East and Africa smart meters market gains predictability that helps financiers back long-term rollouts, even in utilities with constrained balance sheets. Subsidy schemes covering up-front device costs further widen the addressable customer base.
Smart city and IoT infrastructure investments
Mega-projects such as Dubai’s USD 1.9 billion smart-grid plan weave metering into citywide platforms for real-time infrastructure management. The UAE’s Energy Strategy 2050, targeting 44% clean energy, relies on distributed-generation data streams that only advanced meters can provide. Saudi Arabia’s NEOM integrates smart-water networks at blueprint stage, turning meter connectivity into construction norm. These headline programs draw suppliers into long-term service arrangements and raise performance benchmarks that spill into neighbouring markets. Consequently, the Middle East and Africa smart meters market benefits from economies of scale in hardware production and cloud-platform licensing.
Rising demand for precise billing and customer-engagement tools
Consumers seek transparent invoices and usage analytics, pushing utilities toward meters that deliver real-time data. TAQA Distribution’s tie-in with Abu Dhabi Global Market to automate tenancy-fee billing demonstrates value-added monetization avenues. Similar apps elsewhere provide time-of-use pricing and automated bill alerts, increasing payment compliance. Utilities that deploy such features reduce receivables days and justify higher capital outlays, reinforcing demand within the Middle East and Africa smart meters market. As feedback loops shape consumption behaviour, demand-response programs gain traction, supporting grid-stability objectives.
Restraints Impact Analysis*
| Restraint | (~) % Impact on CAGR Forecast | Geographic Relevance | Impact Timeline |
|---|---|---|---|
| High upfront device and installation costs | -1.40% | Sub-Saharan Africa, smaller GCC utilities | Short term (≤ 2 years) |
| Limited utility CAPEX and financing constraints | -1.10% | Nigeria, Kenya, Ghana, smaller regional utilities | Medium term (2-4 years) |
| Cybersecurity skill gap within regional utilities | -0.80% | Global MEA, particularly acute in Sub-Saharan Africa | Medium term (2-4 years) |
| Interoperability challenges between legacy AMR and new AMI architectures | -0.60% | Utilities with existing AMR infrastructure across MEA | Short term (≤ 2 years) |
| Source: Mordor Intelligence | |||
High upfront device and installation costs
Smart-meter hardware ranges from USD 50-150 per unit, and installation adds labour plus communication-network expenses. Sub-Saharan African utilities, often operating under currency volatility, face additional import-price swings that strain budgets. Lack of large-volume purchase power weakens their bargaining position relative to GCC peers. Certification fees from the Standard Transfer Specification Association raise compliance overheads for pre-paid solutions. Although donor-finance programs exist, disbursement timelines rarely align with meter-replacement cycles, prolonging reliance on legacy equipment and constraining the Middle East and Africa smart meters market in low-income regions.
Limited utility CAPEX and financing constraints
Balance-sheet pressures persist where tariff levels remain politically capped. Nigerian distribution firms and several East-African utilities struggle to secure commercial loans at acceptable rates. Concessionary funding from multilateral agencies covers pilot projects but seldom full fleet replacements. Consequently, tender sizes fragment, diluting economies of scale and prolonging deployment schedules, which drags on the overall growth trajectory of the Middle East and Africa smart meters market. Vendor-financed delivery models emerge, yet credit-risk premiums flow into end-user tariffs, exposing utilities to social-acceptance hurdles.
*Our forecasts treat driver/restraint impacts as directional, not additive. The impact forecasts reflect baseline growth, mix effects, and variable interactions.
Segment Analysis
By End User: Industrial Segment Drives Electrification Wave
Industrial applications accounted for 12.22% CAGR growth potential, signalling the segment’s role as the fastest-expanding component of the Middle East and Africa smart meters market size between 2026 and 2031. Industrial facilities including desalination plants, mines, and fast-growing manufacturing hubs in Saudi Arabia and the UAE require granular energy data to optimize production processes and integrate on-site renewables. These requirements stimulate demand for three-phase bi-directional meters capable of power-quality analytics, pushing average selling prices above the residential range and boosting overall revenue contribution. Vision 2030 agendas across Gulf economies strengthen the order pipeline as utilities partner with industrial-estate developers to pre-install smart-meter infrastructure.
Residential deployments, holding a 46.31% share in 2025, remain core to volume shipments within the Middle East and Africa smart meters market. Mandated rollouts in Cape Town and GCC states, coupled with consumer demand for transparent billing, sustain steady unit growth. Affordability concerns in lower-income markets, however, temper residential conversion rates, prompting suppliers to introduce stripped-down prepaid variants. Commercial buildings sit between the two extremes, leveraging meters for demand-response participation and energy-efficiency certification. Together, the three user categories form a diversified demand canvas that insulates the overall market from cyclical stocks in any single sector.


By Meter Type: Water Digitization Accelerates Infrastructure Modernization
Smart electricity meters commanded 60.85% of Middle East and Africa smart meters market share in 2025, reinforcing electricity’s primacy in regional utility operations. They serve as the technological baseline and often anchor multi-utility platforms. Yet, smart water meters, forecast to post a 10.35% CAGR through 2031, gain momentum as desalination reliance and non-revenue water issues intensify financial pressures on water utilities. Ultrasonic and electromagnetic models that withstand harsh saline environments register robust bid volumes, especially in Oman and Israel.
Gas-meter adoption stays niche because pipeline infrastructure remains limited outside metropolitan pockets. Nevertheless, integrated electricity-water-gas platforms lower lifetime IT costs and make multi-commodity rollouts more attractive. The Middle East and Africa smart meters market size for water applications, while smaller today, exhibits the steepest trajectory, drawing specialized vendors into joint ventures with regional system integrators. Electricity-meter demand continues unabated due to ongoing grid-modernization mandates, but competitive margins narrow as hardware commoditizes, and value migrates to software analytics.
By Communication Technology: Cellular Networks Challenge RF Mesh Dominance
RF mesh solutions captured 54.12% share in 2025, benefitting from proven reliability in dense urban grids and lower per-node costs. Utilities appreciate self-healing capabilities and controllable quality-of-service parameters. However, cellular-enabled meters are projected to grow at an 10.84% CAGR, outpacing other technologies and reflecting expanding 4G/5G footprints across Africa and the Middle East. Wide-area coverage and built-in cybersecurity features appeal to utilities seeking rapid deployments without investing in private backhaul networks.
Power-line communication (PLC) holds a steady foothold where electrical conditions permit clean signal propagation. Emerging narrowband PLC standards like G3-PLC promise interference resilience, yet field conditions in mining belts and older neighbourhoods still challenge adoption. Hybrid communication architectures increasingly appear in tenders as utilities adopt technology-agnostic procurement to future-proof investments. This trend enlarges the addressable market for service-layer providers specializing in protocol translation and network-monitoring dashboards, further enriching the competitive tapestry within the Middle East and Africa smart meters market.
By Phase: Three-Phase Growth Reflects Industrial Expansion
Single-phase meters dominate shipments, accounting for 63.15% market share in 2025 on the back of vast residential and small-commercial customer bases. They remain essential to rapid electrification drives and prepaid rollouts in Sub-Saharan Africa. Three-phase systems, forecast to advance at an 11.21% CAGR, capture the industrial and large-commercial opportunity set intertwined with regional manufacturing ambitions and high-capacity rooftop-solar installations.
Large-scale projects such as TrinaTracker’s 3 GW Saudi manufacturing plant demand robust three-phase monitoring to manage production loads and renewable-integration quality. Harmonized low-voltage regulations issued by the Gulf Standardization Organization simplify cross-border product approval, enabling bulk procurement synergies for multinational corporations. The resulting scale reduces average three-phase meter costs, narrowing the price gap with single-phase devices and propelling faster adoption. Consequently, the Middle East and Africa smart meters market anticipates a gradual shift in revenue mix toward higher-value three-phase hardware and associated analytics services.
Geography Analysis
Gulf states lead regional adoption curves, propelled by sovereign investment and policy alignment. Saudi Arabia’s NEOM and Saudi Green Initiative coalesce around digital-meter rollouts to orchestrate distributed-generation participation and real-time demand shaping. The UAE’s USD 1.9 billion smart-grid spend cements Dubai as an innovation hub, while Qatar scales smart-meter penetration to support expanded LNG-processing complexes, each requiring precise electricity and water accounting. Collective standardization under G-Mark and GSO guidelines reduces time-to-market for new devices, creating a cohesive procurement corridor that buoys the Middle East and Africa smart meters market.
Africa presents a patchwork of progress. South Africa’s compliance-driven mandates push ahead, with Johannesburg and Cape Town stipulating smart-meter fit-outs for new developments. Nigeria’s 1.4-million-meter initiative is the continent’s largest by volume yet financing constraints slow full fleet conversion. Egypt stands out for leveraging its strategic manufacturing base to attract meter producers, serving both domestic and export customers. Kenya, Ghana, and Morocco nurture pilot projects through international partnerships, positioning themselves as next-wave hotspots. Standard Transfer Specification Association certification offers technical cohesion for prepaid models, but uneven regulatory enforcement tempers speed. Aggregated gains from high-population African markets nonetheless furnish meaningful volume to the Middle East and Africa smart meters market.
Smaller territories such as Jordan, Lebanon, Ethiopia, and Tanzania explore niche bi-directional solutions tied to distributed-solar policies. Execution speed hinges on donor funding and workforce readiness. Israel, already advanced, shifts focus to nationwide smart-water coverage, setting performance benchmarks for precision and leak detection. Islands and micro-grids adopt pay-as-you-go meters to minimize cash-collection losses, illustrating the versatility of smart-meter business models. Collectively, these diverse geographic dynamics underpin a resilient growth outlook for the Middle East and Africa smart meters market by distributing demand across varied regulatory and economic cycles.
Regulatory Landscape
Smart-meter deployments across the Middle East and Africa are increasingly shaped by tighter metering codes and interoperability mandates that reference international standards. In Nigeria, the Electricity Act 2023 underpins sector reforms, and the Nigerian Electricity Regulatory Commission (NERC) issued the Metering Code (3rd Edition) in April 2026, strengthening requirements around AMI-aligned functions used for revenue assurance and smart-grid integration. In South Africa, the National Energy Regulator of South Africa (NERSA) distribution metering framework (including NRS-linked certification requirements such as NRS 057) continues to guide utility compliance, with NRS 049 commonly referenced for advanced metering specifications in the region.
GCC and select North African markets combine national utility specifications with harmonized product and verification regimes. Abu Dhabi Department of Energy enforces the Metering and Data Exchange Code (MDEC v5), aligning metering accuracy and data exchange requirements with standards such as IEC 62056 (DLMS/COSEM), while Saudi Arabia updated its Electricity Law in 2025 and Saudi Electricity Company specifications mandate DLMS/COSEM compliance for smart metering and smart grid equipment. Standards and verification regimes such as Ghana Standards Authority requirements (Act 1078, 2022) for pattern approval and verification to OIML R46, and regional guidance promoted by AFSEC to reduce vendor lock-in through companion specifications, lift the compliance bar for both imported and locally assembled meter portfolios.
Competitive Landscape
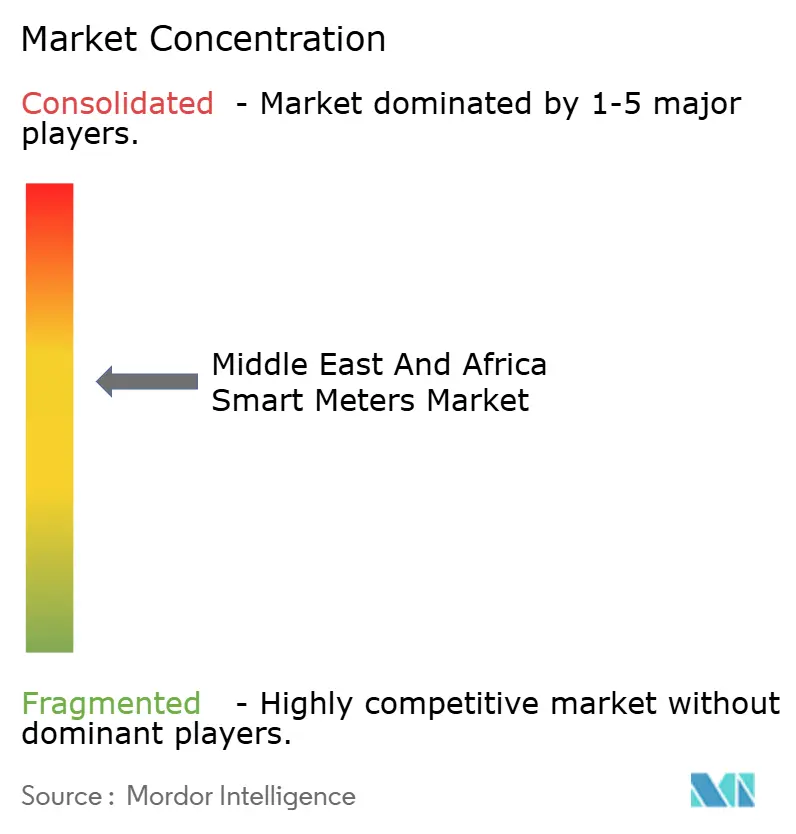
The Middle East and Africa smart meters market exhibits moderate fragmentation: no single player dominates, but European incumbents such as Landis+Gyr and Kamstrup still secure large framework contracts thanks to deep DLMS/COSEM portfolios. Asian manufacturers leverage cost advantages and increasingly localize assembly CHINT’s Kenyan factory is emblematic allowing competitive pricing without breaching Gulf certification rules. Local system integrators act as channel partners, bundling software and field-services to bridge utilities’ skill gaps, thus playing an outsized role in vendor selection.
Strategic partnerships proliferate. e& enterprise’s five-year managed-services deal with Etihad Water and Electricity highlights rising appetite for outsourced data-management models. Meters now ship with cloud dashboards and AI-driven analytics, capabilities that differentiate suppliers in tender technical-evaluation scoring. Vendors offering end-to-end cybersecurity suites gain favour as utilities confront skill shortages. Meanwhile, emerging water-meter specialists target desalination-centric GCC utilities, creating room for niche leaders in subsegments of the Middle East and Africa smart meters market.
Price competition intensifies on commodity single-phase hardware, pushing manufacturers to chase margin in software subscriptions and maintenance contracts. Certification bodies enforce strict accuracy and interoperability standards, effectively filtering out low-quality entrants. As standardization tightens, competition shifts from hardware feature counts to lifetime-operating-cost arguments. The combined share of the top five suppliers aggregates at roughly 55%, indicative of a market concentration score of 5, signalling balanced rivalry and avenues for new entrants.
Middle East And Africa Smart Meters Industry Leaders
Landis+Gyr Group AG
Kamstrup A/S
Itron Inc.
Iskraemeco d.d.
Elektromed (Termikel Group)
- *Disclaimer: Major Players sorted in no particular order

Market Opportunities and Future Outlook
A key whitespace in the Middle East and Africa smart meters market is the shift from meter-only procurement to end-to-end AMI programs that cover meter data management (MDM), cybersecurity, and systems integration, especially where regulators are formalizing AMI functionality. Nigeria provides a clear anchor through NERC's Metering Code (3rd Edition, April 2026), which codifies capabilities utilities use for remote operations and revenue assurance, expanding opportunity for AMI head-end, MDM platforms, and integration services alongside device supply. This is reinforced by utility-led digital initiatives in the GCC, such as Dubai Electricity and Water Authority's smart-grid program (USD 1.9 billion), which broadens the scope for multi-year managed services and analytics beyond meter hardware.
Another opportunity pocket is the push toward mass rollout across multiple African markets, which creates demand for scalable deployment, commissioning, and after-sales operations as programs move from pilots to nationwide phases. In 2026, Ethiopia launched a USD 48.8 million project to install 500,000 smart meters nationwide, and Tunisia reported 80,000 low-voltage smart meters installed by end-March 2026 with a stated 500,000-unit installation target for 2026, pointing to ongoing tendering and logistics needs for installation partners and communications backhaul choices (RF mesh vs cellular). On the enterprise and industrial side, the agreement between Egyptian Electricity Holding Company and e& Egypt (July 2026) to deploy smart electricity meters across e& Egypt sites highlights a near-term pathway for industrial and large-commercial deployments that bundle metering with ICT operations, while Saudi Electric Company's award to Wipro (July 2025) for a smart meter data management system illustrates active spend on central software layers that can be reused across utilities as smart-meter fleets expand.
Recent Industry Developments
- May 2026: Landis+Gyr EMEA launched the E480 DIN-Rail electricity smart meter at Enlit Africa 2026 in Cape Town, emphasizing NB-IoT connectivity with 2G fallback and positioning the offer for African utility communications environments. The introduction also highlighted local manufacturing capability in Gauteng, supporting localization requirements and shortening supply chains for regional tenders.
- October 2025: Itron signed an MoU with InfraX (a Digital DEWA subsidiary) to collaborate on smart utility and IoT solutions across the UAE, including smart metering. The partnership framework strengthens Itrons access to smart-city and utility modernization programs tied to Dubai infrastructure platforms and creates a channel for broader AMI and data-layer deployments.
- August 2024: Landis+Gyr was selected to provide over 400,000 E360 and E450 residential smart meters and GridStream software for a national rollout in Cyprus in partnership with Cyta. The award underscored competitive momentum for integrated meter-plus-software propositions and reinforced the importance of utility-scale deployments that bundle devices with head-end and operational software.


Research Methodology Framework and Report Scope
Market Definition and Coverage
For this study, the market covers revenues generated from smart electricity, gas, and water meters sold and deployed across the Middle East and Africa, including associated communication-enabled metering functionality used by utilities and end users.
Scope exclusions: We exclude broader smart grid hardware, telecom network buildouts, and utility IT platforms that sit outside the meter and its immediate metering communications.
Segmentation Overview
- By End User
- Residential
- Commercial
- Industrial
- By Meter Type
- Smart Electricity Meters
- Smart Gas Meters
- Smart Water Meters
- By Communication Technology
- RF Mesh
- Power Line Communication
- Cellular
- By Phase
- Single-Phase
- Three-Phase
- By Geography
- Middle East
- Saudi Arabia
- United Arab Emirates
- Qatar
- Kuwait
- Oman
- Bahrain
- Turkey
- Israel
- Jordan
- Lebanon
- Africa
- South Africa
- Egypt
- Nigeria
- Kenya
- Morocco
- Algeria
- Ghana
- Ethiopia
- Tanzania
- Middle East
Data Sources, Market Sizing, and Validation
Desk Research
Desk research was used to frame the demand pool and to anchor country-level rollout signals before interview validation. We referenced public sources such as national energy regulator releases, utility tender portals and procurement notices, customs and trade statistics where available, and standards and guidance documents from bodies such as IEC and ISO.
To keep assumptions realistic, we also reviewed utility annual reports, government electrification and water-loss programs, and credible press coverage for timelines and policy triggers that shape metering upgrades. In parallel, we used a paid subscription focused on company financials and intelligence to sanity check supplier exposure to the region, plus a paid patent database to spot where communication and security features are evolving and could shift average selling prices over time. These sources are illustrative only, and many other public and paid references were also used for data collection, validation, and research clarification.
Primary Interviews and Surveys
Primary work focused on utilities, metering ecosystem participants, and channel partners involved in procurement, deployment, and after-sales support across key Middle East and Africa markets. Interviews helped confirm practical items like tender-to-installation lags, split between new connections and replacements, and the ASP ladder by phase, communication type, and meter category, which are hard to pin down from desk sources alone. To avoid one-sided inputs, feedback was balanced across different company sizes and job roles, followed by quick re-checks when outliers showed up in the model.
Distribution of primary research fieldwork respondents
| Company type | Respondent position | Region |
|---|---|---|
| Top tier: 35% | CXOs: 12% | |
| Mid tier: 47% | Functional/Unit leaders: 35% | |
| Smaller Players: 18% | Managers: 53% |
Market-Sizing & Forecasting
The market was primarily built using a top-down approach where utility rollouts, connections growth, and replacement cycles are translated into annual meter demand by country, and then priced using meter-type and communication-specific ASP bands. Once that demand pool was created, selective bottom-up checks were used to keep it grounded, such as supplier revenue exposure checks, distributor channel feedback on typical order sizes, and sampled ASP x shipment volumes for common meter configurations.
Key model inputs included smart meter penetration targets and mandated rollout schedules, annual electricity and water connections additions, loss-reduction and billing modernization programs, typical meter replacement intervals, the split of single-phase versus three-phase deployments, and the mix of RF mesh, PLC, and cellular communication. For forecasting, scenario analysis was applied around tender timing, funding pace, and local content requirements, and then the path was smoothed with expert-validated assumptions on annual ASP progression (for example, feature upgrades and localization costs). Where bottom-up signals were missing for smaller countries, gaps were handled using proxy rollout intensity from similar utilities and adjusted ASP bands based on import mix and stated tender specs.
Data Validation & Update Cycle
Outputs were cross-checked against independent signals such as tender pipelines, announced rollout targets, and observed adoption patterns by phase and communication type, and then variances were reviewed in a separate analyst pass before finalizing. When a country estimate looked unusually high or low, we re-opened the drivers, re-tested the penetration and ASP assumptions, and then re-contacted sources when the gap could not be explained by policy timing or project delays.
The report is refreshed on an annual cycle, and interim updates are triggered when material events occur, such as large utility tenders, regulatory mandates, or currency shocks that can move pricing. Before delivery, a final review is completed to ensure recent public announcements and confirmed market signals are reflected in the latest view.
Mordor Intelligence's Middle East and Africa Smart Meters Market Size Compared With Other Published Estimates
Published numbers for this market often spread out because teams do not line up on what gets counted, when it gets counted, and which pricing logic is used for different meter configurations. In our experience, the biggest differences come from how rollout timing is treated, whether the estimate is anchored to meter shipments versus deployed endpoints, and how currency translation is handled for multi-country totals.
A refresh-led view reduces drift because the year used for FX rates, the timing of tender awards, and the ASP progression by meter type can change the total quickly, especially when large national programs are re-phased. The table below reflects those effects, where the 2025 value and the follow-on 2026 step are kept consistent through the same pricing calendar and interview re-checks, a cadence maintained by Mordor Intelligence.
Benchmark comparison
| Source | Market Size | Gaps in Research Methodology |
|---|---|---|
| Mordor Intelligence | USD 25.42 B (2025) | |
| Trade Journal A | USD 1.33 B (2024) | Uses a much narrower revenue boundary that appears closer to annual meter sales or awarded contract value, and it is presented in a different year and currency base, which can understate multi-country totals when FX and tender timing shift. |
| Global Consultancy B | USD 22.00 B (2024) | Keeps a 2024 base and applies a steeper growth path without clearly separating ASP uplifts by meter type, phase, and communication technology, which can swing totals when program mix changes across countries. |
Overall, the spread is mostly explained by scope boundary choices and timing choices, followed by how pricing is stepped up over the forecast. By tying demand to rollout drivers and then checking ASP bands and FX timing during validation, the estimate stays traceable to clear inputs and repeatable update steps.


Key Questions Answered in the Report
What is the current valuation of the Middle East and Africa smart meters market?
The market stands at USD 27.61 billion in 2026 and is forecast to grow to USD 41.76 billion by 2031.
Which end-user segment is growing fastest?
Industrial installations, driven by manufacturing expansion and renewable integration, are projected to register a 12.22% CAGR through 2031.
Why are utilities shifting toward cellular communication for meters?
Expanding 4G/5G coverage offers wide-area connectivity without dedicated backhaul, supporting an 10.84% CAGR for cellular-enabled meters.
How significant are water-meter projects in GCC countries?
Smart water meters are the fastest-growing meter type at a 10.35% CAGR, propelled by desalination costs and water-scarcity concerns.
Which technology standards help streamline cross-border deployments?
The Gulf Cooperation Council's G-Mark and Gulf Standardization Organization regulations provide unified certification pathways that shorten time-to-market.
What inhibits faster smart-meter adoption in Sub-Saharan Africa?
High up-front costs, limited utility CAPEX, and cybersecurity skill gaps restrict large-scale rollouts despite strong long-term demand drivers.
Page last updated on:






