
Market Overview
| Study Period | 2020 - 2031 |
|---|---|
| Forecast Data Period | 2026 - 2031 |
| Base Year Market Size (2025) | USD 20.05 Billion |
| Market Size (2026) | USD 21.63 Billion |
| Market Size (2031) | USD 31.62 Billion |
| Growth Rate (2026 - 2031) | 7.89% CAGR |
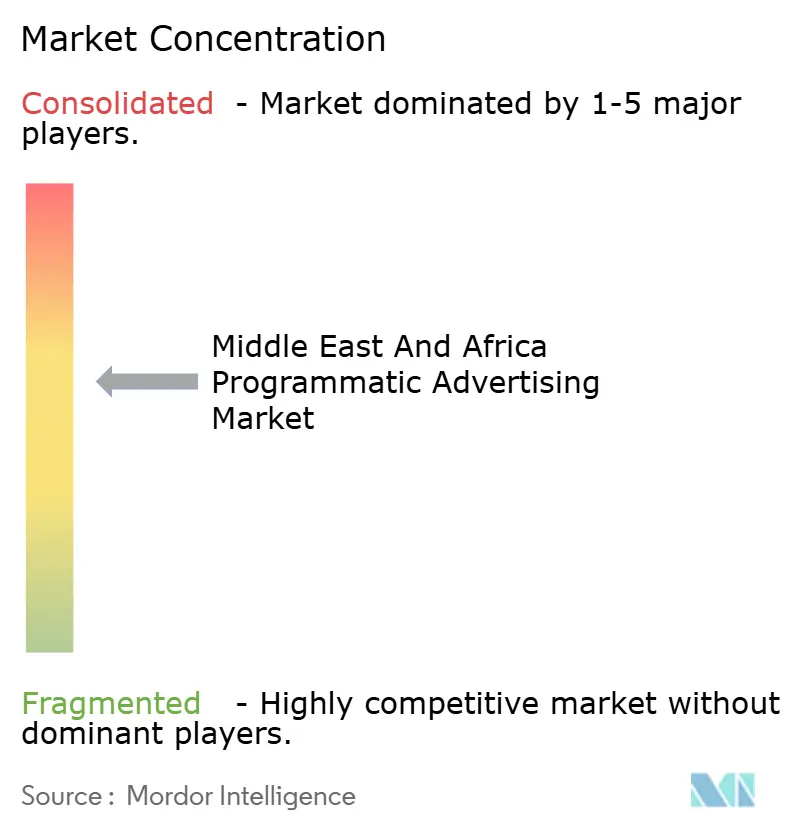
| Market Concentration | Medium |
Major Players *Disclaimer: Major Players sorted in no particular order Image © Mordor Intelligence. Reuse requires attribution under CC BY 4.0. | |
Middle East And Africa Programmatic Advertising Market Analysis by Mordor Intelligence
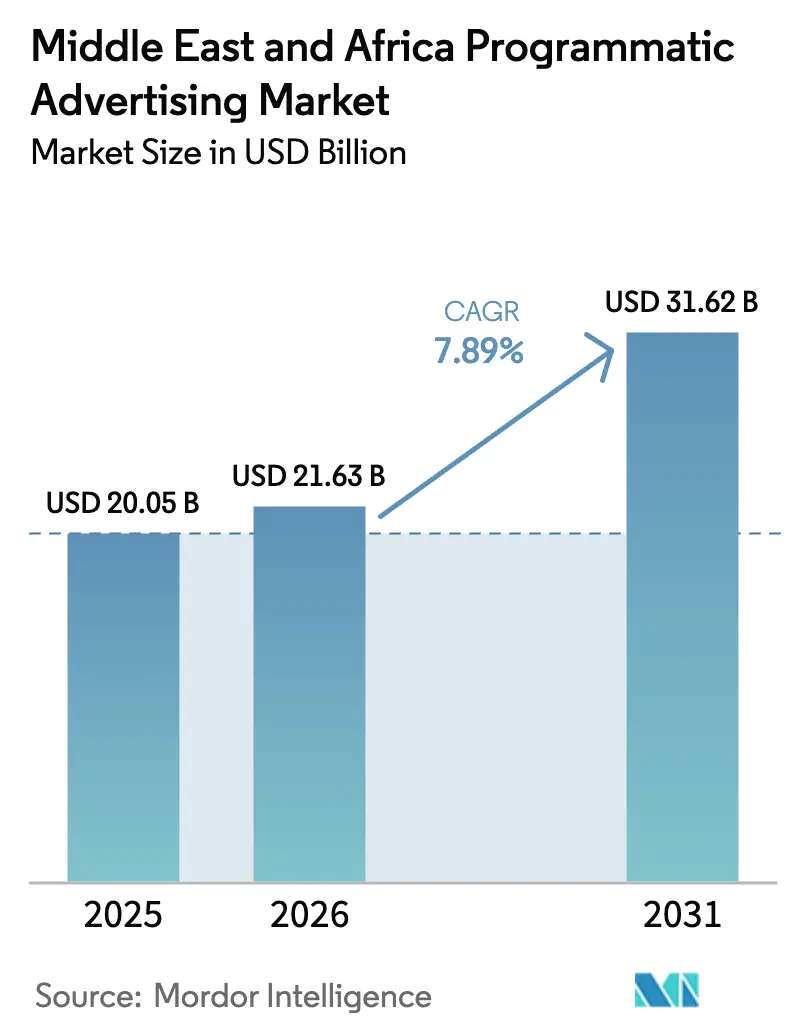
The Middle East and Africa programmatic advertising market size is expected to grow from USD 20.05 billion in 2025 to USD 21.63 billion in 2026 and is forecast to reach USD 31.62 billion by 2031 at 7.89% CAGR over 2026-2031. Robust digital payment growth, sovereign AI programs, and telco-led identity graphs are widening the addressable audience pools while easing compliance with new privacy laws. [1]Jurgita Rudzyte, “MTN Reimagines Mobile Advertising,” Novatiq, novatiq.com Rapid e-commerce expansion has lifted first-party data volumes, enabling advertisers to shift budgets from broad targeting toward deterministic buys that improve return on ad spend. Mobile-first consumer behavior in GCC states, coupled with a decisive pivot to CTV inventory by regional broadcasters, is intensifying demand for cross-screen measurement solutions. At the same time, patchy connectivity outside Tier-1 African cities and uneven brand-safety adoption temper near-term growth prospects.
Key Report Takeaways
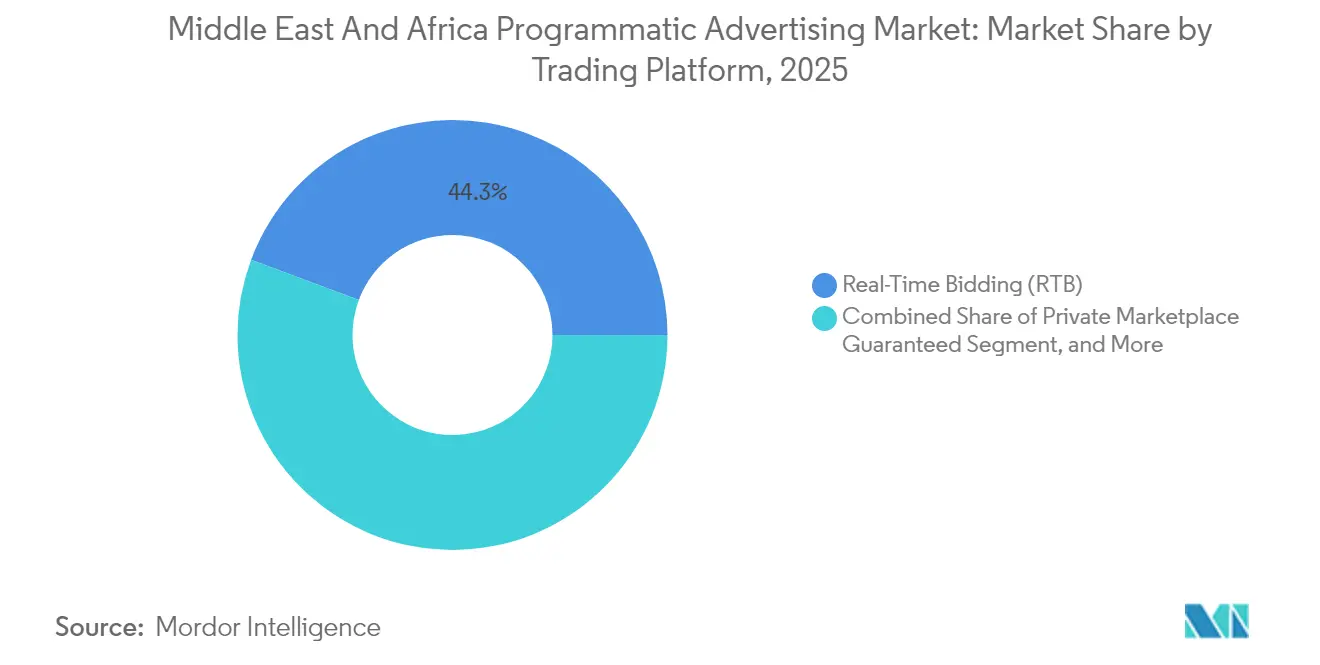
- By trading platform, Real-Time Bidding led with 44.30% of Middle East and Africa programmatic advertising market share in 2025, while Automated Guaranteed is projected to expand at a 10.34% CAGR through 2031.
- By advertising media, Digital Display captured 54.30% of revenue in 2025; Mobile Display is set to advance at a 8.88% CAGR to 2031.
- By ad format, Display Banner accounted for 34.40% of the Middle East and Africa programmatic advertising market size in 2025, whereas CTV/OTT is growing at a 13.98% CAGR.
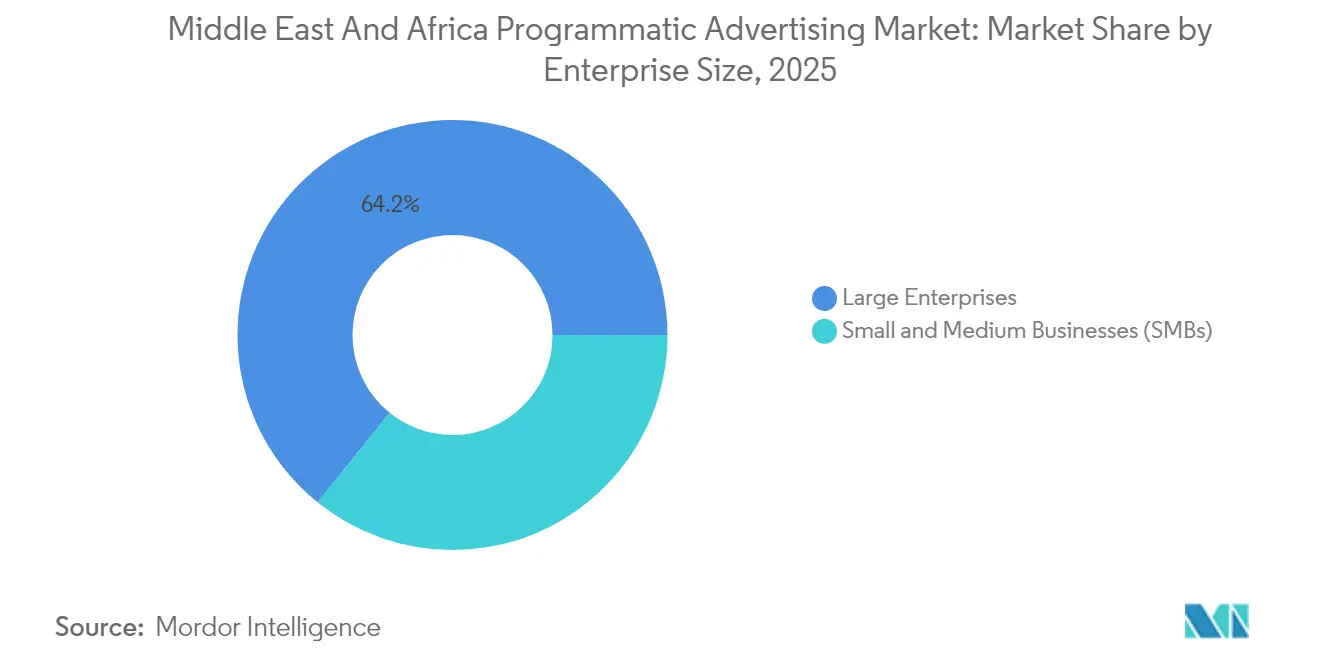
- By enterprise size, large enterprises held 64.20% of spending in 2025; SMBs are pacing growth at 8.96% CAGR.
- By industry vertical, retail and e-commerce led with 19.70% share in 2025, while healthcare and pharma is projected to grow at a 9.84% CAGR.
- By geography, the Middle East commanded 59.40% share in 2025; Africa is the fastest-growing region with a 9.12% CAGR forecast.
- Google, Amazon Ads, and Xaxis collectively accounted for 52% of spend in 2024, underscoring the market’s moderate concentration.
Note: Market size and forecast figures in this report are generated using Mordor Intelligence’s proprietary estimation framework, updated with the latest available data and insights as of 2026.
Middle East And Africa Programmatic Advertising Market Trends and Insights
Drivers Impact Analysis*
| Driver | (~) % Impact on CAGR Forecast | Geographic Relevance | Impact Timeline |
|---|---|---|---|
| Explosion of Mobile-First Consumers in GCC States | +2.1% | UAE, Saudi Arabia, Qatar, Kuwait | Medium term (2-4 years) |
| Growing Adoption of CTV/OTT Advertising Inventory by MENA Broadcasters | +1.8% | Middle East core, spill-over to North Africa | Medium term (2-4 years) |
| Cross-border E-commerce Surge Boosting First-Party Data Use in UAE & KSA | +1.5% | UAE, Saudi Arabia, regional expansion | Short term (≤ 2 years) |
| Telco-led Identity Graph Initiatives in Africa | +1.2% | Sub-Saharan Africa, Nigeria, South Africa | Long term (≥ 4 years) |
| Programmatic DOOH Roll-outs Around FIFA & Expo Events in MEA | +1.0% | Qatar, UAE, Saudi Arabia, Egypt | Short term (≤ 2 years) |
| AI Integration and Automation in Advertising Operations | +0.9% | Global, with early adoption in GCC states | Medium term (2-4 years) |
| Source: Mordor Intelligence | |||
Explosion of Mobile-First Consumers in GCC States
Mobile-first usage now defines consumer engagement, with 70% of UAE shoppers leveraging AI assistants, a 44% jump since 2024. Users spend 3.5 hours daily on social platforms, and 67% of TikTok viewers feel motivated to make in-app purchases. Advertisers gain granular audience signals that refine bid strategies across the Middle East and Africa programmatic advertising market. Retailers are prioritizing AI budgets to shorten the path to purchase and reduce cart abandonment. The UAE e-commerce market is projected to surpass AED 48.8 billion (USD 13.3 billion) by 2028, reinforcing the scale needed for advanced programmatic stacks. [2]Somshankar Bandyopadhyay, “E-commerce Market in the UAE Is Expected to Surpass Dh48.8 Billion by 2028,” Khaleej Times, khaleejtimes.com Mobile-centric DSPs such as InMobi are positioning for a USD 1 billion IPO to capitalize on this uptick.
Growing Adoption of CTV/OTT Advertising Inventory by MENA Broadcasters
Sixty-five percent of UAE residents stream content daily, accelerating migration of brand budgets toward addressable TV formats. Noon’s IPL streams show how shoppable overlays fuse entertainment with impulse purchases. ArabyAds’ alliance with LG Ad Solutions broadens supply while maintaining viewability standards. Dentsu’s curated CTV marketplace posted an 18% lift in attention scores and reduced fraud by 60% compared with open exchanges. Netflix and Yahoo expanded programmatic sales, and Amazon Ads struck a Roku pact reaching 80% of global CTV homes, pulling incremental demand into the Middle East and Africa programmatic advertising market.
Cross-Border E-commerce Surge Boosting First-Party Data Use in UAE and KSA
Digital payment volumes have risen 658% since 2020, fueling richer consented data sets for deterministic targeting. Saudi Arabia has recorded a 180% jump in weekly online shopping, while cash-on-delivery reliance fell to 20%, signaling higher trust in digital payments. New regulations such as UAE’s Federal Decree Law No. 45 of 2021 are forcing marketers to pivot toward secured data flows. Retail media partnerships including GoWit-Mumzworld enable brands to activate 3.5 million shopper IDs via self-service dashboards. Amazon’s South Africa launch validates untapped market headroom, further enlarging the Middle East and Africa programmatic advertising market.
Telco-Led Identity Graph Initiatives in Africa
MTN Ads now delivers deterministic matches across 19 markets without third-party cookies. GroupM and Accenture Song’s certification by Utiq shows global agencies are embracing telco IDs. Vodacom’s partnership with Google on generative AI and Orange’s African-language models highlight how carriers move beyond connectivity toward data enablement. As mobile subscriber penetration heads to 50% by 2030, identity graphs promise scale and privacy alignment for the Middle East and Africa programmatic advertising industry.
Restraints Impact Analysis*
| Restraint | (~) % Impact on CAGR Forecast | Geographic Relevance | Impact Timeline |
|---|---|---|---|
| Limited Third-Party Cookie Alternatives on Local Publishers | -1.4% | Regional publishers across MEA | Short term (≤ 2 years) |
| Patchy 4G/5G Coverage Outside Tier-1 African Cities | -1.1% | Sub-Saharan Africa, rural areas | Long term (≥ 4 years) |
| Low Brand-safety Tool Penetration Elevating Fraud Risk | -0.8% | Africa core, emerging Middle East markets | Medium term (2-4 years) |
| Fragmented Data-privacy Regulations Across MEA States | -0.6% | Pan-MEA, with varying compliance requirements | Short term (≤ 2 years) |
| Source: Mordor Intelligence | |||
Limited Third-Party Cookie Alternatives on Local Publishers
Thirty percent of marketers remain ill-prepared for cookie deprecation, leading to over-reliance on contextual targeting. Local publishers often lack the capital to build first-party data tools, creating a two-speed ecosystem where global platforms win disproportionate budgets. Partnerships such as ArabyAds-Lotame aim to close the gap, yet uptake is uneven. Fragmented data-privacy frameworks add compliance overhead that smaller publishers struggle to manage. The imbalance restricts supply diversity within the Middle East and Africa programmatic advertising market and could dampen CPM growth for regional inventory.
Patchy 4G/5G Coverage Outside Tier-1 African Cities
South Africa enjoys 97.5% broadband coverage, yet many African regions face inconsistent speeds that impair high-bandwidth ad formats. Video and rich-media ads struggle to load, forcing advertisers to exclude rural cohorts or settle for lower engagement. Gaming revenues reached USD 1.8 billion in 2024, but further acceleration needs reliable networks. Starlink expansion offers a remedy, though high user fees and local ownership rules limit near-term scale. The constraint particularly hits programmatic DOOH and location-based campaigns that rely on real-time data pings.
*Our forecasts treat driver/restraint impacts as directional, not additive. The impact forecasts reflect baseline growth, mix effects, and variable interactions.
Segment Analysis
By Trading Platform: Shift Toward Quality-Guaranteed Inventory
Real-Time Bidding contributed USD 8.88 billion, equating to 44.30% of the Middle East and Africa programmatic advertising market size in 2025. Advertisers favor RTB for auction efficiency and reach across fragmented publisher pools. Yet fraud concerns have heightened the appeal of Automated Guaranteed deals that lock premium slots at predictable CPMs. Automated Guaranteed is set for 10.34% CAGR, reflecting rising brand-safety expectations and the integration of supply-path optimization protocols. The Trade Desk’s 25% revenue rise and Sincera acquisition demonstrate the pivot toward analytics that surface trustworthy paths and reduce hidden fees. PubMatic reports 55% of impressions now travel through optimized routes, underscoring a marketwide push for transparency.
Private Marketplace Guaranteed offers curated high-viewability contexts for auto, BFSI, and luxury brands. Unreserved Fixed-Rate deals remain relevant for performance marketers chasing cost control. Consolidation reshapes platform choices, as Outbrain’s USD 1 billion Teads takeover broadens native and video bundles. Advertisers therefore weigh scale versus exclusivity in determining optimal trading mixes across the Middle East and Africa programmatic advertising market.


By Advertising Media: Mobile Display Outpacing Desktop
Digital Display retained 54.30% share led by omnichannel campaigns that repurpose creative across screens. Mobile Display is forecast to post 8.88% CAGR, propelled by smartphone adoption and green media innovations that cut emissions by 39% while boosting click-throughs by 10%. Telco data integrations deepen contextual accuracy, particularly in cookie-light environments. As the Middle East and Africa programmatic advertising market matures, brands align mobile budgets with AI-driven commerce journeys, meeting consumers in-app where purchase intent peaks. Desktop display remains vital for B2B and long-form content, yet its share continues to edge down as hybrid work pushes more user time into mobile ecosystems.
Media buyers increasingly demand cross-device frequency capping and unified measurement. Magnite’s 23% CTV revenue rise signals demand for single-platform execution that blends CTV and mobile video. Media cost inflation has also nudged marketers toward supply-path pruning, elevating SSPs that guarantee viewable inventory at sustainable CPMs. The result is a more disciplined allocation of display budgets across the Middle East and Africa programmatic advertising market.
By Ad Format: CTV/OTT Accelerating Attention Economics
Display Banner generated USD 6.9 billion yet faces pressure from banner blindness. CTV/OTT posted the highest growth trajectory at 13.98% CAGR, reflecting full-screen engagement and fraud-mitigation tools inherent to server-side ad insertion. The move toward attention-based currencies gains momentum as contextual ad formats in Arabic achieved 3.5 times standard attention metrics. Online Video and Social Media deliver mid-funnel engagement, while Audio rides the regional podcast boom. DOOH scales through event-based installations like FIFA legacies, leveraging VIOOH’s SSP integration with BackLite Media.
CTV investment accelerates as platforms prioritize audience expansion. Magnite’s support for Netflix’s inaugural programmatic rollout affirms the premium of cinematic environments on brand recall. In turn, buyers channel incremental budgets toward CTV inventory that complements linear TV’s declining reach. The evolution underscores how user attention, not device, now anchors media planning across the Middle East and Africa programmatic advertising market.
By Enterprise Size: SMB On-Ramp to Self-Serve Buying
Large enterprises dominated with 64.20% spend due to proprietary data lakes and cross-market omnichannel orchestration. However, SMB adoption is projected to climb 8.96% CAGR as user-friendly dashboards remove execution hurdles. Intuit SMB MediaLabs and PubMatic partnership exemplify privacy-protective solutions tailored for smaller budgets. Self-service retail media exchanges such as GoWit elevate niche brands by opening direct access to high-intent shoppers in categories like mother-and-child retail. The Middle East and Africa programmatic advertising market size for SMB spend is forecast to surpass USD 3.25 billion by 2031, reflecting democratization.
Meanwhile, large enterprises refine incrementality measurement through AI algorithms that attribute offline lift to online exposure. Sustained investment in data clean rooms ensures compliance with emergent privacy statutes across MEA jurisdictions. Consequently, scale players keep command of premium supply and audience intelligence, even as SMB penetration broadens the purchaser base.
By Industry Vertical: Healthcare and Pharma Emerges as Growth Catalyst
Retail and e-commerce maintained 19.70% share in 2025, buoyed by retail media networks and same-day fulfillment options. Healthcare and pharma is slated for 9.84% CAGR as telemedicine, wearable devices, and AI symptom-checkers generate context-rich data streams. Strict regulatory oversight necessitates privacy-centric solutions, positioning programmatic channels that can honor consent frameworks. BFSI exploits deterministic IDs to enrich cross-sell models, while automotive brands lean on location-based formats to drive dealership visits.
Amazon’s retail media revenue is projected to exceed USD 60 billion in 2025, demonstrating the synergy between commerce data and ad monetization. Criteo’s alliance with MobileFuse deepens Commerce Audience targeting, hinting at future vertical-specific segmentation within the Middle East and Africa programmatic advertising market.
Geography Analysis
The Middle East delivered 59.40% of revenue, supported by visionary policies such as Saudi Vision 2030 that mandate digital diversification. UAE and Saudi Arabia benefit from near-universal smartphone adoption and advanced fintech rails. Cloud alliances including the USD 1 billion-plus AWS-e& agreement enhance real-time bidding throughput and low-latency ad serving across the Middle East and Africa programmatic advertising market. Qatar leverages World Cup infrastructure to expand DOOH networks, while Israel’s start-up scene injects AI algorithms into bidding engines. Meta’s Arabic language AI roll-out strengthens cultural resonance of creative assets.
Africa shows the fastest growth at 9.12% CAGR. South Africa anchors development with 124 million mobile connections and strong banking rails. Nigeria’s USD 300 million gaming revenue signals monetizable digital leisure segments. Kenya’s mobile-money innovation expands addressable payment cohorts, while Egypt’s youth bulge accelerates social media adoption. MTN Ads and Orange AI language projects equip marketers with localized identifiers. Airtel-SpaceX Starlink collaboration aims to bridge rural coverage gaps, improving inventory quality in lagging regions.
Cross-border trade corridors deepen first-party data troves. Amazon’s launch in South Africa pushes logistics benchmarks that competitors must meet. Ecobank-Google Cloud partnership advances financial inclusion, broadening digital wallet usage that supports conversion tracking. The geographic mix reveals a two-pronged opportunity: the Middle East focuses on optimization, while Africa concentrates on infrastructure build-out that will power the next wave of growth in the Middle East and Africa programmatic advertising market.
Regulatory Landscape
Regulatory requirements for programmatic advertising in MEA are tightening around advertising licensing and personal data processing, which increases compliance overhead for advertisers, agencies, and ad-tech intermediaries that handle audience data. In the UAE, the Media Council enforces the Advertiser Permit (Mu'lin) under Federal Decree-Law No. 55 of 2023 for paid promotional content, while privacy compliance is shaped by UAE Federal Decree Law No. 45 of 2021. Saudi Arabia and other GCC markets continue to advance data and digital regulation, reinforcing the shift toward consented first-party data activation and more controlled deal types in programmatic buying.
Across Africa, data protection and advertising oversight frameworks are becoming more enforceable, raising the bar for cross-border data transfers and governance. Nigeria enforces the Advertising Regulatory Council of Nigeria Act 2022 (ARCON) alongside the Nigeria Data Protection Act 2023 (NDPA), while South Africa's Information Regulator oversees POPIA, with formal compliance actions available including compliance notices and inspections. Egypt's Personal Data Protection Centre (PDPC) operationalized its regime in 2025, including cross-border transfer licensing and DPO registration, and Oman reached full operational compliance for its data protection framework on 5 February 2026, adding another checkpoint for regional campaign operations and data flows.
Competitive Landscape
Global ad tech leaders maintain scale advantages, yet regional specialists inject competitive tension. Google holds 31% share through YouTube reach and integrated DV360 stack. Amazon Ads follows at 12% by linking retail insights with DSP bidding. Xaxis captures 9% via agency embedded trading desks that negotiate curated supply. InMobi owns 7% through mobile-first positioning and telco alliances. The Middle East and Africa programmatic advertising market therefore exhibits moderate concentration, encouraging innovation around identity, measurement, and creative formats.
Strategic acquisitions shape value-chain integration. Outbrain’s Teads purchase creates a scaled open-internet video platform, while T-Mobile’s Vistar Media deal positions the carrier to own DOOH supply. Publicis’ Lotame buy seeks end-to-end data management, signaling that agency groups want proprietary identity scaffolding. Chinese cloud vendors like Huawei and Alibaba undercut AWS pricing, edging into the ad-tech hosting layer. As privacy mandates tighten, players able to deliver authenticated audiences without compromising compliance will strengthen their foothold.
Emerging disruptors include telco advertising arms such as MTN Ads, which leverages deterministic IDs, and retail media platforms like GoWit that monetize shopper intent at the point of sale. Technology differentiation is the decisive advantage. Platforms investing in generative AI for creative iteration and in clean rooms for safe data collaboration will out-maneuver legacy stacks. Consequently, the Middle East and Africa programmatic advertising industry stands at an inflection point where ownership of first-party signals and algorithmic efficiency set the competitive bar.
Middle East And Africa Programmatic Advertising Industry Leaders
Tonic International
Mars Media Group
Executive Digital
Boopin
Xaxis (GroupM)
- *Disclaimer: Major Players sorted in no particular order

Market Opportunities and Future Outlook
The most visible whitespace sits at the intersection of privacy compliance and performance, where fragmented MEA rules and uneven publisher readiness drive demand for technology and services that operationalize consent, data minimization, and cross-border transfer controls without reducing addressability. UAE and Saudi privacy and advertising permitting requirements are pushing brands and agencies toward authenticated, deterministic activation, which strengthens the rationale for telco-led identity graphs (for example, MTN Ads operating across 19 markets) and commerce-derived first-party segments from retail and e-commerce. These shifts support wider adoption of private marketplaces and automated guaranteed transactions that simplify governance by narrowing data-sharing and supply-path exposure.
CTV and retail media are also creating scalable inventory and measurement needs that local stacks can address with regional language support, fraud controls, and cross-screen reporting. The report's evidence of platform moves such as Netflix and Yahoo expanding programmatic sales, and Amazon Ads partnering with Roku for broader CTV reach, aligns with demand for curated premium video supply and unified frequency management across devices. Alongside this, infrastructure-led digitization initiatives such as Saudi Vision 2030 and Egypt's digital transformation agenda keep public and private sector marketing migrating to digital channels, which creates entry points for specialized compliance-by-design service providers and contextual intelligence tools that reduce reliance on third-party cookies while still working across divergent regulatory maturity levels in MEA.
Recent Industry Developments
- April 2026: Tamatem acquired Istanbul-based Playable Factory to enhance mobile games user acquisition and playable ad capabilities. The acquisition expands Tamatem's playable ad capabilities within the mobile gaming ecosystem and strengthens the regional first-party ad tech stack and inventory in MEA.
- April 2026: Perion Network launched an exclusive AI advertising partnership with McSorely Media and Mediamark to deploy AI-native execution agent Outmax across Africa. The alliance rolls out automated, AI-based ad execution across the region, potentially improving ROI and changing competitive dynamics in African programmatic buying.
- March 2026: Yassir acquired Paris-based Kawarizmi to build an integrated retail media and advertising ecosystem across EMEA. Vertical integration of adtech and retail media capabilities expands Yassir’s footprint and data assets across the MEA region.


Research Methodology Framework and Report Scope
Market Definition and Coverage
We define this market as the value of paid advertising media in the Middle East and Africa that is bought and sold through automated platforms, including real time bidding and private marketplace style deals across major digital screens.
Scope exclusions: We exclude non-digital media buying and unpaid placements, and we do not count ad tech software subscriptions unless they are directly bundled into the media transaction value.
Segmentation Overview
- By Trading Platform
- Real-Time Bidding (RTB)
- Private Marketplace Guaranteed
- Automated Guaranteed
- Unreserved Fixed-rate
- By Advertising Media
- Digital Display
- Mobile Display
- By Ad Format
- Display Banner
- Online Video
- Social Media
- CTV / OTT
- Audio (Streaming and Podcast)
- Digital-Out-of-Home (DOOH)
- Others
- By Enterprise Size
- Small and Medium Businesses (SMBs)
- Large Enterprises
- By Industry Vertical
- Retail and E-commerce
- BFSI
- Automotive
- Media and Entertainment
- Healthcare and Pharma
- Travel and Hospitality
- Telecom and IT
- Others
Data Sources, Market Sizing, and Validation
Desk Research
Desk research started with mapping the spend pool and the addressable supply for automated buying across Middle East and Africa. We used public sources such as ITU connectivity indicators, World Bank digital adoption and macro series, IMF exchange rate tables, and telecom regulator releases in key markets, which anchor internet usage, pricing pressure, and currency effects.
To connect those demand signals to advertising value, we reviewed sources such as IAB guidance on programmatic definitions, GSMA materials on mobile usage trends, and audited company disclosures like annual reports and investor presentations from agencies, publishers, and platforms that report regional revenue splits. Where available, we also checked patent databases for identity, measurement, and auction mechanics themes, and an import and export shipment-level database for select hardware proxies that can influence inventory growth, for example ad supported connected devices.
The desk sources listed here are illustrative only, and many other public documents and databases were also used for data collection, validation, and clarification.
Primary Interviews and Surveys
Primary work focused on validating what share of digital budgets is transacted programmatically in the region, and how pricing moves with inventory quality and policy changes. We spoke with demand-side and supply-side practitioners, including advertisers, agencies, publishers, and ad operations specialists, covering GCC hubs and large African ad markets so our assumptions were stress-tested across different maturity levels.
Distribution of primary research fieldwork respondents
| Company type | Respondent position | Region |
|---|---|---|
| Top tier: 39% | CXOs: 18% | |
| Mid tier: 40% | Functional/Unit leaders: 30% | |
| Smaller Players: 21% | Managers: 52% |
Market-Sizing & Forecasting
For sizing, we first reconstructed the addressable spend from the top down by linking regional digital ad expenditure to the programmatic share, and then converting it into USD using consistent year-average currency assumptions. To avoid treating all impressions as equivalent, we used inputs such as smartphone penetration, mobile internet usage, video and CTV inventory growth, the split between open auction and private marketplace activity, and typical CPM movement by media type as practical checks on the totals.
Those top-down totals were then corroborated with selective bottom-up approximations, such as sampled publisher monetized impression volumes multiplied by observed CPM ranges, and channel checks on managed-service versus self-serve buying. When bottom-up visibility was incomplete, for example smaller publishers or cross-border buys, gaps were handled using penetration ranges discussed in interviews, followed by conservative adjustments where responses diverged.
Forecasting leaned on scenario analysis supported by a light multivariate view of drivers like broadband expansion, commerce activity, and policy changes that affect addressability. Assumptions were then refined through follow-up conversations with practitioners so the trajectory stayed realistic.
Data Validation & Update Cycle
Validation is done through several rounds of checks so the final value is not driven by one data stream. We compare outputs against independent signals such as total digital ad spend direction, inventory growth indicators, and pricing trends by format, and then investigate outliers that show up at country or media level.
Before sign-off, the model is reviewed for internal consistency, including year-on-year jumps, implied CPMs, and whether platform mix shifts match what respondents describe in the market. Reports are refreshed annually, with interim updates when major events occur, such as regulatory changes, large currency moves, or meaningful shifts in publisher supply. Right before delivery, we do a final pass to ensure the numbers reflect the most recent publicly available information and validated market feedback.
Mordor Intelligence's Middle East and Africa Programmatic Advertising Market Size Versus Other Published Estimates
Published estimates for programmatic advertising in the Middle East and Africa can differ even when everyone is looking at the same broad theme, because the counted transaction can vary. Differences usually come from what is treated as media value versus technology fees, how mobile and video inventory are handled, and whether only open auction is counted or private marketplace deals are included as well.
Another frequent driver is timing and conversion practice, since several local currencies can swing enough to change the USD view across years, even if local spending is stable. Some estimates also apply global programmatic penetration rates to the region without checking local auction dynamics, which can overstate spend in markets where direct sales still dominate. The spread is easier to explain once scope choices are made explicit, and the table below shows where those choices typically show up in the numbers.
Benchmark comparison
| Source | Market Size | Gaps in Research Methodology |
|---|---|---|
| Mordor Intelligence | USD 20.05 B (2025) | |
| Regional Consultancy A | USD 18.40 B (2025) | Uses a narrower definition that emphasizes open auction buying and excludes most private marketplace and programmatic guaranteed deal value, which reduces the counted spend in GCC publisher-heavy inventory. |
| Industry Association B | USD 22.90 B (2025) | Blends media value with parts of the ad tech services layer and applies a faster CPM uplift assumption for online video and mobile display, which pushes up the implied spend. |
The comparison mainly comes down to what is counted as programmatic media and how quickly pricing and format mix are allowed to shift year to year. By keeping media transaction value separate from adjacent service revenues, and by validating deal-type splits and CPM ranges through regional interviews, the estimate stays traceable to real spend drivers, a modeling choice applied by Mordor Intelligence.


Key Questions Answered in the Report
What is the current value of the Middle East and Africa programmatic advertising market?
The market stands at USD 21.63 billion in 2026 and is forecast to reach USD 31.62 billion by 2031 at a 7.89% CAGR.
Which trading platform segment is expanding the fastest?
Automated Guaranteed is projected to grow at 10.34% CAGR between 2026 and 2031, reflecting higher demand for premium, fraud-controlled inventory.
How large is the CTV/OTT opportunity in the region?
CTV/OTT advertising is the fastest-growing ad format with a 13.98% CAGR, benefiting from 65% daily streaming penetration in the UAE.
Why are telcos important to identity resolution in Africa?
Operators like MTN provide deterministic IDs across 19 markets, giving advertisers cookieless targeting paths in low-publisher-data environments.
What restrains growth outside major African cities?
Patchy 4G/5G coverage limits high-bandwidth formats, reducing campaign reach in rural areas and slowing adoption of advanced programmatic tools.
How concentrated is the competitive landscape?
The top five players hold about 60% share, indicating moderate concentration that still leaves room for regional specialists and new entrants to scale.
Page last updated on:






