Market Overview
| Study Period | 2017 - 2030 |
|---|---|
| Base Year For Estimation | 2024 |
| Forecast Data Period | 2025 - 2030 |
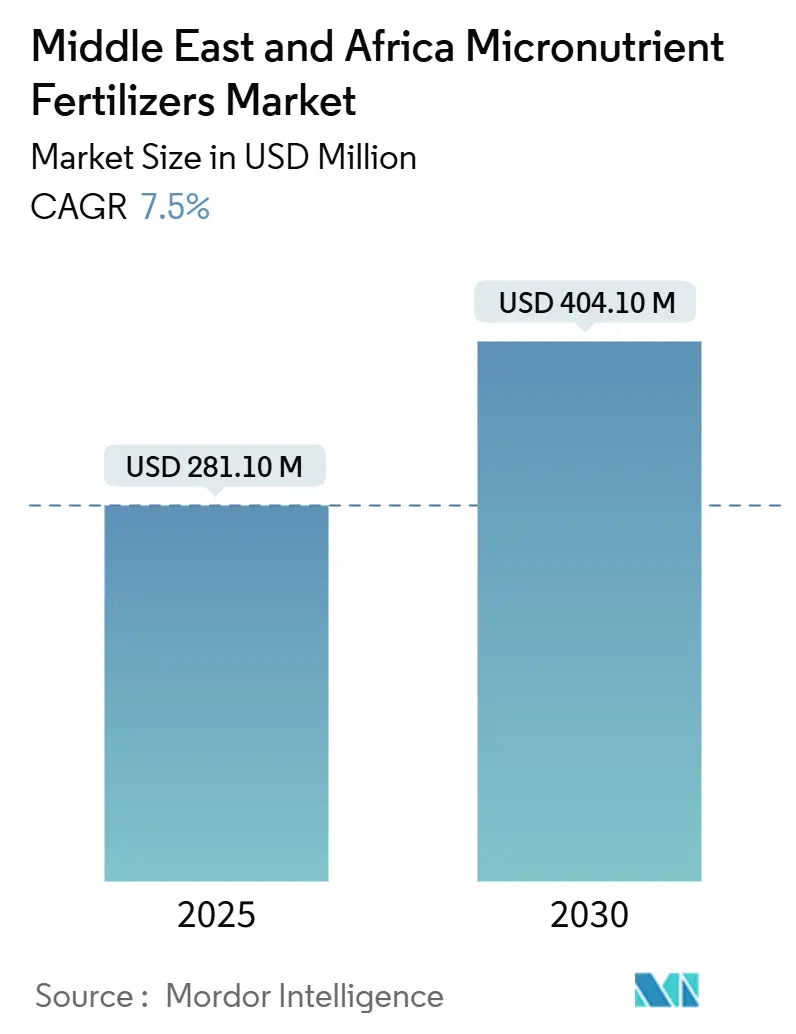
| Market Size (2025) | USD 281.10 Million |
| Market Size (2030) | USD 404.10 Million |
| Growth Rate (2025 - 2030) | 7.50% CAGR |
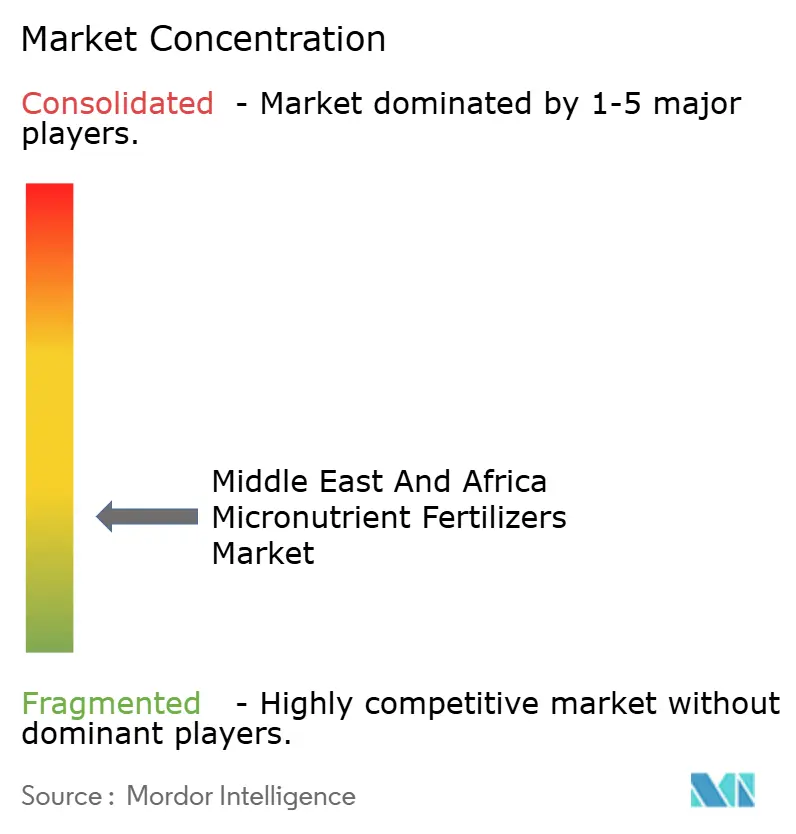
| Market Concentration | Low |
Major Players*Disclaimer: Major Players sorted in no particular order Image © Mordor Intelligence. Reuse requires attribution under CC BY 4.0. | |
Middle East And Africa Micronutrient Fertilizers Market Analysis by Mordor Intelligence
The Middle East and Africa micronutrient fertilizers market size reached USD 281.10 million in 2025 and is forecast to attain USD 404.10 million by 2030, reflecting a robust 7.50% CAGR during the period. This expansion is rooted in widespread soil depletion, intensifying climate pressures, and proactive policy shifts that encourage balanced plant nutrition. Rising temperatures and wind erosion strip critical micronutrients from topsoil, prompting growers to adopt chelated blends that remain stable in high-pH and arid conditions. Governments are reallocating subsidies toward balanced formulations while controlled-environment agriculture hubs in Gulf Cooperation Council nations concentrate demand for precision fertigation inputs. Competitive intensity is increasing as global players introduce nano-delivery technologies and local specialists tailor blends for calcareous soils, yet the market remains fragmented, leaving ample room for regional innovators.
Key Report Takeaways
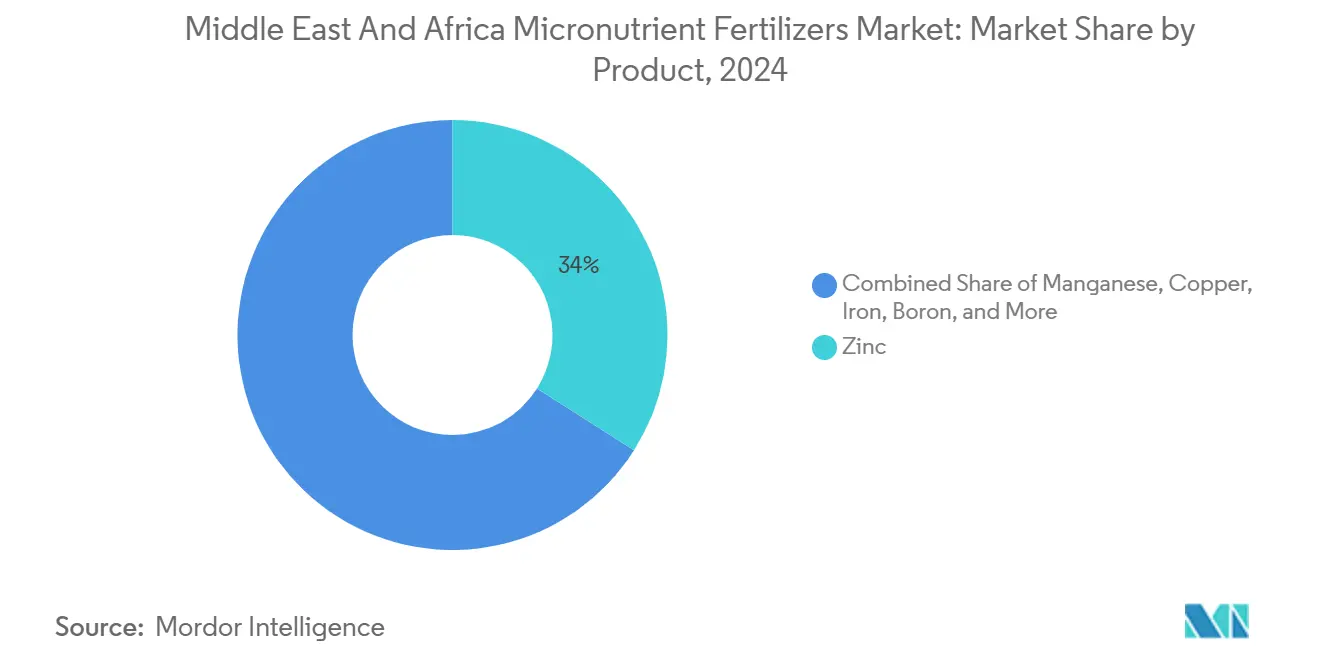
- By product, zinc commanded 34% of the Middle East and Africa micronutrient fertilizers market share in 2024, and molybdenum is advancing at an 8.90% CAGR through 2030.
- By application mode, soil methods accounted for 93.8% of the Middle East and Africa micronutrient fertilizers market size in 2024, while fertigation systems are projected to expand at an 8.20% CAGR to 2030.
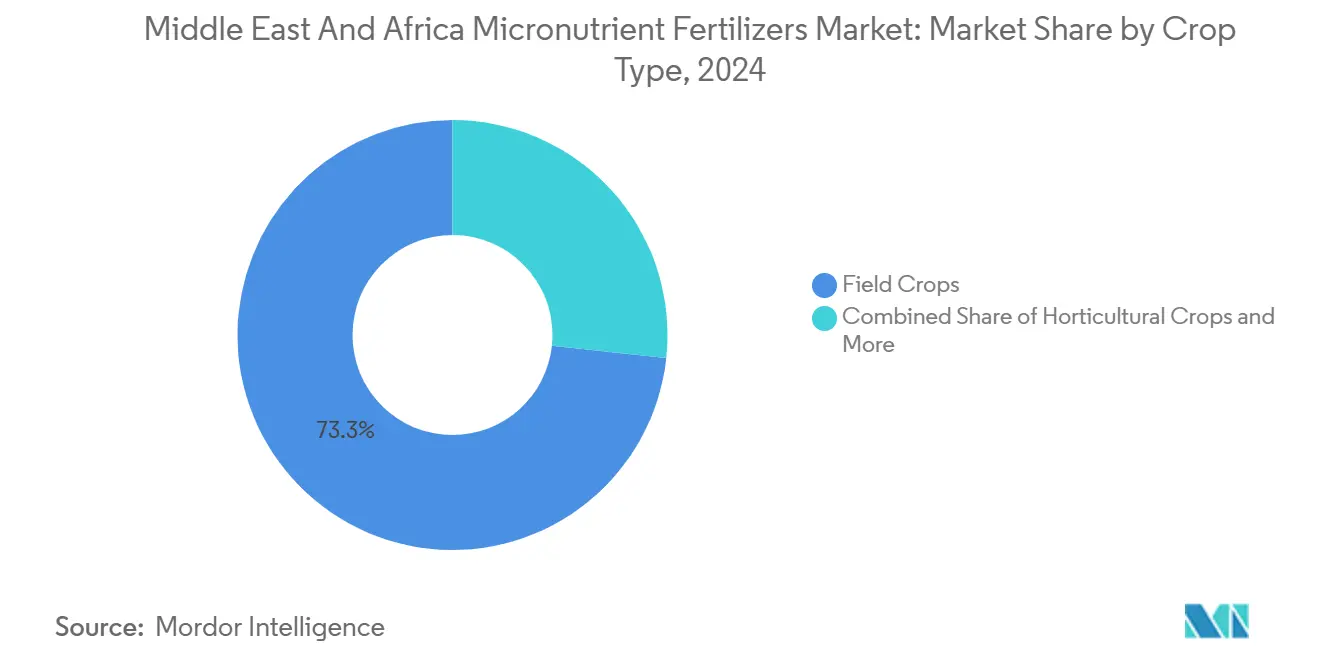
- By crop type, field crops held 73.3% revenue share in 2024, and horticultural crops are forecast to grow at an 8.40% CAGR through 2030.
- By geography, Turkey led with a 16% share of the Middle East and Africa micronutrient fertilizers market in 2024, whereas South Africa is projected to register the highest 8.40% CAGR to 2030.
Middle East And Africa Micronutrient Fertilizers Market Trends and Insights
Drivers Impact Analysis
| Driver | (~) % Impact on CAGR Forecast | Geographic Relevance | Impact Timeline |
|---|---|---|---|
| Climate-Induced Soil Micronutrient Depletion | +2.1% | Region-wide, especially the Sahel and the Arabian Peninsula | Long term (≥ 4 years) |
| Growth of Controlled-Environment Agriculture Hubs | +1.8% | Gulf Cooperation Council (GCC) nations and South African urban centers | Medium term (2–4 years) |
| Government Subsidy Realignment Toward Balanced Fertilization | +1.4% | Nigeria, Egypt, and Morocco, with spillover to West Africa | Short term (≤ 2 years) |
| Emergence of Specialty Chelated Blends for Arid Soils | +1.2% | Turkey, Saudi Arabia, and North African countries | Medium term (2–4 years) |
| Expansion of Zinc-Enriched Staple Food Fortification Mandates | +0.9% | World Health Organization (WHO) program countries and export-oriented producers | Long term (≥ 4 years) |
| Rise of Regenerative Agriculture Certification Schemes | +0.6% | Morocco, South Africa, and Turkey export agriculture products | Medium term (2–4 years) |
| Source: Mordor Intelligence | |||
Climate-Induced Soil Micronutrient Depletion
Soils across the Middle East and Africa are losing zinc, boron, iron, and manganese at an accelerating pace as hotter temperatures and more frequent sandstorms shear away fertile layers. Turkey’s National Soil Health Program documented zinc and boron deficits in 65% of farmland in 2024 and showed a 23% deterioration over the last decade [1]Source: Turkish Ministry of Agriculture and Forestry, “National Soil Health Program 2024,” tarimorman.gov.tr. Laboratory work at King Abdullah University of Science and Technology revealed that sustained soil temperatures above 45 °C cut zinc bioavailability by up to 40% in calcareous fields [2]Source: King Abdullah University of Science and Technology, “Soil Temperature Effects on Micronutrient Bioavailability,” kaust.edu.sa. This nutrient drain triggers yield losses of 15% to 30% and forces growers to adopt chelated blends that remain soluble in alkaline, moisture-scarce conditions. Continued regional warming and erosion mean corrective micronutrient strategies will stay central to farm profitability well past 2030. Satellite imagery corroborates expanding barren patches that align closely with documented micronutrient gaps.
Growth of Controlled-Environment Agriculture Hubs
Gulf nations are channeling unprecedented capital into vertical farms, hydroponic clusters, and climate-controlled greenhouses to improve food self-sufficiency. Saudi Arabia’s NEOM blueprint assigns 10,000 hectares to indoor systems that depend on fully automated fertigation capable of dosing liquid chelates with sub-milliliter accuracy. The United Arab Emirates National Food Security Strategy mobilized USD 2 billion for similar facilities that consume three to five times more micronutrients per hectare than open fields because of higher plant densities and rapid crop cycles [3]Source: UAE Ministry of Climate Change and Environment, “National Food Security Strategy 2051,” moccae.gov.ae. Suppliers respond by formulating ultra-pure liquids that resist precipitation in recirculating lines and by installing cold-chain storage to prevent thermal degradation. As GCC producers scale output for premium local retail and export channels, demand for tech-enabled micronutrient solutions is set to intensify across adjacent markets such as Oman and Bahrain. These large-scale projects also anchor new agritech start-ups that bundle nutrient analytics software with fertigation hardware, enlarging the addressable customer base for specialty chelates.
Government Subsidy Realignment Toward Balanced Fertilization
Regional ministries now tie yield enhancement programs to balanced nutrition rather than macronutrient-only inputs. Nigeria cut import tariffs on micronutrient blends from 20% to 5% in 2024 and earmarked NGN 150 billion (USD 97 million) for fertilizer upgrades that reach smallholders through the Presidential Fertilizer Initiative. Egypt matched this move by trimming duties on chelates to 5% and lifting domestic production subsidies by 40%, while Morocco’s Green Generation plan promotes blended zinc and boron packages for export citrus. These fiscal tools shorten payback periods on specialty inputs, accelerate product registrations, and broaden extension outreach. As demonstration plots validate yield bumps, adoption spreads beyond direct beneficiaries and into privately financed farm operations. Over time, analysts expect these fiscal levers to shift fertilizer sales mixes decisively toward micro-enriched products even in rain-fed smallholder zones.
Emergence of Specialty Chelated Blends for Arid Soils
Chemical innovators are refining the Ethylene diaminetetra acetic acid (EDTA), Ethylenediamine-N,N'-bis(2-hydroxyphenylacetic acid) (EDDHA), and amino-acid chelates to maintain solubility at soil pH above 8.5, where traditional sulfates quickly precipitate. BASF’s Trilon technology stabilizes iron and zinc even under high light and heat conditions, while ICL Group’s new Izmir plant blends region-specific formulations at a rate of 50,000 metric tons per year. Field trials in Turkey and Morocco report 35% to 50% higher uptake efficiency versus sulfate forms, translating into measurable yield and quality gains. Soil laboratories have upgraded equipment to test chelate stability, allowing agronomists to issue element-specific prescriptions rather than generic “micronutrient” advice. The performance edge and growing data support help justify price premiums that can be four to six times higher than conventional alternatives. As agribusiness retailers publish side-by-side field trial results, farmer confidence in premium chelates scales quickly across peer networks.
Restraints Impact Analysis
| Restraint | (~) % Impact on CAGR Forecast | Geographic Relevance | Impact Timeline |
|---|---|---|---|
| Volatile Foreign-Exchange Regimes Impacting Import Costs | −1.8% | Nigeria, Egypt, and Turkey | Short term (≤ 2 years) |
| Fragmented Distribution Networks in Sahel and Horn of Africa | −1.2% | Mali, Niger, Chad, Ethiopia, and Sudan rural areas | Long term (≥ 4 years) |
| Limited Local Production Capacity for Chelated Formulations | −0.9% | Region-wide except South Africa and Turkey | Medium term (2–4 years) |
| Farmer Price Sensitivity Amid Subsidy Phase-Outs | −0.7% | Egypt, Morocco, and Tunisia | Short term (≤ 2 years) |
| Source: Mordor Intelligence | |||
Volatile Foreign-Exchange Regimes Impacting Import Costs
Sharp currency swings elevate landed costs for chelated inputs that rely on Euro- and Dollar-denominated raw materials. The Nigerian Naira slid 68% in 2024, forcing distributors to raise shelf prices by up to 60% for European-sourced. Turkish Lira volatility prompted suppliers to shorten credit terms, eroding affordability for smallholders who depend on seasonal financing. Hedging fees add another 8% to 12% to product pricing, while port congestion triggers demurrage that further bloats costs. Although some companies negotiate local-currency contracts for packaging and logistics, the chelate ligands themselves remain pegged to foreign exchange, locking in residual exposure. This volatility forces importers to hold buffer inventories, tying up working capital that could otherwise fund market development.
Fragmented Distribution Networks in the Sahel and the Horn of Africa
Sparse agro-dealer density and seasonal road blockages hinder product availability in remote zones. Rural Mali and Niger average one dealer per 50 square kilometers compared with one per 10 square kilometers in coastal markets. Many outlets lack refrigeration, so liquid chelates spoil under desert heat, leading retailers to restrict inventory. Seasonal floods can isolate villages for weeks, making just-in-time delivery impossible during peak application windows. Start-up mobile depots reduce last-mile gaps but face high fuel costs and security risks in conflict-prone areas. Lack of after-sales agronomy support in these regions further suppresses repeat purchases, perpetuating thin dealer margins.
Segment Analysis
By Product: Zinc Dominance Supported by Biofortification
Zinc captured 34% share of the Middle East and Africa micronutrient fertilizers market in 2024 because it corrects widespread soil deficiencies and underpins regional grain fortification mandates. The segment’s leadership comes from the dual need to close yield gaps and raise the nutritional value of staple foods.
Molybdenum is forecast to grow the quickest at an 8.90% CAGR through 2030 as legume expansion and nitrogen-fixation programs accelerate its uptake. Iron and manganese blends continue to serve greenhouse tomatoes and peppers, where color and shelf life hinge on balanced trace elements. Copper demand is rising in Morocco’s olives due to its combined nutritional and disease-control properties, and boron remains critical for fruit-quality management in Turkey and Mediterranean vegetables. Suppliers are bundling multi-micronutrient coatings that merge these elements into single granules, simplifying logistics for large cereal farms.
Note: Segment shares of all individual segments available upon report purchase
Get Detailed Market Forecasts at the Most Granular Levels
Download PDF
By Application Mode: Soil Application Remains Predominant
Soil broadcasting and banding held 93.8% of the Middle East and Africa micronutrient fertilizers market share in 2024 because farmers already possess compatible spreaders and because single-pass approaches suit large cereal acreages. Soil delivery provides season-long nutrient availability and lower upfront equipment costs. Fertigation represents the fastest-growing method at 8.20% CAGR. Precision drip and pivot systems in Gulf horticulture and South African orchards require soluble chelates that resist clogging emitters and allow tight dose control.
Foliar sprays are expanding in export vegetables and citrus, where cosmetic quality pays premiums in European retail chains. Drone-based sprayers trialed in Saudi date plantations cut labor requirements and allow uniform canopy coverage. Multimodal programs that combine soil foundational doses with strategic foliar corrections are gaining popularity as local labs offer tissue testing packages that flag deficiencies early in the season.
By Crop Type: Field Crops Anchor Revenue While Horticulture Surges
Field crops accounted for the highest 73.3% share of the Middle East and Africa micronutrient fertilizers market share in 2024. Field crops continue to form the revenue backbone, occupying vast rain-fed and irrigated land banks across Turkey, Egypt, Nigeria, and Morocco. Their dominance reflects both acreage scale and the fundamental need to close sizable yield gaps triggered by soil zinc and boron shortfalls. Governments channel extension resources toward cereal growers because micronutrient-fortified wheat and maize underpin national food-security agendas. In response, fertilizer companies tailor coated granules that combine zinc, boron, and nitrogen in single prills, simplifying adoption for mechanized cereal farms.
Horticultural crops record the fastest growth trajectory, accounting for an 8.40% CAGR to 2030, as premium export returns reward growers who invest in intensive micronutrient regimes that optimize size, color, and shelf life. Citrus, table grapes, berries, and greenhouse tomatoes all demand precise iron and manganese management to prevent chlorosis under alkaline irrigation. Export packhouses in South Africa and Morocco now require tissue-test certificates at intake, effectively mandating compliance with balanced nutrition plans. High-frequency fertigation and drone-assisted foliar sprays let horticultural producers make micro-adjustments during critical fruit-development stages, translating to higher outbound quality scores and reinforcing a steady migration toward specialized micronutrient products.
Get Detailed Market Forecasts at the Most Granular Levels
Download PDF
Geography Analysis
Turkey held 16% of the Middle East and Africa micronutrient fertilizers market in 2024, underpinned by policy-backed soil testing and precision farming initiatives. Provincial labs mapped micronutrient status across 15 regions in 2024, creating a data foundation for variable-rate applications. Wheat, maize, and sunflower growers combine Yara International ASA and Unikeyterra Chemical coated granules with localized foliar zinc to meet biofortification thresholds. Turkey’s supply chain benefits from domestic blending capacity that reduces import exposure and supports regional exports.
South Africa posts the fastest 8.40% CAGR outlook to 2030. Commercial citrus, wine grapes, and macadamia orchards rely on high-purity chelates that maximize fruit color, size, and storage life. Kynoch Fertilizer doubled its liquid chelate capacity in 2024 with a ZAR 180 million (USD 9.8 million) investment. The country’s research universities partner with input firms to trial nano-encapsulated blends that reduce leaching. South Africa also serves as a transshipment node for landlocked neighbors, strengthening its role in regional supply chains.
The diverse production systems spanning Morocco’s irrigated citrus belts, Egypt’s Nile Delta cereals, and Kenya’s highland horticulture create broad demand for customized formulations. Morocco’s citrus exporters apply integrated soil and foliar zinc and iron programs to meet European residue standards. Egypt relies on chelated blends that stay available under alkaline irrigation conditions, which develop around long-term surface water use. As distribution networks mature, micronutrient penetration in secondary markets such as Algeria and Kenya is set to climb.
Competitive Landscape
The Middle East and Africa micronutrient fertilizer market exhibits moderate fragmentation, with the top five suppliers holding a significant combined revenue share. Yara International ASA leads through an extensive distributor network and crop nutrition advisory teams. ICL Group Ltd follows aided by its Izmir chelate plant that customizes blends for alkaline soils. Unikeyterra Chemical and Kynoch Fertilizer leverage local agronomic expertise and agile production lines to serve niche demands such as boron-rich olives and liquid blends for center-pivot systems.
Competition increasingly revolves around technology differentiation. BASF SE expanded Trilon chelate output by 40% in 2024 to meet demand for high-pH stability. Yara International ASA launched the PROCOTE polymer coating in South Africa for controlled micronutrient release under arid conditions. Start-ups offer digital soil testing and variable-rate application services that bundle analytics with product sales. ISO 14855 standards on fertilizer quality and traceability create compliance costs that favor established firms yet leave space for regional specialists with agile logistics.
Opportunities exist in Sahel distribution and nano-delivery systems that reduce application rates while maintaining efficacy. These systems can enhance resource efficiency and address sustainability concerns in agricultural practices. Companies that integrate technical support with micro-credit platforms can target smallholder segments effectively, enabling access to advanced solutions and fostering adoption, particularly once foreign exchange volatility stabilizes.
Middle East And Africa Micronutrient Fertilizers Industry Leaders
Gavilon South Africa (MacroSource, LLC)
ICL Group Ltd
Kynoch Fertilizer
Unikeyterra Chemical
Yara International ASA
- *Disclaimer: Major Players sorted in no particular order
Need More Details on Market Players and Competitors?
Download PDF
Recent Industry Developments
- October 2024: Yara International launched YaraVita PROCOTE micronutrient coating technology in South Africa, representing a USD 15 million investment in advanced formulation capabilities. The technology enables controlled-release micronutrient delivery through polymer coating systems designed for arid soil conditions, addressing the challenge of nutrient loss through leaching and volatilization in high-temperature environments.
- September 2024: ICL Group opened a new specialty fertilizer blending facility in Izmir, Turkey, with USD 25 million investment capacity to serve Middle Eastern and North African markets. The facility specializes in chelated micronutrient formulations optimized for alkaline soils, with production capacity of 50,000 metric tons annually and integrated quality control laboratories for region-specific product development.
- August 2024: Saudi Arabia's Public Investment Fund allocated USD 180 million for controlled-environment agriculture infrastructure development, including specialized micronutrient fertigation systems for the NEOM agricultural project. The investment supports development of 10,000 hectares of climate-controlled growing facilities requiring precision micronutrient management systems and automated delivery technologies.
Middle East And Africa Micronutrient Fertilizers Market Report Scope
Boron, Copper, Iron, Manganese, Molybdenum, Zinc, Others are covered as segments by Product. Fertigation, Foliar, Soil are covered as segments by Application Mode. Field Crops, Horticultural Crops, Turf & Ornamental are covered as segments by Crop Type. Nigeria, Saudi Arabia, South Africa, Turkey are covered as segments by Country.Product
| Boron |
| Copper |
| Iron |
| Manganese |
| Molybdenum |
| Zinc |
| Others |
Application Mode
| Fertigation |
| Foliar |
| Soil |
Crop Type
| Field Crops |
| Horticultural Crops |
| Turf and Ornamental |
Geography
| Nigeria |
| Saudi Arabia |
| South Africa |
| Turkey |
| Rest of Middle East and Africa |
| Product | Boron |
| Copper | |
| Iron | |
| Manganese | |
| Molybdenum | |
| Zinc | |
| Others | |
| Application Mode | Fertigation |
| Foliar | |
| Soil | |
| Crop Type | Field Crops |
| Horticultural Crops | |
| Turf and Ornamental | |
| Geography | Nigeria |
| Saudi Arabia | |
| South Africa | |
| Turkey | |
| Rest of Middle East and Africa |
Need A Different Region or Segment?
Customize Now
Market Definition
- MARKET ESTIMATION LEVEL - Market Estimations for various types of fertilizers has been done at the product-level and not at the nutrient-level.
- NUTRIENT TYPES COVERED - Micronutients: Zn, Mn, Cu, Fe, Mo, B, and Others
- AVERAGE NUTRIENT APPLICATION RATE - This refers to the average volume of nutrient consumed per hectare of farmland in each country.
- CROP TYPES COVERED - Field Crops: Cereals, Pulses, Oilseeds, and Fiber Crops Horticulture: Fruits, Vegetables, Plantation Crops and Spices, Turf Grass and Ornamentals
| Keyword | Definition |
|---|---|
| Fertilizer | Chemical substance applied to crops to ensure nutritional requirements, available in various forms such as granules, powders, liquid, water soluble, etc. |
| Specialty Fertilizer | Used for enhanced efficiency and nutrient availability applied through soil, foliar, and fertigation. Includes CRF, SRF, liquid fertilizer, and water soluble fertilizers. |
| Controlled-Release Fertilizers (CRF) | Coated with materials such as polymer, polymer-sulfur, and other materials such as resins to ensure nutrient availability to the crop for its entire life cycle. |
| Slow-Release Fertilizers (SRF) | Coated with materials such as sulfur, neem, etc., to ensure nutrient availability to the crop for a longer period. |
| Foliar Fertilizers | Consist of both liquid and water soluble fertilizers applied through foliar application. |
| Water-Soluble Fertilizers | Available in various forms including liquid, powder, etc., used in foliar and fertigation mode of fertilizer application. |
| Fertigation | Fertilizers applied through different irrigation systems such as drip irrigation, micro irrigation, sprinkler irrigation, etc. |
| Anhydrous Ammonia | Used as fertilizer, directly injected into the soil, available in gaseous liquid form. |
| Single Super Phosphate (SSP) | Phosphorus fertilizer containing only phosphorus which has lesser than or equal to 35%. |
| Triple Super Phosphate (TSP) | Phosphorus fertilizer containing only phosphorus greater than 35%. |
| Enhanced Efficiency Fertilizers | Fertilizers coated or treated with additional layers of various ingredients to make it more efficient compared to other fertilizers. |
| Conventional Fertilizer | Fertilizers applied to crops through traditional methods including broadcasting, row placement, ploughing soil placement, etc. |
| Chelated Micronutrients | Micronutrient fertilizers coated with chelating agents such as EDTA, EDDHA, DTPA, HEDTA, etc. |
| Liquid Fertilizers | Available in liquid form, majorly used for application of fertilizers to crops through foliar and fertigation. |
Need More Details on Market Definition?
Ask a Question
Research Methodology
Mordor Intelligence follows a four-step methodology in all our reports.
- Step-1: IDENTIFY KEY VARIABLES: In order to build a robust forecasting methodology, the variables and factors identified in Step-1 are tested against available historical market numbers. Through an iterative process, the variables required for market forecast are set and the model is built on the basis of these variables.
- Step-2: Build a Market Model: Market-size estimations for the forecast years are in nominal terms. Inflation is not a part of the pricing, and the average selling price (ASP) is kept constant throughout the forecast period for each country.
- Step-3: Validate and Finalize: In this important step, all market numbers, variables and analyst calls are validated through an extensive network of primary research experts from the market studied. The respondents are selected across levels and functions to generate a holistic picture of the market studied.
- Step-4: Research Outputs: Syndicated Reports, Custom Consulting Assignments, Databases & Subscription Platforms

Get More Details On Research Methodology
Download PDF


