
Market Overview
| Study Period | 2020 - 2031 |
|---|---|
| Forecast Data Period | 2026 - 2031 |
| Base Year Market Size (2025) | USD 4.55 Billion |
| Market Size (2026) | USD 4.75 Billion |
| Market Size (2031) | USD 5.89 Billion |
| Growth Rate (2026 - 2031) | 4.41 % |
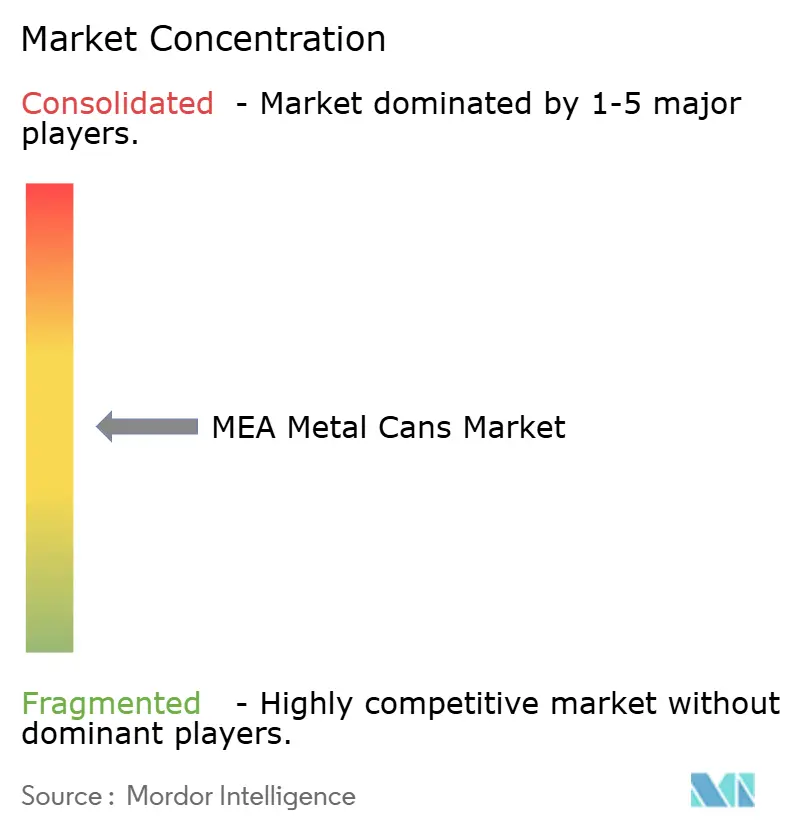
| Market Concentration | Medium |
Major Players *Disclaimer: Major Players sorted in no particular order Image © Mordor Intelligence. Reuse requires attribution under CC BY 4.0. | |
Middle-East And Africa Metal Cans Market Analysis by Mordor Intelligence
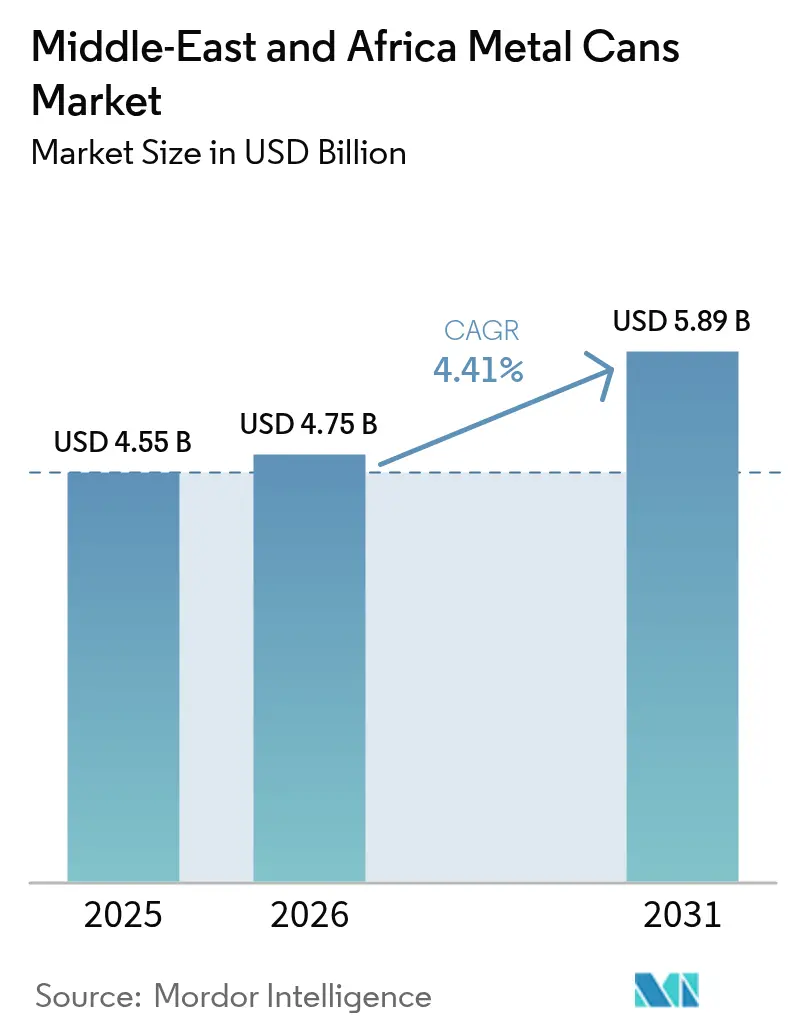
The Middle-East and Africa metal cans market size is expected to grow from USD 4.55 billion in 2025 to USD 4.75 billion in 2026 and is forecast to reach USD 5.89 billion by 2031 at 4.41% CAGR over 2026-2031. Demand climbs on the back of steadily rising disposable incomes, expanding modern retail formats, and government-led sustainability mandates that elevate aluminum recycling across the Gulf. Saudi Arabia’s Vision 2030 localization agenda, Emirates Global Aluminium’s recycling investment and capacity expansions by multiple beverage-can converters create a resilient regional supply even as aluminum price swings persist. Competitive pressure intensifies as new entrants erode historical oligopolies in South Africa, encouraging operational efficiency and lightweighting innovation. Strategic M&A, such as Sonoco’s acquisition of Eviosys, and vertical integration moves by GCC miners into downstream metals further redefine supply chains and customer relationships across the region.
Key Report Takeaways
- By material type, aluminum captured 70.76% of the Middle East and Africa metal cans market share in 2025. Aluminum is projected to expand alongside a robust 5.27% CAGR to 2031.
- By manufacturing process, drawn and ironed lines control 32.29% of 2025, volumesimpact extrusion is projected to expand at a 5.63% CAGR through 2031.
- By can structure, two-piece designs delivered 54.12% share in 2025, monobloc aerosol cans, however, posted the fastest 6.18% CAGR to 2031.
- By capacity/size, the 250-500 ml band held a 30.15% share in 2025, and sub-250 ml packs notch a 4.86% CAGR to 2031.
- By end-user, beverages held 38.05% revenue share in 2025; pharmaceuticals recorded the highest projected CAGR at 5.92% to 2031.
- By geography, Saudi Arabia led with a 37.74% share in 2025, while South Africa advances at a 6.82% CAGR through 2031.
Note: Market size and forecast figures in this report are generated using Mordor Intelligence’s proprietary estimation framework, updated with the latest available data and insights as of 2026.
Market Trends and Insights
Drivers Impact Analysis of Middle-East And Africa Metal Cans Market*
| Driver | (~) % Impact on CAGR Forecast | Geographic Relevance | Impact Timeline |
|---|---|---|---|
| Rising disposable income and modern retail boost packaged F&B demand | +1.2% | GCC and South Africa | Medium term (2-4 years) |
| Government sustainability mandates spur aluminium-can recycling | +0.8% | Kenya, South Africa, UAE | Long term (≥ 4 years) |
| Expansion of GCC beverage-can capacity lowers import reliance | +0.7% | Saudi Arabia, UAE | Short term (≤ 2 years) |
| RTD energy drinks and canned coffee adoption by Gen-Z consumers | +0.9% | Urban MEA | Medium term (2-4 years) |
| Halal-certified canned-food export surge within intra-MEA trade | +0.5% | Egypt-Saudi corridors | Medium term (2-4 years) |
| E-commerce growth drives demand for dent-resistant lightweight packs | +0.6% | UAE and South Africa | Short term (≤ 2 years) |
| Source: Mordor Intelligence | |||
Rising Disposable Income and Modern Retail Boost Packaged FandB Demand
Middle-class expansion across Egypt, Saudi Arabia, and South Africa funnels higher spending into packaged staples and indulgent ready-to-drink beverages. Egypt’s processed-food exports climbed to USD 6.1 billion in 2024, up 21%, underscoring escalating production volumes that favor robust metal protection for shipping-intensive routes.[1] Hypermarket chains proliferate, stocking premium canned products that promise tamper evidence and long shelf life. Vision 2030 aims for 70% industrial localization, channeling fresh demand to domestic can makers. New offerings like a Saudi date-sweetened cola illustrate brand use of lithographed aluminum to differentiate on crowded shelves. Rising oil income cushions further translate into greater acceptance of slightly dearer yet longer-lasting metal packaging.
Government Sustainability Mandates Spur Aluminium-Can Recycling
Kenya’s Extended Producer Responsibility (EPR) law, effective May 2025, obliges can producers to register and finance post-use collection programs. South Africa has enforced similar rules since 2021, pushing Producer Responsibility Organizations to fund national recycling networks. The UAE supports this policy wave through Emirates Global Aluminium’s USD 90 million recycling complex, already 50% complete by May 2025.[2] These statutes lift recovered-metal feedstock availability, granting aluminum a circularity edge over multilayer plastics while supplying converters with lower-carbon billet that meets brand ESG goals.
Expansion of GCC Beverage-Can Capacity Lowers Import Reliance
Localizing manufacture trims logistics costs and currency risk. Gorilla Energy’s planned Jebel Ali plant and Sidel’s packaging MoU with Saudi authorities exemplify fresh investment that narrows the historic gap between fast-growing drink demand and can-making footprint. Abundant low-cost energy and access to bauxite act as structural incentives. Coupled with Egypt’s USD 3.276 billion processed-food exports to Arab neighbors, the GCC can reroute supply across the wider Middle-East and Africa metal cans market faster and at lower landed cost.
RTD Energy Drinks and Canned Coffee Adoption by Gen-Z Consumers
African energy-drink value is set to hit USD 5.93 billion by 2030 with Nigeria racing ahead at 14.14%. Younger buyers demand natural sweeteners, functional additives and Instagram-ready graphics, a checklist best met by high-definition printed aluminum. South Africa already captures roughly 40.13% of regional volumes, yet continual product refreshes spur run lengths that squeeze legacy steel lines. Ready-to-drink coffee gains similar traction in urban centers, pushing converters to adopt slimmer, tactile finishes that fit café-style aesthetics.
Restraints Impact Analysis of Middle-East And Africa Metal Cans Market*
| Restraint | (~) % Impact on CAGR Forecast | Geographic Relevance | Impact Timeline |
|---|---|---|---|
| Flexible plastics substitution in price-sensitive food segments | -0.9% | Sub-Saharan Africa, price-sensitive consumer segments | Medium term (2-4 years) |
| Volatile primary-aluminium premiums amid geopolitical supply risk | -1.1% | Global, with acute impact on import-dependent markets | Short term (≤ 2 years) |
| Weak post-consumer metal-collection systems in Sub-Saharan Africa | -0.7% | Sub-Saharan Africa, rural and peri-urban areas | Long term (≥ 4 years) |
| Regulatory uncertainty over BPA/PFAS can-linings | -0.6% | EU regulations affecting MEA exports, regulatory-sensitive markets | Medium term (2-4 years) |
| Source: Mordor Intelligence | |||
Flexible Plastics Substitution in Price-Sensitive Food Segments
Large rural populations still base purchase decisions on unit cost, giving lightweight pouches an edge for staples like tomato paste or rice. Suppliers such as UFlex run 40,000 TPA film in the UAE and 114,000 TPA in Egypt, marketing metallized BOPET that mimics the barrier levels of cans at lower material weight. Senegal’s 35% import tariffs on processed foods accentuate cost pressures, steering fillers to cheaper substrates. To stem share loss, can makers emphasize 100% recyclability, flavor neutrality and resistance to pilferage in remote logistics chains.
Volatile Primary-Aluminium Premiums Amid Geopolitical Supply Risk
Exchange inventories dipped 10% on the LME and 30% on the SHFE by May 2025, lifting premiums for physical delivery. Trade actions from U.S. tariffs on Canadian billet to sanctions on Russian output cascade into higher inbound costs for Middle-East and Africa converters. Lacking hedging sophistication, mid-tier players face margin erosion whenever they cannot swiftly adjust contract pricing. While scrap-based billet offers partial relief, investments in recycling still lag near-term demand surges, magnifying the impact on the Middle-East and Africa metal cans market.
*Our forecasts treat driver/restraint impacts as directional, not additive. The impact forecasts reflect baseline growth, mix effects, and variable interactions.
Middle-East And Africa Metal Cans Market Segment Analysis
By Material Type:
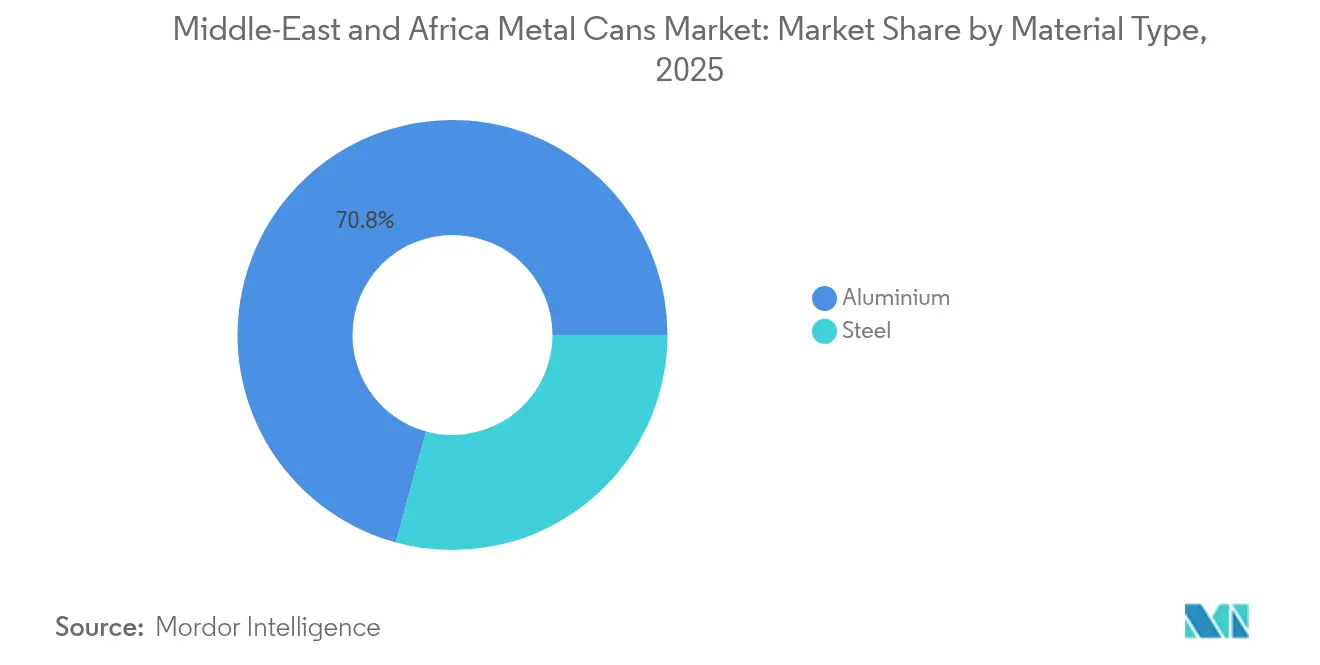
Aluminum Dominance Drives Sustainability TransitionAluminum retained 70.76% of the Middle-East and Africa metal cans market share in 2025, vastly outstripping steel thanks to its 100% recyclability and favorable weight-to-strength ratio. Aluminum’s superior circularity aligns with new EPR schemes and brand decarbonization targets, prompting producers to channel capex into billet casting and in-house scrap recovery. Emirates Global Aluminium’s half-built recycling hub highlights this pivot, promising regional access to low-carbon feed that could unlock further lightweighting. Steel continues serving large-format food and industrial cans where impact resistance outweighs weight penalties; yet BPA substitute rules and higher freight costs curb its longer-term appeal. Novelis projects 4% annual demand growth for aluminum beverage sheet through 2031, underscoring confidence in the alloy’s trajectory.
The Middle-East and Africa metal cans market size for aluminum is projected to expand alongside a robust 5.27% CAGR to 2031, supported by GCC mining deals totaling USD 9.32 billion that assure upstream supply. Regulatory carrots such as reduced EPR fees for high-recycled-content packs reinforce alloy uptake in beverage, pharmaceutical, and cosmetic lines. Steel’s future hinges on cost leadership and niche applications like retortable 3-piece cans for industrial sauces, where thickness and dent resistance remain critical.

By Can Structure:
Two-Piece Leadership Meets Aerosol InnovationTwo-piece designs delivered 54.12% share in 2025 due to their material-efficient draw and iron process that suits high-volume colas and energy drinks. Their thinner walls lower shipping mass, a boon for e-commerce distributors now handling rising beverage traffic. Monobloc aerosol cans, however, post the fastest 6.18% CAGR as personal care, household, and pharmaceutical sprays proliferate across emerging urban centers. Ball Corporation produces 1.2 billion aluminum aerosols annually, most carrying the Aluminum Stewardship Initiative certification that resonates with eco-minded shoppers. Three-piece formats survive where can height exceeds D&I limits, notably in powdered milk tins and bulk edible-oil packs.
Aerosol innovation centers on ultra-smooth internal coatings and dimensional accuracy for medical inhalers. Specialist firms apply plasma fluorocarbon layers to ensure zero drug interaction and accurate dosage control as Middle-East and Africa pharmacies broaden OTC shelves, demand for GMP-compliant aluminum canisters accelerates, widening the opportunity pool for highly automated extrusion lines. Converters simultaneously refine two-piece lines with taller draw ratios, enabling slim 250 ml cans popular among Gen-Z coffee drinkers.
By Capacity/Size:
Mid-Range Dominance Shifts to Small-Format GrowthThe 250-500 ml band held 30.15% share in 2025, favored by mainstream carbonated drinks and cost-per-milliliter efficiency. Yet sub-250 ml packs notch a 4.86% CAGR, propelled by premium energy shots, functional beverages, and portion-controlled cocktails. Gorilla Energy’s planned Halal-certified range employs sleek 250 ml cans to deliver portability and pricing tiers acceptable to a broad demographic. Digital grocery shoppers also prefer smaller volumes that fit congested last-mile boxes, cutting dent risk and return rates.
At the opposite end, 500-1,000 ml formats anchor family-size ready meals and canned fruit, especially within Egypt’s export-oriented processors. Above-1-liter containers serve industrial ingredients, paint, and lubricants; however, their slower category growth motivates can makers to redirect line upgrades toward faster-moving small formats. Fee structures under South Africa’s EPR make per-unit costs for oversized packs steeper, incentivizing fillers to downsize where possible without hurting value perception.
By Manufacturing Process:
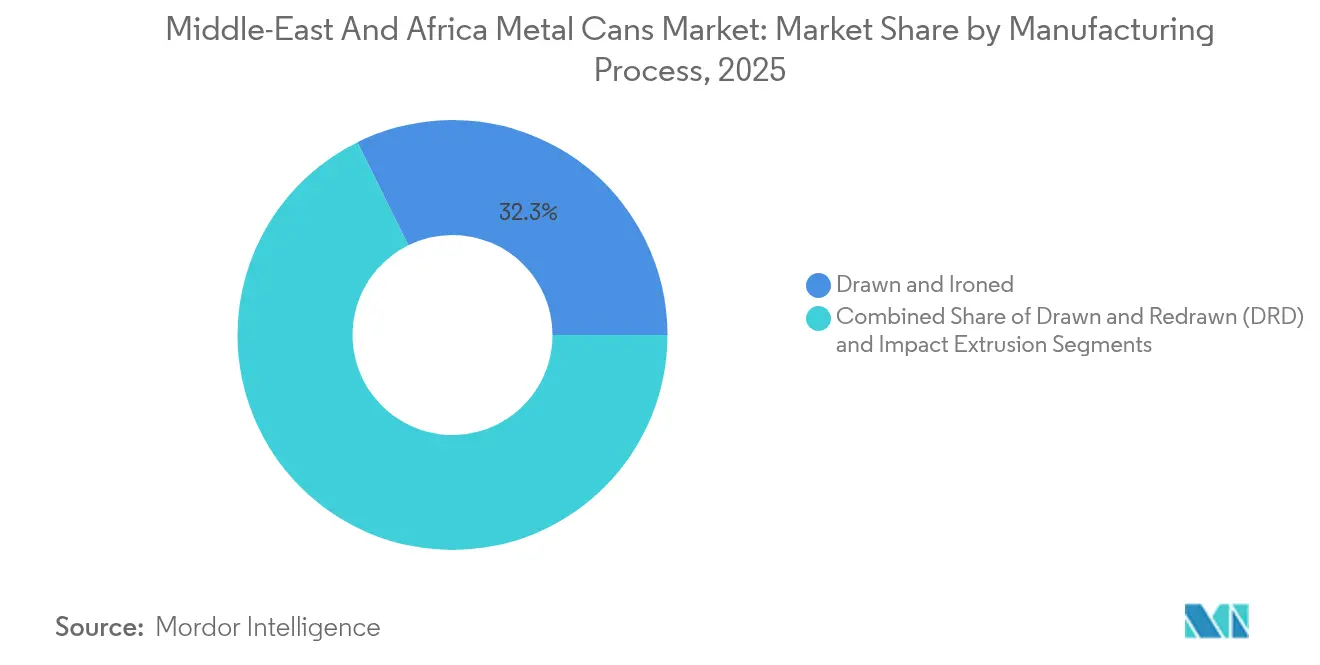
D&I Leadership Faces Impact-Extrusion InnovationDrawn and ironed lines control 32.29% of 2025 volumes, underpinning beverage giants’ need for 2,000-cpm speeds and thin-wall accuracy. Ongoing R&D reduces wall thickness by another 3-5%, lowering alloy consumption without sacrificing stack strength. Impact extrusion logs a 5.63% CAGR, oriented toward aerosol, pharma, and luxury personal-care niches where tighter dimensional tolerances and chamfer-free shoulders are mandatory. Anomatic’s cGMP facility, able to anodize 2.5 billion units yearly, displays how surface-treatment depth and color consistency attract health-and-beauty brands.
The Middle-East and Africa metal cans market size generated by D&I technology benefits from integrated coil-coating and water-treatment systems that shrink carbon footprints. Meanwhile, impact extruders experiment with uni-alloy formats that simplify recycling streams, a goal advanced by Novelis and DRT’s 99% recycled-content can-end program. Process choice thus becomes a strategic lever balancing capex, sustainability metrics, and application specificity.
By End-User Industry:
Beverage Dominance Meets Pharmaceutical AccelerationBeverages retained 38.05% segment share in 2025, buoyed by carbonated soft drinks, craft malts, and an expanding repertoire of functional tonics. Energy-drink marketers rotate flavors quarterly, necessitating flexible tooling and vibrant graphics that aluminum readily provides. The pharmaceutical channel, though smaller, is set to post a 5.92% CAGR as inhalers, topical sprays, and sterile saline aerosols gain market depth amid rising chronic respiratory cases. Tri-Pac’s 10 million-unit aerosol line addition exemplifies supplier readiness to meet GMP and ISO 13485 needs.
Food canning remains vital, powered by Egypt’s USD 6.1 billion processed-food exports and halal protein shipments to Gulf buyers. Personal-care and cosmetics capitalize on monobloc cans’ replicable mirror finishes, reinforcing brand premium cues. Lubricants and industrial fluids require resistant internal lacquers, but volumes grow more modestly alongside regional automotive-fleet expansion.
Geography Analysis
Saudi Arabia Metal Cans Market
Saudi Arabia anchors 37.74% of the Middle-East and Africa metal cans market share, leveraging Vision 2030’s industrial roadmap that targets USD 241.7 billion in industrial GDP by 2030, following conversion from 895 billion SAR at 2025 exchange rates. Localization pledges draw global can-line vendors to Riyadh as authorities dangle loan guarantees and tariff privileges. Aluminum smelters integrated with cheap natural gas deliver cost advantages few rivals can match.
South Africa Metal Cans Market
South Africa, advancing at a 6.82% CAGR, rides beverage-can investment by four competing converters plus established scrap-collection networks nurtured under its EPR law. Rising e-commerce penetration and improving consumer confidence spur premium RTD launches that demand photorealistic can art and matte varnishes. The country’s port links enable onward shipment to fast-growing hinterland states.
MEA Metal Cans Market
Egypt blends low labor cost with Suez Canal proximity, feeding canned legumes and fish to Arab partners that absorbed USD 3.276 billion of its processed-food output in 2024. Nigeria’s surge in used-can exports underlines West Africa’s ambition to join the circular-metal economy, while Kenya’s 2025 EPR statute signals East Africa’s pivot toward formal recycling systems. Together, these diverse markets create a patchwork of regulatory, cost, and consumer variables that global brand owners address via multi-plant strategies and agile sourcing across the wider Middle-East and Africa metal cans market.
Regulatory Landscape
Regulation in the Middle East and Africa metal cans market increasingly links market access to documented food-contact compliance and recyclability performance. In Saudi Arabia, the Saudi Food and Drug Authority (SFDA) sets hygiene and food-contact requirements for packaging, including migration and contamination controls aligned with GCC standards for food packages. This affects can-body lacquers and end coatings used for beverages and food. In the UAE, the Ministry of Industry and Advanced Technology (MoIAT) applies conformity assessment pathways, including ECAS and the Emirates Quality Mark, for regulated products, so certificates of conformity become a practical gating item for import clearance and for brand owners auditing packaging suppliers.
Across Africa, extended producer responsibility (EPR) and design-for-recycling guidance are tightening. South Africa, through the Department of Forestry, Fisheries and the Environment (DFFE), has issued a Packaging Guideline on Recyclability by Design that pushes converters and fillers toward material choices and label-ink systems compatible with existing collection and recycling flows. Kenya enforced an EPR regime from May 2025 for packaging, expanding producer obligations for collection and recycling financing and increasing the importance of traceability and recyclability documentation for can suppliers serving FMCG customers.
Value Chain Analysis
The value chain runs from aluminum and steel inputs (primary metal, recycled scrap, and coated sheet) through conversion (sheet rolling, coating and printing, can and end manufacturing) to filling and distribution across modern retail and foodservice, with cross-border flows linking North Africa, the Gulf, and Sub-Saharan markets. Aluminum dominates the regional mix, with 70.76% share in 2025, and upstream moves to increase recycled feedstock, such as Emirates Global Aluminium progressing its UAE recycling facility in 2025, help reinforce a supply base for beverage and aerosol conversion. Converters operate high-speed D&I lines for two-piece beverage cans and impact extrusion for monobloc aerosol formats, with regional players such as Southern Can Making Company (SCMC), Gulf Cans Industries, and NCCANS positioned around Gulf logistics corridors serving local fillers and export routes.
Downstream demand concentrates in beverage, food, and growing aerosol and pharma users, where lead times, decoration capability, and quality certifications influence supplier selection. Localization and import-substitution efforts show up in Saudi-linked manufacturing ecosystems, including Aljomaih Cans and Ends Making Plant, which shifted focus toward aluminum can lines, and in 2026 announcements such as Consolidated Can Manufacturing Co. (CCMC) describing capacity additions from its Jeddah hub for multiple markets. The main constraints include exposure to primary-aluminum premium swings and uneven post-consumer collection systems in parts of Sub-Saharan Africa, which can limit recycled-content scaling and raise working-capital needs for mid-tier converters.
Competitive Landscape
Rivalry has intensified from South Africa to the Gulf as new entrants fracture once-concentrated supply. Nampak’s share in South African beverage cans has thinned since 2018, with three additional producers now active, compressing margins but spurring cost savings programs, IOL.. Globally, Sonoco’s USD 3.9 billion takeover of Eviosys stitched 44 plants across 17 nations into a formidable food and aerosol platform that can leverage procurement scale to underprice smaller African players.[3]CANPACK’s pending merger with Giorgi indicates further consolidation momentum.
Technology partnerships define the next frontier. Novelis teams with DRT to commercialize can ends made from 99% recycled alloy, lowering Scope 3 emissions for beverage majors. Ball patents holographic over-varnish systems that lift shelf standout, and Constellium pushes Aeral D&I barrels that shave 30% weight. Local champions respond by installing quality-vision systems and switching to water-based inks to satisfy multinational audit criteria.
Sustainability credentials now tip many purchase decisions. Aluminium Stewardship Initiative or ISO 14001 certifications increasingly sit alongside ISO 13485 and cGMP on tender scorecards, closing doors to converters lacking documented traceability. Capital is therefore channelled into closed-loop scrap capture, renewables-powered smelters, and lightweighting R&D as firms jockey for long-term supply contracts in the expanding Middle-East and Africa metal cans industry.
Middle-East And Africa Metal Cans Industry Leaders
-
ARYUM Metal Alüminyum Tüp Sanayi ve Ticaret A.Ş.
-
Ball Corporation
-
Crown Holdings, Inc.
-
SAPIN Saudi Arabian Packaging Industry Co. Ltd.
-
Avon Crowncaps and Containers Nigeria Ltd.
- *Disclaimer: Major Players sorted in no particular order
Middle-East And Africa Metal Cans Market Companies Covered in this Report
- ARYUM Metal Alüminyum Tüp Sanayi ve Ticaret A.S.
- Ball Corporation
- Crown Holdings, Inc.
- SAPIN Saudi Arabian Packaging Industry Co. Ltd.
- Avon Crowncaps and Containers Nigeria Ltd.
- Nampak Limited
- CANPACK S.A.
- Middle East Metal Can LLC
- Gulf Cans Industries LLC
- CanSmart (Pty) Ltd.
- Ardagh Group S.A.
- Silgan Containers LLC
- Trivium Packaging B.V.
- CCL Industries Inc.
- Novelis Inc.
- Toyo Seikan Group Holdings, Ltd.
- Mahmood Saeed Beverage Cans and Ends Industry Co. Ltd.
- ORG Technology Co., Ltd.
- Hindustan Tin Works Limited
- Sidel Group
Read Analysis of Middle-East And Africa Metal Cans Companies
Market Opportunities and Future Outlook
White-space is most visible where policy-backed recycling and localization intersect with high-throughput beverage demand and higher-spec aerosol and pharmaceutical formats. Kenya enforcing EPR from May 2025 and South Africa formalizing design-for-recyclability practices are prompting brand owners and converters to document recyclability performance and strengthen traceability, which creates room for suppliers that can deliver certified, audit-ready metal packaging and support higher recycled-content inputs. Build-out of regional recycling capacity, including Emirates Global Aluminium’s UAE recycling project milestone in 2025, also supports opportunities for lower-carbon aluminum feedstock and can lightweighting programs that reduce material intensity while maintaining stack strength for e-commerce and long-haul distribution.
New conversion and printing investments also open space for regional supply substitution. Crown Holdings announced an investment in July 2024 to double capacity at its Tunis beverage can plant to over 1.2 billion cans per year, reflecting continued pull for beverage can supply in North Africa and nearby export lanes. In Egypt, Massoud Steel signed a contract in April 2025 to build an EGP 965 million metal packaging facility in the Sokhna Industrial Zone in the Suez Canal Economic Zone, positioned around tinplate printing and dedicated metal packaging capabilities. For can makers, the clearest near-term commercial pathways concentrate on (i) high-graphics aluminum beverage cans for RTD and energy-drink portfolios and (ii) monobloc aerosol and pharma cans where coating performance, dimensional control, and GMP-aligned manufacturing distinguish suppliers beyond price.
Recent Industry Developments in Middle-East And Africa Metal Cans Market
- May 2026: Ball Corporation highlighted continued aluminum beverage packaging operations across its EMEA footprint, including manufacturing presence referenced for Egypt and Turkey. Keeping production embedded in the wider region supports faster service levels for multinational beverage customers that route supply across Middle East and Africa trade lanes and helps stabilize can availability amid metal price volatility.
- May 2025: Emirates Global Aluminium reached the 50% construction milestone for its UAE aluminum recycling plant. The project strengthens regional access to recycled feedstock, supporting higher recycled-content can sheet and reinforcing sustainability-driven procurement across beverage and food can applications.
- July 2024: Crown Holdings announced an investment to double annual production capacity at its metal beverage can plant in Tunis, Tunisia, to over 1.2 billion cans. The capacity step-up increases regional conversion headroom for beverage brands and can reduce reliance on longer-distance imports for North Africa and adjacent export markets.
Middle-East And Africa Metal Cans Market Report Scope and Research Methodology
Market Definition and Coverage
This market covers the value of metal cans used as packaging across the Middle East and Africa, counted at the point where cans are supplied into end-use packaging demand.
Scope exclusions: Glass, plastic, paper-based packs, and flexible packaging formats are excluded, even when they compete with cans in the same end uses.
Segments Covered in This Report
- By Material Type
- Aluminium
- Steel
- By Can Structure
- Two-Piece
- Three-Piece
- Monobloc Aerosol
- By Capacity / Size
- ≤250 ml
- 250-500 ml
- 500-1,000 ml
- >1,000 ml
- By Manufacturing Process
- Drawn and Ironed (D&I)
- Drawn and Redrawn (DRD)
- Impact Extrusion
- By End-User Industry
- Food
- Beverage
- Personal Care and Cosmetics
- Pharmaceuticals
- Paints and Industrial Chemicals
- Automotive Fluids and Lubricants
- Other End-User Industries
- By Geography
- Middle East and Africa
- Middle East
- Saudi Arabia
- United Arab Emirates
- Turkey
- Rest of Middle East
- Africa
- South Africa
- Nigeria
- Egypt
- Rest of Africa
- Middle East
- Middle East and Africa
Data Sources, Market Sizing, and Validation
Desk Research
Desk work started by mapping demand signals that can be checked consistently across the Middle East and Africa, then linking those signals to can usage patterns. For that mapping, we relied on public and official sources such as national statistics offices, customs and tariff portals that publish trade by HS codes, and central bank releases for inflation and currency context.
To keep assumptions realistic, we also reviewed food and beverage and consumer goods output indicators from sources such as UNIDO, UN Comtrade, and selected government industry ministries. We then used association publications (for example, packaging and aluminum or steel bodies) for context on recycling, regulation, and format shifts. Company annual reports, investor presentations, and reputable business press were used to validate plant announcements, capacity additions, and pricing commentary, and a paid subscription for company financials and news intelligence was used only to cross-check revenues and corporate actions where disclosures were limited. These desk research sources are illustrative and not exhaustive, since many other public documents were also referenced to collect data, validate it, and clarify gaps.
Primary Interviews and Surveys
Primary work was used to pressure-test the desk assumptions, especially around can mix by end use, typical pricing progression, and how fast substitution between metal, PET, and glass is happening in key countries. Interviews covered a spread of participants across the value chain, including can makers, raw material and coating ecosystem roles, brand owners, and packaging procurement teams. Inputs were then compared across regions, so outlier views were followed up before the model assumptions were locked.
Distribution of primary research fieldwork respondents
| Company type | Respondent position |
|---|---|
| Top tier: 38% | CXOs: 16% |
| Mid tier: 41% | Functional/Unit leaders: 32% |
| Smaller Players: 21% | Managers: 52% |
Market-Sizing & Forecasting
Sizing was built using a top-down and bottom-up combination, where the main path starts from country-level demand pools and packaging consumption signals, then translates that into metal can value using can penetration and pricing logic. In practice, production and trade data are used to reconstruct the regional flow of relevant metal can formats, followed by country splits that reflect where packaged food, beverage, and aerosol demand is concentrated.
To keep the model anchored, we used market fingerprints such as packaged beverage output and consumption trends, processed food volumes and import reliance, aerosol and personal care production indicators, and trade movements for can-related products and inputs (where codes are usable at a practical level). Pricing and value conversion were guided by interviewed ranges for typical can price movements, alloy and steel input direction, and the mix across aluminum, steel, and can structures that shifts the average value per unit.
For forecasting, scenario analysis was used so faster and slower adoption paths could be reflected, then the final view was centered on the scenario that most interviewees aligned with for demand growth and pricing. Bottom-up checks were added by sampling supplier and country revenue footprints, plus a simple volume times average selling price approximation in markets where demand signals are strongest. Gaps were handled by using conservative proxies from comparable countries, then reviewed again during validation.
Data Validation & Update Cycle
Outputs were validated through triangulation across desk indicators, interview feedback, and internal consistency checks, so the totals align with regional consumption and trade realities. When a country showed a sharp swing versus its macro demand indicators, the inputs were re-checked, and follow-up calls were triggered to confirm whether the change came from pricing, mix shift, or a one-time supply event.
Before sign-off, the model is reviewed in more than one step so unit logic, currency conversion timing, and year-on-year movements are checked for avoidable errors. The report is refreshed annually, and interim updates are made when material events occur, such as large capacity moves, sudden trade restrictions, or major end-use demand disruptions. Right before delivery, a fresh analyst pass is completed so clients receive the most current view available.
Mordor Intelligence's Middle East and Africa Metal Cans Market Size Compared Against Other Published Estimates
Different published numbers for this market are common because the underlying scope is not always aligned, and because some estimates lean more on production capacity stories while others lean on end-use demand. Timing also matters, since currency movements and metal input price swings can shift the same physical demand into a different USD value.
Aerosol monobloc cans are included inside Mordor Intelligence's scope, which can lift totals versus sources that mainly track beverage and food can formats or only report a limited set of two-piece structures.
Benchmark comparison
| Source | Market Size | Gaps in Research Methodology |
|---|---|---|
| Mordor Intelligence | USD 4.55 B (2025) | |
| Global Consultancy A | USD 5.48 B (2025) | This figure appears to run with a broader value capture by product structure and may apply a higher average value per can, which can happen when mix skews toward premium beverage formats and price escalation is applied more aggressively. |
| Regional Consultancy B | USD 3.50 B (2023) | This estimate is anchored to an earlier base year and seems to rely more on a high-level demand narrative, which can understate the market when later-year inflation, currency shifts, and end-use recovery are not fully carried into the USD series. |
Taken together, the spread is mainly explained by what can types are counted, which year is used as the reference, and how average pricing is moved forward. By keeping the variable set tied to observable demand signals and then re-checking it through interviews and simple roll-up tests, the final value stays traceable and repeatable when the model is updated.
Key Questions Answered in the Report
How large is the Middle-East and Africa metal cans market in 2026?
It is valued at USD 4.75 billion, with a projected 4.41% CAGR to 2031.
Which material dominates metal can production across the region?
Aluminum leads with 70.76% market share, supported by strong recycling initiatives and lightweighting advantages.
Why is South Africa forecast to grow faster than other markets?
Four active can manufacturers, robust EPR recycling infrastructure and rising RTD beverage launches fuel a 6.82% CAGR.
Which end-user sector shows the highest growth momentum?
Pharmaceuticals post the fastest CAGR at 5.92% thanks to expanding aerosol drug delivery formats.
What regulatory shift most affects future packaging choices?
New EPR laws in Kenya and stricter frameworks in South Africa reward highly recyclable aluminum cans over multilayer plastics.
How are producers addressing aluminum price volatility?
Investments in regional recycling capacity, hedging strategies and alloy lightweighting help offset raw-material premium swings.