
Market Overview
| Study Period | 2020 - 2031 |
|---|---|
| Forecast Data Period | 2026 - 2031 |
| Base Year Market Size (2025) | USD 2.9 Billion |
| Market Size (2026) | USD 3.33 Billion |
| Market Size (2031) | USD 6.68 Billion |
| Growth Rate (2026 - 2031) | 14.95 % |
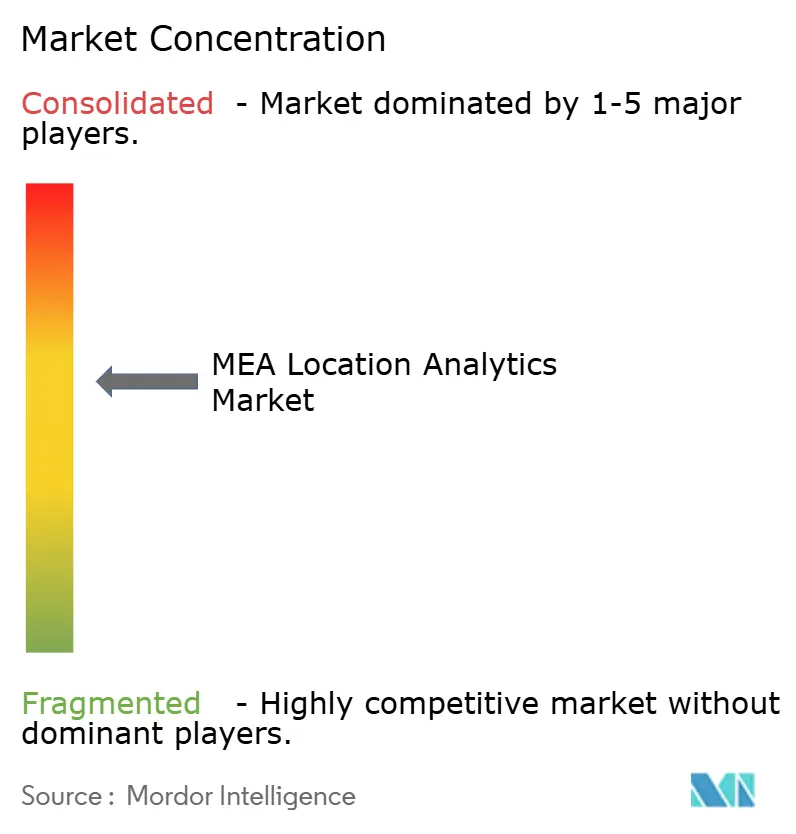
| Market Concentration | Medium |
Major Players *Disclaimer: Major Players sorted in no particular order Image © Mordor Intelligence. Reuse requires attribution under CC BY 4.0. | |
MEA Location Analytics Market Analysis by Mordor Intelligence
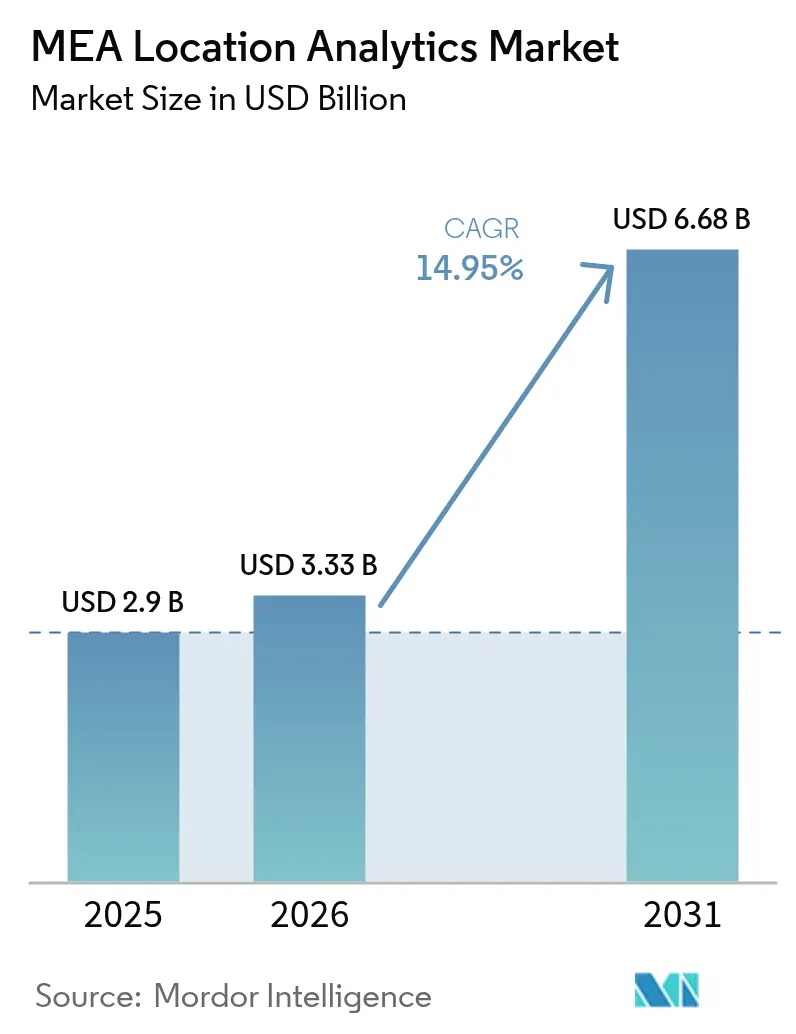
The MEA location analytics market size in 2026 is estimated at USD 3.33 billion, growing from 2025 value of USD 2.9 billion with 2031 projections showing USD 6.68 billion, growing at 14.95% CAGR over 2026-2031. Surging smart-city investments across the Gulf Cooperation Council (GCC) are expanding demand for spatial intelligence, while 5G deployments and sovereign cloud rollouts improve the speed and security of data gathering and processing. Outdoor analytics remains dominant because large-scale mobility and infrastructure projects require continuous geodata feeds for traffic, safety, and urban-services optimization. At the same time, the fusion of indoor and outdoor tracking is reshaping e-commerce logistics, and digital twin initiatives for mega-projects such as NEOM are pushing vendors to deliver higher-frequency data and real-time visualization. Regulatory focus on data sovereignty is guiding architecture choices toward local or sovereign clouds, and mounting skills shortages in geospatial analytics are elevating the role of specialized service providers. [3]
Key Report Takeaways
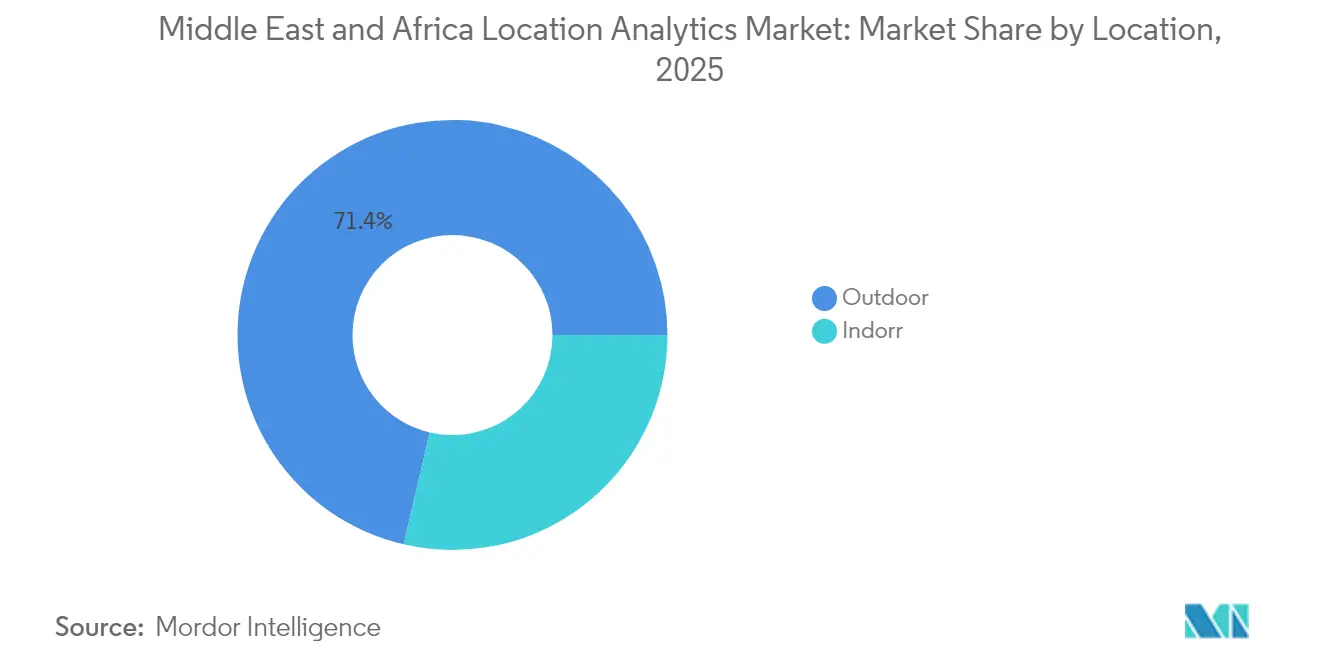
- By location, outdoor solutions held 71.35% of the MEA location analytics market share in 2025, while indoor solutions are projected to grow fastest at a double-digit CAGR through 2031.
- By deployment model, cloud captured 65.40% of the MEA location analytics market in 2025 and is set to expand at 19.18% CAGR between 2026-2031.
- By application, remote monitoring led with 43.55% share of the MEA location analytics market size in 2025, whereas asset management is expected to record an 17.86% CAGR to 2031.
- By component, software accounted for 60.25% of the MEA location analytics market size in 2025, but services are advancing at a 20.45% CAGR.
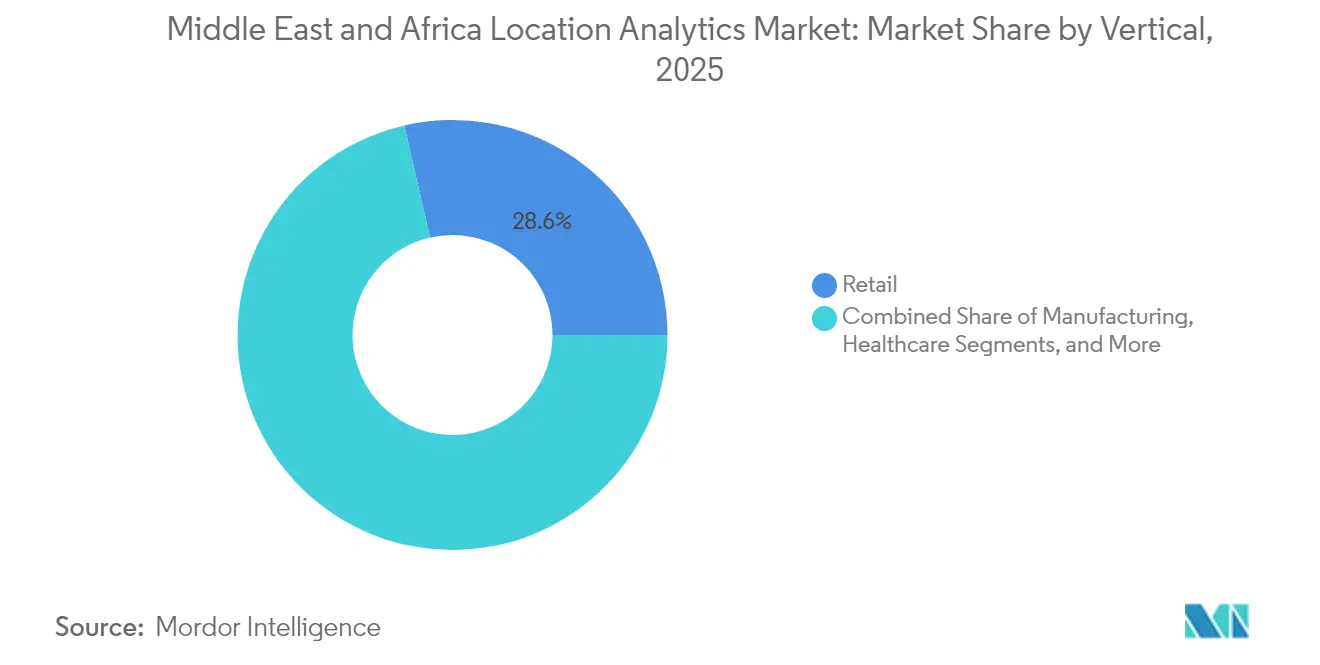
- By vertical, retail commanded 28.60% of the MEA location analytics market in 2025; government is forecast to register the fastest 16.72% CAGR through 2031.
Note: Market size and forecast figures in this report are generated using Mordor Intelligence’s proprietary estimation framework, updated with the latest available data and insights as of 2026.
MEA Location Analytics Market Trends and Insights
Drivers Impact Analysis*
| Driver | (~) % Impact on CAGR Forecast | Geographic Relevance | Impact Timeline |
|---|---|---|---|
| Proliferation of IoT sensors in GCC smart-city programmes | +4.2% | UAE, Saudi Arabia, Qatar | Medium term (2-4 years) |
| Accelerated 5G small-cell rollout enabling real-time analytics | +3.7% | UAE, Saudi Arabia, Israel | Short term (≤ 2 years) |
| Cloud-first GIS/BI adoption across retail and government | +2.9% | UAE, Saudi Arabia, Israel, Other Countries | Medium term (2-4 years) |
| Mandatory ESG geo-reporting for large energy projects | +1.8% | Saudi Arabia, UAE | Long term (≥ 4 years) |
| Source: Mordor Intelligence | |||
Proliferation of IoT Sensors in GCC Smart-City Programmes
Ubiquitous sensor networks in Riyadh, Dubai, and Doha generate continuous geotagged streams that demand powerful analytics platforms capable of real-time ingestion and visualization. Dubai has implemented more than 200 smart services, while Makkah is integrating LoRa-enabled devices to maintain connectivity in mountainous terrain during the Hajj season. Municipal agencies use these data flows to predict traffic density, optimize waste collection, and monitor public safety incidents. The resulting data volume pushes city authorities to adopt edge processing and AI algorithms that filter and analyze information at the source, accelerating decision-making. As pilot deployments shift to full production, municipal tenders increasingly specify open APIs and multi-protocol compatibility, encouraging a broader supplier ecosystem.
Accelerated 5G Small-Cell Rollout Enabling Real-Time Analytics
Widespread 5G coverage in GCC capitals delivers sub-10-millisecond latency, allowing advanced applications such as autonomous shuttles, drone-based inspection, and augmented-reality wayfinding. Operators collaborate with municipal planners to embed small cells in street furniture, which improves signal density for high-resolution tracking and video analytics. The new bandwidth permits live streaming of high-definition 3D maps to control rooms, enhancing emergency response coordination. Enterprises across oil, utilities, and logistics verticals are aligning network upgrades with analytics roadmaps, citing the need for uninterrupted data flows from mobile assets. Early adopters report operational cost savings from predictive maintenance once edge AI processes sensor alerts locally. [1]
Cloud-First GIS/BI Adoption Across Retail and Government
GCC cloud policies encourage agencies and enterprises to migrate spatial workloads from legacy servers to sovereign or regional clouds hosted by hyperscalers with local data centers. Retail groups leverage scalable compute to run footfall heat-maps for hundreds of stores, cutting forecasting cycles from days to hours. Government GIS departments consolidate disparate cadastral, traffic, and environmental layers into unified cloud data lakes, improving cross-agency collaboration. Service providers respond by offering managed location-platform-as-a-service bundles that include ingestion pipelines, spatial databases, and API gateways. These turnkey models lower the adoption barrier for mid-sized enterprises lacking in-house data engineering talent.
Mandatory ESG Geo-Reporting for Large Energy Projects
New sustainability rules oblige oil and renewable operators to overlay emissions and biodiversity metrics onto precise geospatial layers. Automated satellite imagery classification and drone surveys help firms quantify flare events, vegetation loss, and water usage near production sites. Regulators require time-stamped coordinates to verify self-reported figures, driving demand for secure platforms with audit-ready provenance. Vendors integrate compliance modules that schedule repeat observations, trigger alerts when thresholds are exceeded, and generate regulator-formatted reports, embedding analytics into standard operating procedures.
Restraints Impact Analysis*
| Restraint | (~) % Impact on CAGR Forecast | Geographic Relevance | Impact Timeline |
|---|---|---|---|
| Data-sovereignty and privacy regulations | -2.1% | Saudi Arabia, UAE, Israel | Medium term (2-4 years) |
| High CAPEX and skills gap for indoor positioning | -1.8% | All MEA countries | Short term (≤ 2 years) |
| Source: Mordor Intelligence | |||
Data-Sovereignty and Privacy Regulations
Saudi Arabia’s Personal Data Protection Law and the UAE’s Federal Decree-Law on Data Protection oblige processors to store sensitive location attributes within national borders. Healthcare, finance, and defense projects face strict consent and audit trails, prompting on-premises or sovereign cloud deployments. Multinational vendors respond by launching local cloud regions and offering data-localization tiers that segregate personally identifiable information. Compliance checks elevate project timelines and costs, often requiring legal reviews, encryption key management, and local incident-response protocols.
High CAPEX and Skills Gap for Indoor Positioning
Accurate indoor analytics depend on dense arrays of Bluetooth, ultra-wideband, or RFID beacons, each demanding site surveys, interference mitigation, and iterative calibration. Capital requirements deter small facilities, especially when returns are uncertain. Meanwhile, region-wide shortages of geodesy, RF engineering, and data-science talent hamper rollout speed. Enterprises therefore engage system integrators and managed-service providers to design, deploy, and maintain indoor location networks, driving up operating expenses while extending adoption cycles.
*Our forecasts treat driver/restraint impacts as directional, not additive. The impact forecasts reflect baseline growth, mix effects, and variable interactions.
Segment Analysis
By Location: Outdoor Dominates While Indoor Accelerates
Outdoor solutions represented 71.35% of the MEA location analytics market in 2025 as ministries of transport and public works digitized highways, ports, and metro systems. Camera feeds combined with geofencing algorithms support dynamic tolling and traffic-signal optimization, cutting congestion on flagship corridors. The MEA location analytics market size for outdoor deployments is forecast to climb steadily through 2031, benefiting from city-wide mobility-as-a-service platforms. Indoors, malls, airports, and hospitals deploy beacons and LiDAR to gain customer-journey and asset-utilization insights. Uptake is strongest in tier-one malls where operational gains offset hardware and calibration costs. Near-field tracking bridges the gap between store apps and loyalty programs, enhancing campaign conversion.
Emerging use cases blend indoor and outdoor datasets to track assets across supply-chain nodes without signal drop. Logistics operators map cross-dock warehouses and final-mile routes on a single platform, improving hand-off accuracy and reducing misplacement incidents. Facility managers integrate building information modeling with GIS dashboards to visualize maintenance tickets in spatial context. This convergence draws new vendors that bundle floor-plan digitization, Wi-Fi heat-mapping, and global navigation satellite system (GNSS) correction services into unified offerings, positioning them for double-digit gains within the broader MEA location analytics industry.

By Deployment Model: Cloud Acceleration Reshapes Market
Cloud platforms owned 65.40% of the MEA location analytics market in 2025 and continue to outpace on-premises systems with a 19.18% CAGR. Telecom operators, retailers, and public agencies rely on regional data centers operated by hyperscalers to elastically store and process terabytes of geospatial records. The MEA location analytics market size for cloud-hosted workloads is projected to surpass on-premises spending before 2027 as data-sovereignty-compliant regions multiply. Region-specific security certifications and low-latency edge zones encourage migration of latency-sensitive applications such as autonomous shuttle control and real-time crowd monitoring.
On-premises solutions remain essential for classified projects and installations disconnected from public networks. Defense and critical-infrastructure operators deploy ruggedized servers and private clouds to meet stringent performance and confidentiality targets. Hybrid architectures gain traction, integrating edge appliances that process streaming data locally before offloading aggregated insights to sovereign clouds for long-term analytics. Vendors differentiate through pre-built connectors, zero-trust frameworks, and pay-as-you-go pricing to ease budget constraints, illustrating how deployment flexibility underpins purchasing decisions across the MEA location analytics industry.
By Application: Remote Monitoring Leads, Asset Management Accelerates
Remote monitoring captured 43.55% of the MEA location analytics market share in 2025, enabling city authorities to oversee utilities, traffic lights, and environmental sensors through unified dashboards. Continuous telemetry supports predictive maintenance and energy savings, especially in desert climates where asset strain is high. Meanwhile, asset-management solutions exhibit the fastest 17.86% CAGR as manufacturers, hospitals, and airports pivot to real-time location systems (RTLS) that cut search time for tools and equipment. The MEA location analytics market size tied to asset management is set to rise sharply as ultra-wideband tags fall in price and software modules integrate with enterprise resource planning platforms.
Artificial intelligence augments both segments by flagging anomalies in sensor behaviour and recommending interventions. Hospitals deploy geofenced alerts to ensure infusion pumps remain within sterile zones, while airlines track ground-support equipment to minimize turnaround delays. As edge processing becomes affordable, event-driven architecture reduces cloud bandwidth and speeds incident response. Integrators position outcome-focused packages that bundle tags, gateways, analytics, and managed services, aligning cost models with operational savings and reinforcing adoption momentum within the MEA location analytics market.
By Vertical: Retail Leads, Government Grows Fastest
Retailers accounted for 28.60% of the MEA location analytics market in 2025, optimizing store design, assortment planning, and omnichannel logistics through footfall analysis and heat-mapping. Landmark Retail uses behavioural insights to rationalize product placement, raise conversion rates, and reduce stockouts. Dynamic pricing tools anchor recommendations in real-time demand signals, elevating basket size. Governments emerge as the fastest-growing segment at a 16.72% CAGR as ministries deploy geospatial dashboards for public-service delivery, emergency-response optimization, and infrastructure planning. The MEA location analytics market size tied to public-sector projects is set to multiply as national cloud policies and smart-city budgets expand.
Healthcare institutions rely on spatial data to streamline patient flow and trace infection exposure, while manufacturers integrate digital twins with live asset telemetry to cut downtime. ESG mandates spur oil and gas operators to track flaring events and habitat impacts on precise maps, promoting transparent reporting. Education and tourism agencies adopt wayfinding and crowd-density analytics to enhance visitor experiences and resource allocation. These diverse use cases illustrate the broadening reach of the MEA location analytics market across vertical domains.
By Component: Software Dominates, Services Grow Fastest
Software held 60.25% share of the MEA location analytics market in 2025, spanning geographic information systems, spatial data warehouses, and visualization suites. Feature roadmaps increasingly embed machine learning for hot-spot detection, route optimization, and demand forecasting. Vendors adopt micro-services and open APIs to simplify integration with customer relationship management and enterprise applications. Services post the fastest 20.45% CAGR as customers seek consulting, customization, and 24-hour support to overcome internal skills gaps. Indoor-positioning rollouts, in particular, require radio-frequency planning, device calibration, and user-experience design expertise that few enterprises possess.
Managed-service agreements cover continuous system tuning, security patching, and data-quality assurance, transferring risk from users to providers. Training packages foster in-house competence but also enlarge vendor ecosystems as certified partners deliver localized support. Combined offerings that align software licences with professional-service bundles accelerate time-to-value and cater to smaller organizations that cannot afford large capital outlays. This blend of product and service innovation distinguishes leaders in the competitive landscape of the MEA location analytics industry.
Geography Analysis
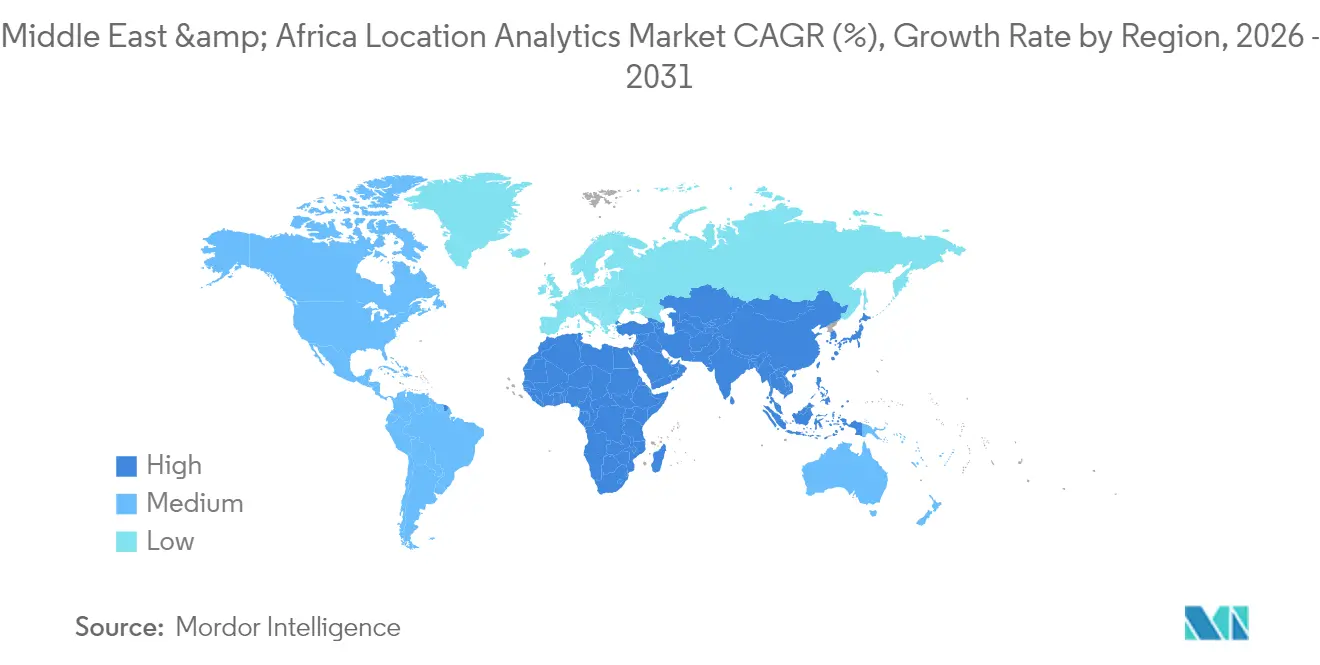
The United Arab Emirates leads regional adoption thanks to early smart-city commitments and a regulatory framework that encourages cloud and artificial-intelligence investment. Dubai’s IoT fabric streams location-tagged data from roads, lighting, and utilities into analytics hubs that power mobility dashboards and live environmental alerts. Sovereign cloud partnerships with hyperscalers ensure data residency, letting agencies ingest sensitive spatial layers while meeting privacy statutes. Retail groups in Abu Dhabi and Dubai fuse CCTV analytics with loyalty-card data, tailoring promotions to real-time movement patterns on the shop floor. Healthcare authorities overlay genomic and patient-care datasets on location grids to optimize clinic placement and resource dispatch. Integrated nationwide 5G coverage provides the low-latency backbone for these applications, reinforcing the country’s leadership in the MEA location analytics market.
Saudi Arabia is the fastest-growing geography as Vision 2030 drives digital-infrastructure investment. The USD 500 billion NEOM project relies on a unified geospatial platform to synchronize physical construction with virtual replicas, guiding planners on environmental, traffic, and utility decisions. Riyadh accelerates cloud-region launches with global providers to meet localization rules, while public agencies recruit data-science talent through national upskilling programs. Facility-management demand climbs as mega-projects transition from build to operate, boosting adoption of asset-tracking and predictive-maintenance modules. New sustainability regulations compel energy firms to integrate satellite and drone imagery with emissions data, increasing spending on compliant analytics solutions within the MEA location analytics market.
Israel sustains a prominent share due to its cybersecurity expertise and innovation ecosystem. Defense and public-safety agencies deploy location analytics for threat detection and situational awareness, balancing data utility with privacy safeguards. Start-ups collaborate with hospitals on patient-flow mapping and with retailers on AI-driven merchandising, exporting solutions across the wider region. Elsewhere, Qatar, Kuwait, and emerging African economies embrace analytics at a measured pace, constrained by legacy infrastructure and fragmented addressing. Regional data-center investments exceeding USD 5 billion by private-equity and telecom consortia expand compute capacity, lowering barriers for cloud-native spatial applications. These trends sustain double-digit compound growth for the MEA location analytics market across diverse national contexts.
Regulatory Landscape
Data sovereignty and privacy requirements sit at the center of location analytics deployments across the Middle East and Africa, particularly in the GCC where precise coordinates can be treated as personal data. Saudi Arabia regulates personal data processing under the Personal Data Protection Law (PDPL), with the Saudi Data and AI Authority (SDAIA) as the competent authority, which tightens expectations around data residency and governance for consent, auditability, and incident handling.
In the UAE, the federal data protection framework applies outside financial free zones, while DIFC and ADGM operate separate, GDPR-aligned regimes that can create multiple compliance tracks for cross-emirate programs and multinational enterprises. In June 2026, the UAE announced the creation of a Federal Authority for Artificial Intelligence and Data, pointing to closer coordination across AI and data governance that shapes how location analytics platforms are designed, hosted, and monitored. Cross-border alignment also became more explicit in April 2026, when SDAIA launched a MENA AI Harmonisation Initiative with the UAE, Qatar, and Oman, reinforcing the focus on data classification, cross-border flows, and AI ethics principles that extend to geospatial and mobility datasets.
Value Chain Analysis
The MEA location analytics value chain starts with data generation and capture, including IoT sensors used in smart-city programs, telecom network signaling (4G/5G), enterprise device telemetry, and curated mapping and geospatial layers. Data aggregation and enrichment then flow through telecom operators, map and GIS providers, satellite and imagery suppliers, and system integrators that normalize, anonymize, and fuse datasets into usable spatial layers. Hyperscalers and sovereign or national platforms supply the processing backbone for geospatial databases, AI pipelines, and digital twin workloads, while independent software vendors provide GIS, visualization, routing, and streaming analytics applications for government agencies and enterprise buyers.
Implementation typically happens through direct enterprise sales, channel partners, and managed services, reflecting persistent skills gaps in geospatial engineering and indoor positioning. Public-sector and smart-city use cases increasingly depend on localized platforms and partnerships, including Ooredoo Qatar's launch of Ooredoo Flow in December 2024, powered by Qatar's MCIT TASMU Platform for mobility insights. On basemaps and content, the July 2025 Map Africa Initiative by Space42, Microsoft, and Esri highlights coordination between satellite-derived data, Azure-based infrastructure, and GIS software to reduce map fragmentation across African markets, which supports the foundational layer needed for logistics, planning, and public services.
Competitive Landscape
The MEA location analytics market shows moderate concentration, with Cisco, Microsoft, Oracle, and Esri anchoring enterprise-scale deployments through regional partnerships and sovereign-cloud offerings. Cisco’s recent cloud-data-center expansion in Saudi Arabia supplies compliant hosting for public-sector GIS workloads, while Microsoft’s joint venture with G42 underpins AI-augmented geospatial services in the UAE. Oracle integrates spatial functions within its autonomous database, courting finance and telecom clients that require mission-critical uptime. Esri retains dominance in high-precision GIS but faces swelling competition as API-first mapping providers gain ground.
Local specialists differentiate by embedding Arabic natural-language interfaces, postal-code conversion tools, and indigenous map layers, addressing content gaps often overlooked by global players. Indoor-positioning start-ups partner with mall operators to install beacon networks as turnkey services, an area where capital and skills barriers deter international entrants. Technology roadmaps revolve around edge analytics, streaming spatial databases, and low-code interfaces that democratize geospatial insight. Vendors invest in integration partnerships with enterprise-application leaders to embed mapping directly into supply-chain, CRM, and ERP workflows, reducing friction for end users. These strategies collectively reinforce a competitive yet collaborative environment that accelerates innovation in the MEA location analytics market.
MEA Location Analytics Industry Leaders
-
SAS Institute Inc
-
SAP SE
-
Cisco Systems
-
HERE
-
Microsoft Corporation
- *Disclaimer: Major Players sorted in no particular order
Market Opportunities and Future Outlook
Government-led city operations platforms and digital twins are broadening the practical scope for location analytics beyond single-point solutions toward shared, multi-department geospatial layers and ongoing real-time monitoring. Dubai Municipality's launch of the Dubai Digital Twin Platform in July 2026 is a clear example, with the platform built around more than 1,500 geospatial data layers and 3D models spanning 280,000 infrastructure assets and 195,000 buildings. For vendors, this setup creates room to connect indoor and outdoor datasets, implement data lineage and access controls across agencies, and deliver high-frequency visualization and alerting tied to traffic, utilities, safety, and asset maintenance workflows.
Sovereign AI and edge infrastructure buildouts across the GCC are also changing procurement priorities toward locally governed data pipelines, secure model deployment, and compliance-ready architectures for critical infrastructure, including ports, aviation, and energy. In March 2026, STC Group deployed high-capacity network and edge computing infrastructure at the New Murabba development in Riyadh to support a smart city platform and AI-driven building management, reinforcing demand for low-latency processing near assets. Separately, the Map Africa Initiative led by Space42 with Microsoft and Esri is building foundational basemaps for all 54 African countries, which supports opportunities in logistics routing, urban planning, and disaster response where consistent geospatial content has been a limiting factor. Taken together, these programs are pulling through demand for services, system integration, and managed operations, particularly in environments where internal geospatial, RF, and data engineering capabilities are constrained.
Recent Industry Developments
- May 2026: HERE Technologies introduced HERE Location Reasoning, positioning geospatial grounding as a core capability for enterprise AI systems and agentic workflows. The launch shifts location analytics beyond visualization into decision support by linking real-world context to model outputs, reinforcing HERE's relevance in industrial and logistics deployments.
- July 2025: Maxar Intelligence secured three multi-year strategic contracts totaling USD 204.7 million to advance sovereign capabilities for customers across the Middle East and Africa. The awards reflect continued demand for high-resolution imagery and AI-enabled predictive intelligence that can feed compliant location analytics stacks for security, infrastructure, and government use cases.
- October 2024: ZainTECH and Urbi signed a memorandum of understanding to integrate Urbi's geospatial platform data and algorithms with ZainTECH's digital solutions portfolio. The tie-up supports telecom-led location intelligence commercialization across the MENA region, combining operator reach with specialized geospatial analytics capabilities for enterprise and public-sector customers.
Research Methodology Framework and Report Scope
Market Definition and Coverage
For this study, the market covers location analytics software and related services used by organizations in the Middle East and Africa to turn location data (from devices, networks, and sensors) into operational and business insights.
Scope exclusions: Hardware-only location products, purely consumer navigation apps, satellite-first remote sensing platforms, and location-based advertising content creation are not counted in this market size.
Segmentation Overview
- By Location
- Outdoor
- Indoor
- By Deployment Model
- On-premise
- On-demand (Cloud)
- By Application
- Remote Monitoring
- Asset Management
- Facility Management
- By Vertical
- Retail
- Manufacturing
- Healthcare
- Government
- Energy and Power
- Other Verticals
- By Component
- Software
- Services
- By Country
- United Arab Emirates
- Saudi Arabia
- Israel
Data Sources, Market Sizing, and Validation
Desk Research
Desk research was used to build the basic demand and supply picture for location analytics across MEA, and to anchor the model to public indicators that can be rechecked. We relied on sources such as the ITU for connectivity metrics, the World Bank and IMF for macro and investment signals, UN Comtrade for trade direction checks on related equipment categories, and standards bodies such as ISO/IEC to understand common location and data practices.
Alongside these, we reviewed company annual reports and investor presentations, government digital economy programs, smart city and transport authority updates, and credible press coverage to capture adoption direction by end use. Where needed, paid database subscriptions were used in a limited way for company financials and news screening, patent searches around geospatial and positioning analytics, and import-export shipment-level checks that help confirm demand momentum. These sources are illustrative and not exhaustive, and other public references were also used to collect, verify, and clarify inputs.
Primary Interviews and Surveys
Primary interviews and surveys were used to pressure test what we saw in public sources, especially on pricing patterns, deployment mix, and actual use cases across MEA. We spoke with a mix of solution providers, system integrators, and enterprise and public sector buyers across key sub-regions, so the gaps in adoption rates and spending splits could be closed with practical inputs.
Distribution of primary research fieldwork respondents
| Company type | Respondent position |
|---|---|
| Top tier: 36% | CXOs: 16% |
| Mid tier: 48% | Functional/Unit leaders: 29% |
| Smaller Players: 16% | Managers: 55% |
Market-Sizing & Forecasting
Sizing was built using a top-down and bottom-up logic, where regional digital and enterprise software spending is reconstructed into a location analytics demand pool using penetration and usage intensity assumptions. To keep the result realistic, selective bottom-up checks were run using sampled supplier revenues, channel feedback, and volume assumptions mapped to average selling prices, and then the totals were adjusted when the two views were not aligning.
A few market fingerprints guided the model inputs, keeping the math connected to real adoption. These included cloud versus on-premise split for analytics workloads, indoor versus outdoor use intensity, smart city and transport digitization timelines, smartphone and IoT endpoint growth, and the share of deployments bundled with services for implementation and integration. For forecasting, scenario analysis was used, and the scenarios were tuned using expert expectations on budget cycles, public sector rollouts, and data privacy readiness across MEA. When bottom-up inputs were missing for smaller countries, gaps were handled through peer country ratios based on connectivity and digital investment signals, followed by a final consistency check against the regional total.
Data Validation & Update Cycle
Validation was done through repeated cross checks, where model outputs were compared with independent signals such as enterprise IT spend direction, cloud adoption markers, and major digital infrastructure program activity. When abnormal jumps were seen by country or by deployment type, the assumptions were revisited, and follow-up calls were triggered to confirm whether the variance came from pricing, a large contract, or a definitional mismatch.
Before sign-off, the work is reviewed in steps so that math, assumptions, and scope alignment are all checked separately, and then reconciled as one story. Reports are refreshed annually, and interim updates are made when material events occur that can move near-term demand. Right before delivery, a final update pass is completed so the latest public developments and interview learnings are reflected.
Mordor Intelligence's Middle East and Africa Location Analytics Market Market Size Measured Against Other Published Estimates
Published market sizes for MEA location analytics can look different because authors do not always treat the same revenue items as part of the market, and they also vary on the year used, currency timing, and how services are handled. Differences also come from how strongly assumptions are validated with buyers versus relying mainly on public statements.
Location-based advertising content creation sits outside Mordor Intelligence's scope for this market, and that single inclusion difference can shift totals when ad-tech revenue is blended into location analytics. In addition, some publications apply aggressive price growth across software and services without checking discounting patterns and multi-year contracts, which tends to inflate the near-term value in fast-growing MEA programs.
Benchmark comparison
| Source | Market Size | Gaps in Research Methodology |
|---|---|---|
| Mordor Intelligence | USD 2.90 B (2025) | |
| Global Consultancy A | USD 1.80 B (2026) | Uses a different base year and appears to apply a narrower MEA demand pool with limited treatment of bundled analytics services, which can understate enterprise deployments tied to implementation work. |
| Industry Publisher B | USD 2.90 B (2025) | The stated value matches the base year number, but scope notes are limited, so the split between software and services and the handling of adjacent ad-related revenue is not clearly traceable. |
The comparison shows that most variance is explained by base year selection, whether services are counted with software, and how adjacent revenue streams are treated. By keeping the market tied to observable adoption drivers and then rechecking assumptions with regional practitioners, the final number stays explainable and repeatable for planning.
Key Questions Answered in the Report
What is the current size of the MEA location analytics market?
The market stands at USD 3.33 billion in 2026 and is projected to reach USD 6.68 billion by 2031.
Which deployment model is expanding fastest in the MEA location analytics market?
Cloud deployment is growing the quickest, with a 19.18% CAGR forecast between 2026-2031, helped by new sovereign cloud regions in the UAE and Saudi Arabia.
Why do outdoor analytics hold the largest share of the market?
Outdoor use cases support region-wide smart-city, mobility, and public-safety projects, giving the segment 71.35% market share in 2025.
What is driving rapid growth in asset-management applications?
Manufacturers, hospitals, and airports are adopting real-time location systems to track equipment and cut downtime, resulting in an 17.86% CAGR forecast for the segment.
How are data-sovereignty rules affecting adoption?
Strict localization laws in Saudi Arabia and the UAE push organizations toward sovereign or on-premise clouds, adding compliance steps but ensuring sensitive geodata remain inside national borders.
Which vertical will grow fastest through 2031?
Government projects will advance at a 16.72% CAGR, supported by national digital-transformation agendas such as Saudi Vision 2030 and Dubai’s 2040 Urban Master Plan.