
Market Overview
| Study Period | 2020 - 2031 |
|---|---|
| Forecast Data Period | 2026 - 2031 |
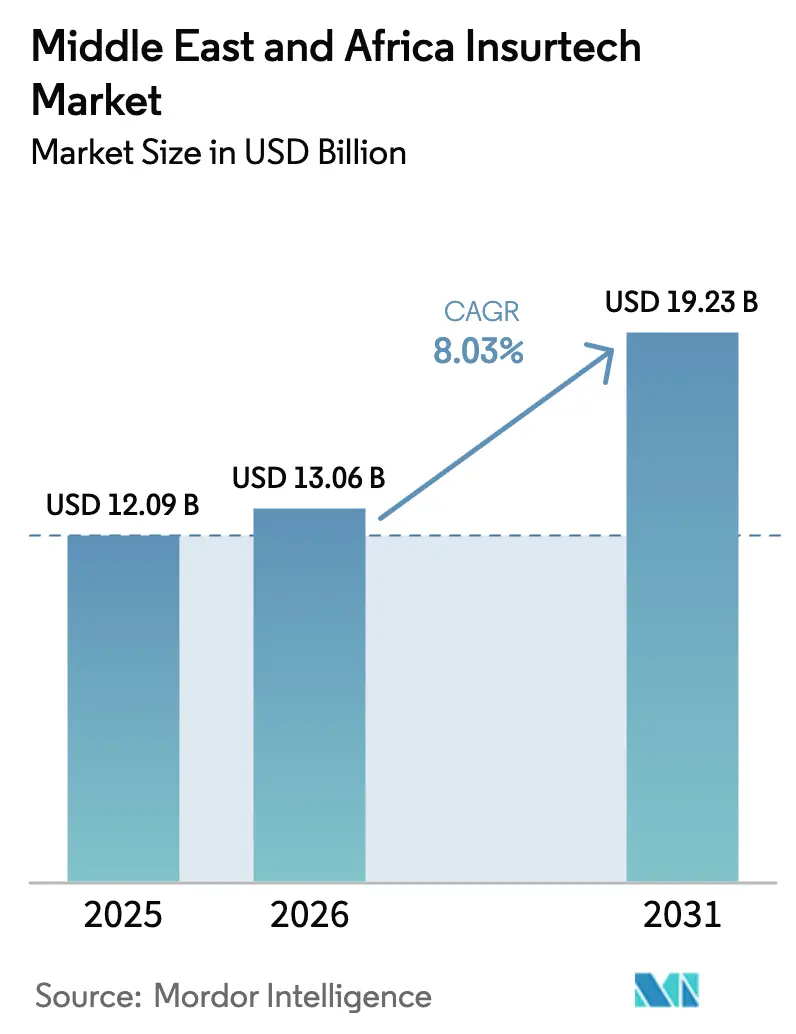
| Base Year Market Size (2025) | USD 12.09 Billion |
| Market Size (2026) | USD 13.06 Billion |
| Market Size (2031) | USD 19.23 Billion |
| Growth Rate (2026 - 2031) | 8.03% CAGR |
| Market Concentration | Medium |
Major Players *Disclaimer: Major Players sorted in no particular order Image © Mordor Intelligence. Reuse requires attribution under CC BY 4.0. | |
Middle East And Africa Insurtech Market Analysis by Mordor Intelligence
The Middle East and Africa Insurtech market size was valued at USD 12.09 billion in 2025 and estimated to grow from USD 13.06 billion in 2026 to reach USD 19.23 billion by 2031, at a CAGR of 8.03% during the forecast period (2026-2031). Mandatory motor and health schemes in Gulf states, rapid smartphone penetration across Africa, and sandbox-style regulatory frameworks are combining to push digital insurance adoption across every major line of business. Embedded sales inside digital wallets and e-commerce checkouts are widening reach, while “reinsurance-as-a-service” hubs in Dubai and Mauritius are supplying specialty-line capital to regional MGAs. Islamic-finance APIs let carriers launch Sharia-compliant products quickly, creating fresh premium pools that conventional systems could not address. Venture capital inflows, cloud migration, and AI-powered underwriting continue to accelerate platform productivity even as data-quality and infrastructure gaps linger in several frontier markets.
Key Report Takeaways
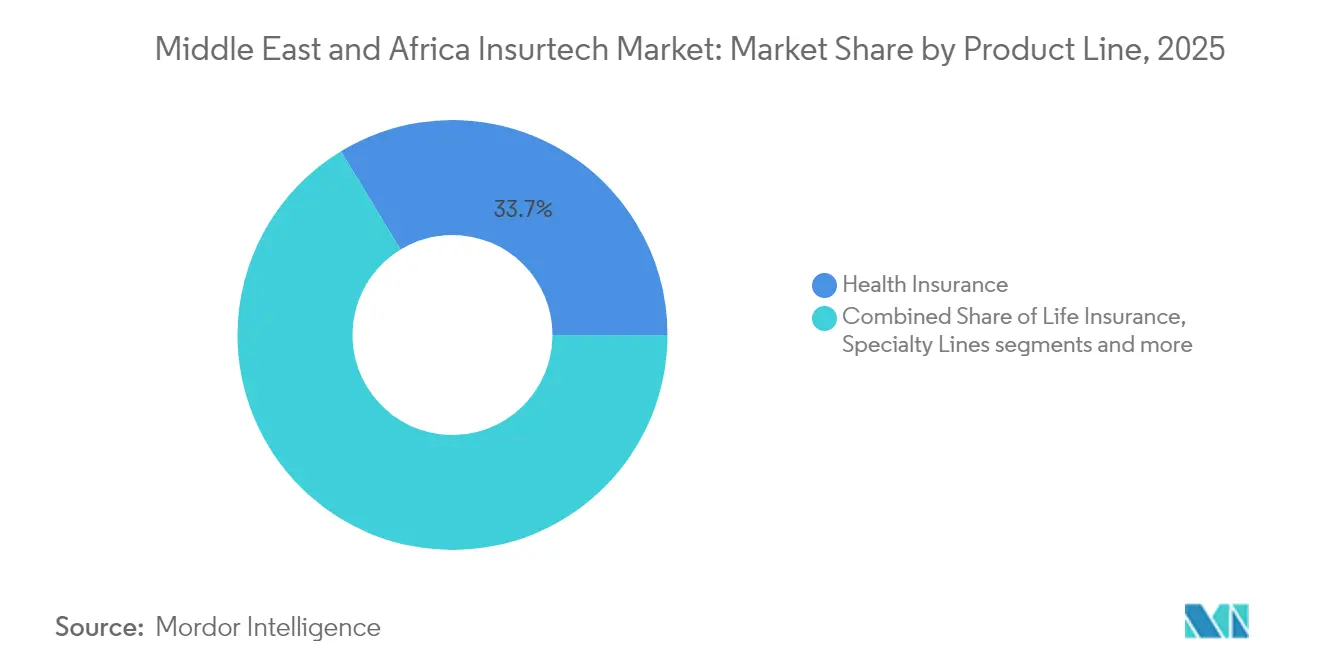
- By product line, health insurance held 33.68% of revenue in 2025, while specialty lines are projected to expand at 10.96% CAGR to 2031.
- By distribution channel, traditional agents and brokers accounted for 40.62% of the Middle East and Africa Insurtech market share in 2025; embedded insurance platforms are forecast to grow at 8.74% CAGR through 2031.
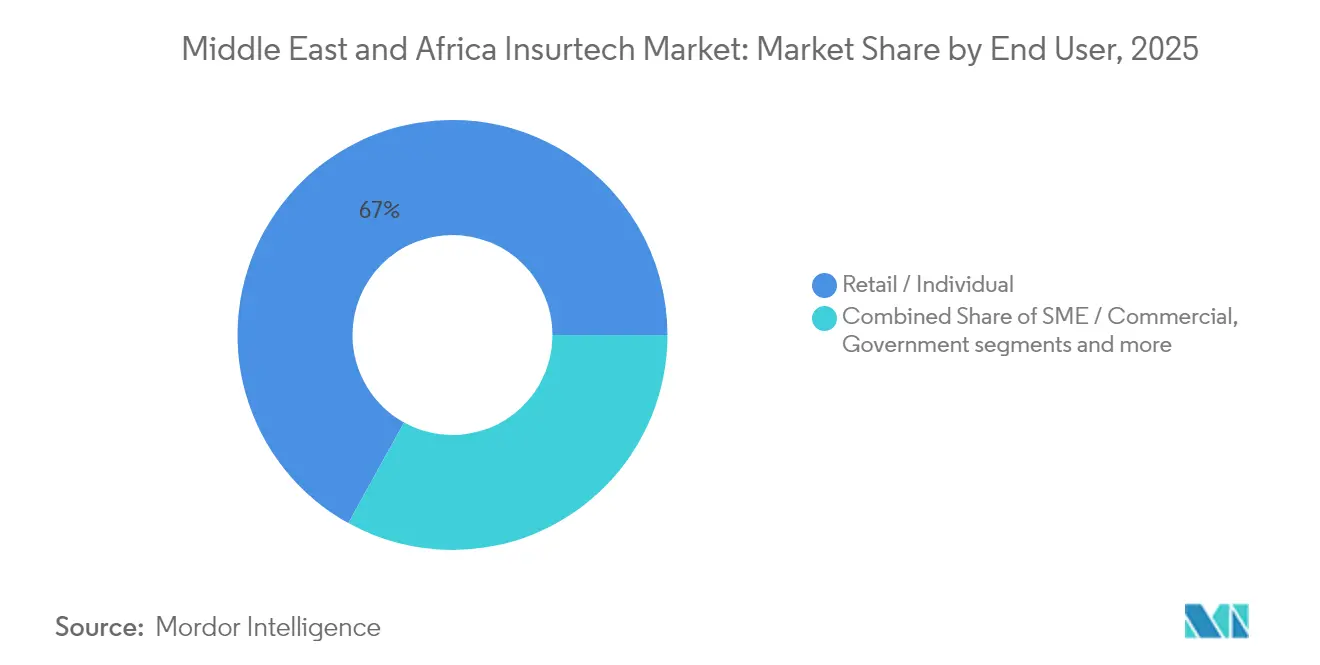
- By end user, retail and individual customers captured 66.95% of the 2025 value; SME and commercial demand are set to rise at a 9.08% CAGR over the outlook.
- By geography, the United Arab Emirates led with a 37.12% share in 2025, whereas Saudi Arabia is expected to post a 10.05% CAGR between 2026 and 2031.
Note: Market size and forecast figures in this report are generated using Mordor Intelligence’s proprietary estimation framework, updated with the latest available data and insights as of 2026.
Middle East And Africa Insurtech Market Trends and Insights
Drivers Impact Analysis*
| Driver | (~) % Impact on CAGR Forecast | Geographic Relevance | Impact Timeline |
|---|---|---|---|
| Mandatory motor & health insurance expansion | +2.1% | UAE, Saudi Arabia, Qatar, Bahrain | Medium term (2-4 years) |
| Low insurance penetration & smartphone adoption | +1.8% | Nigeria, South Africa, Kenya, Egypt | Long term (≥ 4 years) |
| Pro-innovation regulatory sandboxes | +1.2% | UAE (DIFC), Saudi Arabia, Bahrain | Short term (≤ 2 years) |
| Growing VC & insurer partnerships | +0.9% | UAE, Saudi Arabia | Medium term (2-4 years) |
| Takaful-ready API platforms | +0.7% | GCC states | Medium term (2-4 years) |
| Cross-border reinsurance hubs | +0.5% | Dubai, Mauritius, South Africa | Long term (≥ 4 years) |
| Source: Mordor Intelligence | |||
Mandatory Motor & Health Insurance Expansion
Gulf regulators require universal health cover and third-party motor liability, forcing millions of residents onto digital enrollment rails. Employers in the UAE must prove employee coverage when renewing work visas, while Saudi Arabia levies fines for lapsed motor liability certificates. Insurtech apps that scan Emirates IDs, pull payroll data, and price premiums in seconds are filling distribution gaps left by legacy agents. Automated compliance checks feed government databases, reducing policy-issuance friction and pushing renewal ratios above 90%. Traditional brokers are hurriedly linking to these APIs to defend commercial fleets, yet face margin pressure as self-service adoption grows. The rule-driven expansion, therefore, provides a stable premium floor and predictable claims patterns for tech-enabled carriers. As enforcement broadens, the Middle East and Africa Insurtech market is likely to shift an additional 5 million individual policies onto cloud platforms by 2027.
Low Insurance Penetration & Smartphone Adoption
African countries average sub-3% insurance density against smartphone penetration surpassing 60%. Nigeria embodies the gap—0.5% insurance but 84% mobile-phone access—allowing pay-as-you-go micro-policies priced in daily or weekly increments. Mobile money rails in Kenya and Ghana route premiums and claims instantly, cutting acquisition and servicing expenses by at least 40% versus in-person agents. Real-time usage data captured from telematics, crop sensors, and health wearables improves risk selection, narrowing combined ratios even in high-loss provinces. Social media integration also acts as free marketing, with referrals lifting month-one new-business volumes by double digits. Over the forecast horizon, these dynamics could lift Africa’s digital policy fourfold without the fixed cost of branch networks. The smartphone dividend thus remains a foundational driver of the Middle East and Africa Insurtech market.
Pro-Innovation Regulatory Sandboxes
Fintech sandboxes in Dubai, Riyadh, and Manama cut red tape for parametric drought cover, AI triage, and blockchain proof-of-insurance pilots. The Dubai International Financial Centre has processed more than 200 applications since 2024, approving 15% for insurance technology trials. Sandbox participants receive temporary capital-adequacy breaks and fast-track licensing, letting founders launch MVPs in weeks rather than months. Successful pilots feed empirical data back to regulators, shaping permanent guidelines aligned with digital operations rather than paper-based workflows. Foreign startups also use sandbox residency to passport products into adjacent GCC markets under mutual-recognition memoranda. Clustering benefits then appear—cloud hosts, law firms, and actuarial boutiques establish local practices, deepening the ecosystem. These network effects keep the Middle East and Africa Insurtech market attractive to global talent even amid macro volatility.
Growing VC & Insurer Partnerships
Venture rounds are trending upward, led by Klaim’s USD 26 million Series A for AI claims automation in March 2025[1]Klaim, “Klaim raises USD 26 million Series A,” klaim.ai. Insurers co-invest in many deals, exchanging regulatory know-how and balance-sheet capacity for minority stakes and technology access. Embedded partnerships with banks and telcos create near-zero-cost distribution by inserting opt-in micro-cover during digital payments. Shared-services consortiums let startup MGAs tap call-center resources and pooled reinsurance panels, lowering break-even premium thresholds. Corporate venture capital branches at GIG Gulf and SANLAM are now active follow-on investors, stabilizing funding cycles otherwise exposed to global tech-market swings. Revenue-share rather than equity appears in several 2025 term sheets, aligning performance with underwriting profit instead of user-growth vanity metrics. These hybrid structures accelerate scale while keeping burn rates disciplined, reinforcing the Middle East and Africa Insurtech market growth path.
Restraints Impact Analysis*
| Restraint | (~) % Impact on CAGR Forecast | Geographic Relevance | Impact Timeline |
|---|---|---|---|
| Regulatory fragmentation across MEA | −1.4% | Pan-regional | Long term (≥ 4 years) |
| Poor data quality for AI models | −0.8% | Sub-Saharan Africa | Medium term (2-4 years) |
| Reinsurer capacity squeeze for MGAs | −0.6% | Specialty lines | Short term (≤ 2 years) |
| Power & connectivity outages | −0.4% | Frontier economies | Long term (≥ 4 years) |
| Source: Mordor Intelligence | |||
Regulatory Fragmentation Across MEA
Fifty-four African and sixteen Middle Eastern jurisdictions apply incompatible capital, reporting, and consumer-disclosure requirements. Insurtechs must maintain parallel compliance teams, inflating overhead and delaying multi-market launches. Nigeria’s 2024 Insurance Act forces local data residency, while South Africa’s twin-peaks framework leans on conduct-of-business supervision, complicating uniform policy wording. Sandbox passports help but rarely cover full-scale operations, leaving post-pilot scaling hamstrung. Without mutual-recognition treaties, cross-border embedded products stall at checkout as carriers scramble for valid licenses. Investors demand extra runway financing to cover lengthy approval cycles, depressing pre-money valuations. The resulting friction subtracts roughly 1.4 percentage points from the otherwise higher potential CAGR in the Middle East and Africa Insurtech market.
Poor Data Quality for AI Models
AI underwriting needs deep, clean loss histories; yet many frontier markets rely on paper files or fragmented spreadsheets, limiting predictive power. Frequent power cuts—Nigeria lost grid stability 40% of 2024—leave gaps in transaction logs, skewing claims severity estimates. Lack of geocoded property records forces models to blend low-resolution satellite images with anecdotal survey data, raising uncertainty spreads. International reinsurers, wary of model drift, charge higher ceding commissions, shrinking MGA margins. Data-sharing MOUs signed by regulators remain underfunded, slowing central-repository rollouts. Carriers often offset weak data by adding bigger safety loads, reducing policy affordability for low-income groups. Together, these headwinds shave nearly a full point off growth potential for the Middle East and Africa Insurtech market.
*Our forecasts treat driver/restraint impacts as directional, not additive. The impact forecasts reflect baseline growth, mix effects, and variable interactions.
Segment Analysis
By Product Line: Health Insurance Leads While Specialty Lines Accelerate
Health insurance generated 33.68% of 2025 revenue, buoyed by mandatory coverage for expatriates and citizens across Gulf states. Digital enrollment portals, telemedicine tie-ins, and AI triage chatbots raise operational efficiency, letting carriers comply with price caps while preserving margins. Life insurance at 28.35% benefits from booming mortgage markets and Sharia-compliant savings plans that embed family Takaful. Property and casualty lines, especially motor, grew as ride-hailing fleets adopted pay-per-mile telematics to trim premiums.
Specialty lines form the fastest-rising pocket, charting 10.96% CAGR. Cyber sales jump after new breach-notification statutes in Saudi Arabia and Kenya, while marine parametric cover hedges Red Sea shipping delays. Pet insurance finds traction among urban Saudi and Emirati households owning pedigree breeds, and parametric travel cover is embedded inside airline booking engines. The Middle East and Africa Insurtech market size for specialty policies is expected to double from USD 1.23 billion in 2026 to USD 2.35 billion by 2031, reflecting the appetite for targeted risk transfer solutions.


By Distribution Channel: Embedded Platforms Surge Amid Agent Dominance
Traditional agents and brokers still wrote 40.62% of premiums in 2025, equivalent to USD 4.91 billion, mainly on corporate fleet and industrial schedules. Many now plug into insurer quote engines to deliver instant certificates, shrinking average policy-issuance time from days to minutes. Embedded platforms, however, deliver the highest velocity, growing at 8.74% CAGR as banks, telcos, and ride-hailing apps insert contextual cover into customer journeys. The Middle East and Africa Insurtech market size for embedded distribution could exceed USD 3.28 billion by 2031 if current attach rates persist.
Direct-to-consumer portals run by carriers hold a 22.48% share, capturing millennials seeking price transparency, while aggregator sites at 17.73% boost conversion via real-time premium comparisons. Digital MGAs occupying 12.18% offer cyber, logistics, and crop covers for SMEs overlooked by traditional capacity. Bancassurance channels trail at 6.99% but rise steadily as open-banking PSD2 analogues reach Gulf and Egyptian regulators.
By End User: Retail Dominance While SME Demand Rises
Retail buyers represented 66.95% of the 2025 premium, anchored by compulsory motor and health lines. Usage-based plans, cashback wellness rewards, and instant mobile claims keep customer churn low, cementing lifetime value. SMEs contribute the fastest growth at 9.08% CAGR; automated underwriting slashes proposal forms from 14 pages to 5 data fields, and monthly billing matches cash-flow rhythms. About 95% of GCC firms are classified as SMEs, yet fewer than 20% hold full multi-line coverage, a gap insurtechs aim to close.
Large enterprises at 22.05% leverage data analytics to redesign deductibles and self-insurance layers, integrating captives with local reinsurance hubs. Government agencies, representing 11.00%, test blockchain proof-of-insurance for procurement integrity, demonstrating public-sector digital adoption. Over the next five years, SME premium could outpace retail on a relative basis, but absolute value will stay largest in retail, supporting the broad growth of the Middle East and Africa Insurtech market.
Geography Analysis
The United Arab Emirates’s 37.12% lead derives from DIFC’s sandbox, Lloyd’s service companies, and the 2025 universal health mandate that converts every visa renewal into an insurance transaction. Real-time e-claims have shortened average reimbursement to under three days, elevating customer NPS and renewal rates. Dubai operates as a risk-finance conduit between European capital and Asian growth, further anchoring regional reinsurers.
Saudi Arabia is on a 10.05% CAGR trajectory, propelled by Vision 2030 digitization, SAR 4.0 billion fintech funding pools, and a 30% reinsurance retention rule that spurs local underwriting capacity. The Kingdom’s sandbox lets carriers pilot AI-scored motor premiums tied to real-time driving behavior, trimming loss ratios. A youthful population, 70% under 35, supports mobile-first sign-ups, while 91% of financial institutions deploy AI chatbots.
South Africa and Nigeria collectively control 27.74% of the premium, yet differ on infrastructure. Johannesburg houses actuarial cloud clusters that crunch regional data, whereas Lagos wrestles with 40% grid downtime. Nonetheless, 80% payment penetration in Nigeria boosts micro-insurance for health and crops. Remaining markets, including Kenya, Ghana, and Egypt, contribute 35.14%, leveraging mobile money and sandbox pilots to extend cover to the unbanked. These mosaics collectively sustain the expanding Middle East and Africa Insurtech market.
Regulatory Landscape
Regulation across MEA continues to formalize insurtech participation through sandbox entry points and tighter prudential and conduct expectations. In the UAE, the Central Bank of the UAE administers an experimental environment for FinTech in the insurance industry under Insurance Authority Board Decision No. 41 of 2019, offering a controlled route from testing to licensing for digital distribution, underwriting, and claims tools. Saudi regulators also continue to broaden market access through licensing actions, including mid-2026 brokerage licenses issued by the Insurance Authority (Saudi Arabia), supporting digitally enabled intermediation alongside carrier modernization.
A parallel shift is consolidation and upgrading of rulebooks and solvency supervision. The UAE Federal Decree-Law No. 6 of 2025 sets a consolidated framework with a reconciliation period closing on 16 September 2026, pushing insurers and insurtech partners to map licensing perimeters, governance requirements, and capital positions under the updated regime. In Africa, the direction of travel includes risk-based prudential regimes aligned with international approaches (often referenced against Solvency II principles). Ethiopia, in April 2026, signaled policy change by publishing a Draft Insurance Proclamation that targets a new supervisory authority and foreign investment access, raising the bar for transparency, reporting, and local operating readiness.
Value Chain Analysis
The MEA insurtech value chain starts with product manufacturing and risk capacity (insurers, takaful operators, reinsurers, and MGA capacity providers), supported by regulatory gateways including the CBUAE experimental environment, the SAMA sandbox framework, and NAICOM insurtech licensing guidelines. Enabling layers increasingly sit between carriers and end customers, including policy administration and API middleware, digital identity and KYC services, pricing and fraud analytics, and cloud infrastructure that hosts underwriting and claims workflows. Reinsurance hubs and specialty-line underwriting platforms in locations such as Dubai and Mauritius complement local balance sheets by supplying capital and expertise that digital MGAs access through delegated authority structures.
Distribution and servicing are the most visibly digitized links, with aggregators, embedded platforms, and digitally enabled agents and brokers connecting to carrier quote-and-bind APIs. Banks and telecommunications operators are also becoming prominent orchestrators of demand by embedding insurance into existing digital journeys, while technology integrators help incumbents modernize legacy cores through API layers rather than full system replacement. Bottlenecks persist around data quality, data localization requirements, and infrastructure reliability in parts of Sub-Saharan Africa, which raises operating costs for AI models and pushes firms toward modular architectures, local hosting options, and partnerships that share compliance and servicing capabilities.
Competitive Landscape
Competition is moderate but consolidation is visible as regulatory and reinsurance costs burden smaller MGAs. Nexus Underwriting’s January 2025 purchase of Arma Fusion adds energy and property binders, demonstrating interest in inorganic scale[3]Clyde & Co, “Advising Nexus Underwriting on its acquisition of Arma Fusion Limited,” clydeco.com. Africa Specialty Risks opened a Lloyd’s syndicate in Dubai in December 2024 to underwrite African and Middle-Eastern risks locally.
Traditional carriers such as Tawuniya integrate API layers for instant motor quotes, while GIG Gulf deploys telematics scorecards for SME fleets. Bolttech’s USD 246.0 million Series B extension values the embedded-protection leader at USD 1.6 billion and funds expansion into Egypt and Kenya[4]Bolttech, “LeapFrog investment extends bolttech’s Series B to US$246M,” bolttech.io. Klaim’s USD 26.0 million Series A backs AI audits that slash manual claims handling costs.
Strategic levers include specialty reinsurance, AI decisioning, and Islamic-finance compliance. Players able to automate multilingual onboarding and cross-border regulation enjoy clear advantages. With the top five groups holding about 38% of written premium, the Middle East and Africa Insurtech market shows moderate concentration yet ample room for new entrants.
Middle East And Africa Insurtech Industry Leaders
Bayzat
Yallacompare
Rasan (Tameeni / Treza)
Policybazaar.ae
Naked Insurance
- *Disclaimer: Major Players sorted in no particular order


Market Opportunities and Future Outlook
Embedded distribution tied to high-frequency digital journeys is creating measurable whitespace, particularly for SMEs that need fast proof-of-insurance for operations. In the UAE, Mashreq and Sukoon Insurance launched embedded issuance for Workmen's Compensation and Third-Party Liability via MashreqBiz in July 2026, showing how SME banking data can shorten underwriting timelines and reduce friction at policy purchase and renewal. Consumer affordability and payment flexibility is another opportunity lever, supported by Policybazaar.ae partnering with Tabby in July 2026 to offer installment payment plans for car and health premiums, which widens addressable demand for digitally sourced policies.
On the supply side, formalized regulatory pathways and platform modernization programs are expanding the set of insurtech-grade operating models. SAMA launched an enhanced Regulatory Sandbox Service on its e-services portal in June 2026, streamlining how fintech and insurtech models are submitted, tracked, and supervised, which supports faster iteration from pilot to compliant operations. In Africa, inclusion-led product and distribution experimentation is being structured through development-finance and insurer partnerships, such as the July 2026 FSD Africa and Jubilee Group MoU in Kenya through BimaLab and J-Hub, which targets tech-driven products for underserved segments and SMEs. Operational efficiency is also a key opportunity area as insurers prioritize AI-enabled automation and API-first builds, reinforced by the May 2026 ITC Infotech and InsureMO alliance focused on agentic AI for underwriting and claims workflow modernization across MEA.
Recent Industry Developments
- July 2026: Policybazaar.ae partnered with Tabby to introduce no-cost installment payment plans for car and health insurance premiums in the UAE, offering 4, 6, 8, or 12-month options. The collaboration reduces up-front premium friction for retail buyers and adds a fintech-enabled conversion lever for digitally sourced insurance distribution.
- December 2025: bolttech acquired Kenya-based digital insurance platform mTek to expand its embedded insurance footprint in East Africa. The transaction strengthens bolttech's local distribution and partner integrations, supporting broader regional scaling across mobile-first insurance journeys.
- December 2024: Africa Specialty Risks launched ASR Middle East as a Lloyd's service company in Dubai to underwrite African and Middle Eastern risks with local claims authority. The move deepens specialty capacity and underwriting access in a key regional hub, supporting MGAs and brokers seeking cyber, energy, and political risk placements.


Research Methodology Framework and Report Scope
Market Definition and Coverage
For this report, we define the Middle East and Africa insurtech market as the value of technology-led insurance activities delivered through digital channels and enabling services that support insurers and intermediaries across the region.
Scope exclusions: Traditional insurance premium volume that is sold and serviced fully offline is excluded, even if the carrier uses basic internal IT systems.
Segmentation Overview
- By Product Line (Insurance Type)
- Life Insurance
- Health Insurance
- Property & Casualty (Motor, Home, Commercial, Liability)
- Specialty Lines (Cyber, Pet, Marine, Travel)
- By Distribution Channel
- Direct-to-Consumer (Digital)
- Aggregators / Marketplaces
- Digital Brokers / MGAs
- Embedded Insurance Platforms
- Traditional Agents / Brokers (digitally enabled)
- Bancassurance (digitally enabled)
- Other Channels
- By End User
- Retail / Individual
- SME / Commercial
- Large Enterprise / Corporate
- Government / Public Sector
- By Region
- Middle East
- United Arab Emirates
- Saudi Arabia
- South Africa
- Nigeria
- Rest of Middle East And Africa
- Middle East
Data Sources, Market Sizing, and Validation
Desk Research
Desk work started with building the regional insurance and digital adoption context, because insurtech activity usually follows insurance demand and mobile-first customer behavior. We used public and official sources such as central bank and financial regulator publications in key MEA markets, national statistics offices, and insurance supervisor releases for licensing and rule changes.
To keep the model grounded, we referenced sources such as the World Bank, IMF, and ITU indicators on connectivity, along with trade and payments signals where available through official portals. Company annual reports, investor presentations, and reputable business press helped us map business models and typical revenue streams (platform fees, commissions, and service revenue). For consistency checks, we used select paid subscriptions for company financials and intelligence, news and financials, and patent databases to track activity levels and technology focus. The sources listed here are illustrative and not exhaustive, and many other references were used for data collection, validation, and clarification.
Primary Interviews and Surveys
Primary work was used to convert broad signals into usable assumptions, including how digital distribution is monetized in practice, which products are scaling faster, and what adoption barriers still slow conversion in parts of MEA. We spoke with a mix of insurers, intermediaries, technology providers, and ecosystem advisors across major MEA sub-regions so gaps from desk research could be filled and the final totals could be triangulated.
Distribution of primary research fieldwork respondents
| Company type | Respondent position | Region |
|---|---|---|
| Top tier: 29% | CXOs: 12% | |
| Mid tier: 57% | Functional/Unit leaders: 30% | |
| Smaller Players: 14% | Managers: 58% |
Market-Sizing & Forecasting
Sizing was built using a top-down and bottom-up approach, where regional insurance and digital commerce indicators were first translated into an addressable pool, and then checked against revenue-based approximations from active insurtech models. Practically, the top-down side uses MEA insurance activity levels and digital channel penetration to reconstruct how much insurance-related value is being created through technology-led delivery and enablement.
Key inputs included (as illustrative drivers) digital insurance sales share by market, smartphone and broadband penetration, e-commerce and digital wallet usage as a proxy for embedded insurance readiness, insurer digitization spend direction, and observed product mix shifts between life and non-life. We also tracked the pace of regulatory actions that influence adoption, such as licensing guidance, digital onboarding rules, and sandbox activity, because these often explain why growth differs across MEA countries.
Forecasts were developed using scenario analysis with a simple variable-led outlook, and then adjusted using interview feedback on pricing, conversion, and rollout timelines. Where bottom-up signals were incomplete, gaps were handled through conservative range estimates anchored to comparable business models in the region, followed by a final reconciliation so the total does not overcount overlapping revenue streams.
Data Validation & Update Cycle
Outputs were validated through multiple checks, starting with internal consistency tests across countries and service lines, followed by comparisons against independent demand and digital adoption signals. When a country-level value looked unusually high or low versus its insurance activity, connectivity, or regulatory readiness, the assumptions were reviewed and, if needed, we re-contacted sources to confirm what changed.
Before sign-off, a second analyst review is performed to test key variables, confirm currency and timing alignment, and ensure the narrative matches the numbers. Reports are refreshed annually, and interim updates are made when major policy changes, funding cycles, or structural shifts materially affect the outlook. Right before delivery, we do a final pass so clients receive an up-to-date view.
Mordor Intelligence's Middle East and Africa Insurtech Market Size Versus Other Published Estimates
Published insurtech market values for MEA can look far apart, mainly because some estimates count different revenue types and use different timing for what is considered live and monetized. Differences in what is treated as technology services versus insurance premiums also creates wide spreads.
Insurance premium volume written through conventional channels often gets blended into some third-party estimates, but that sits outside Mordor Intelligence's scope for this market and keeps the total tied to technology-led delivery and enablement revenue. Other gaps typically come from aggressive adoption curves for embedded insurance, inconsistent currency conversion timing in high inflation markets, and limited primary validation on how platforms monetize across life and non-life lines.
Benchmark comparison
| Source | Market Size | Gaps in Research Methodology |
|---|---|---|
| Mordor Intelligence | USD 13.06 B (2026) | |
| Regional Consultancy A | USD 0.08 B (2024) | Uses a narrower definition that appears closer to insurtech startup and vendor revenue only, which can exclude insurer-led digital distribution and broader enablement services across MEA. |
| Trade Journal B | USD 0.11 B (2030) | Leans on a single growth curve from a 2024 starting point and may undercount managed services and support revenue, with limited visibility into country-level rollout pacing and product mix changes. |
The table shows that the spread is driven less by math and more by what is being counted, and when. By keeping the scope anchored to repeatable signals like digital channel penetration, monetization patterns, and regulatory readiness, the final number stays traceable and practical to update year over year.


Key Questions Answered in the Report
How large is the Middle East and Africa Insurtech market in 2026?
The Middle East and Africa Insurtech market size is USD 13.06 billion in 2026.
What is the forecast for CAGR through 2031?
The market is projected to expand at an 8.03% CAGR, reaching USD 19.23 billion by 2031.
Which product line leads the premium?
Health insurance leads with 33.68% of the 2025 written premiums.
Which segment is growing fastest?
Specialty lines—cyber, marine, pet, and travel—are forecast at 10.96% CAGR.
Which geography records the highest growth rate?
Saudi Arabia is expected to post a 10.05% CAGR between 2026 and 2031.
What key driver propels demand?
Mandatory health and motor insurance programs across GCC states add the most incremental premium.
Page last updated on:






