
Market Overview
| Study Period | 2020 - 2031 |
|---|---|
| Forecast Data Period | 2026 - 2031 |
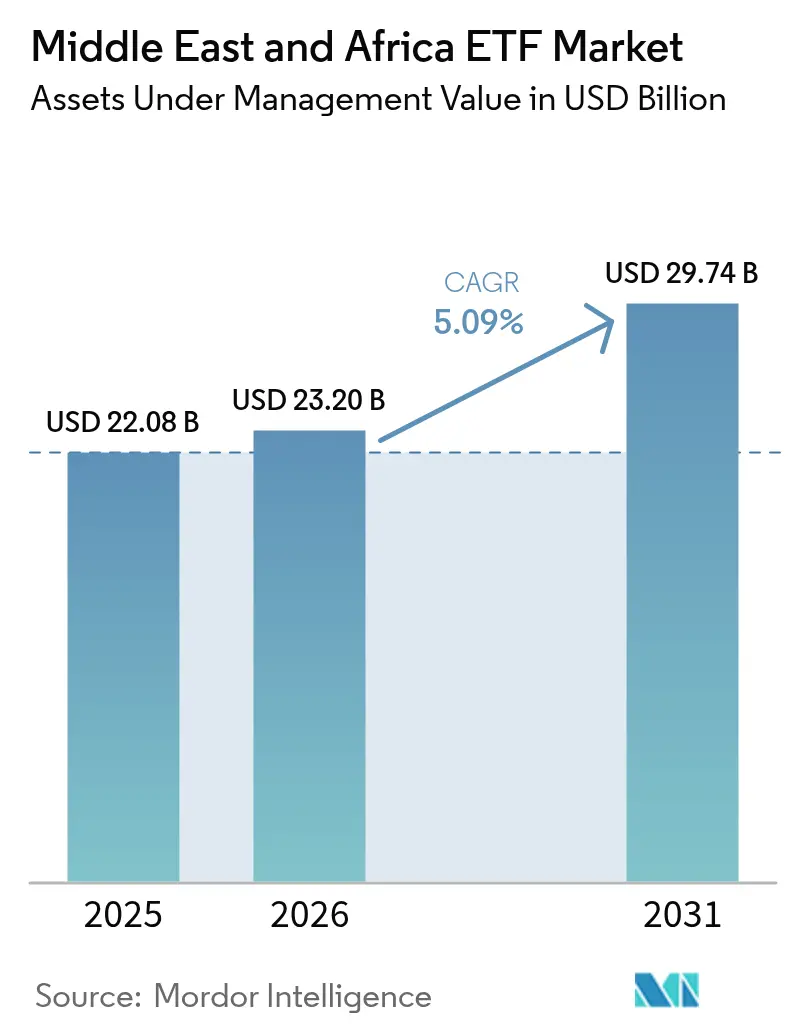
| Base Year Market Size (2025) | USD 22.08 Billion |
| Market Size (2026) | USD 23.2 Billion |
| Market Size (2031) | USD 29.74 Billion |
| Growth Rate (2026 - 2031) | 5.09% CAGR |
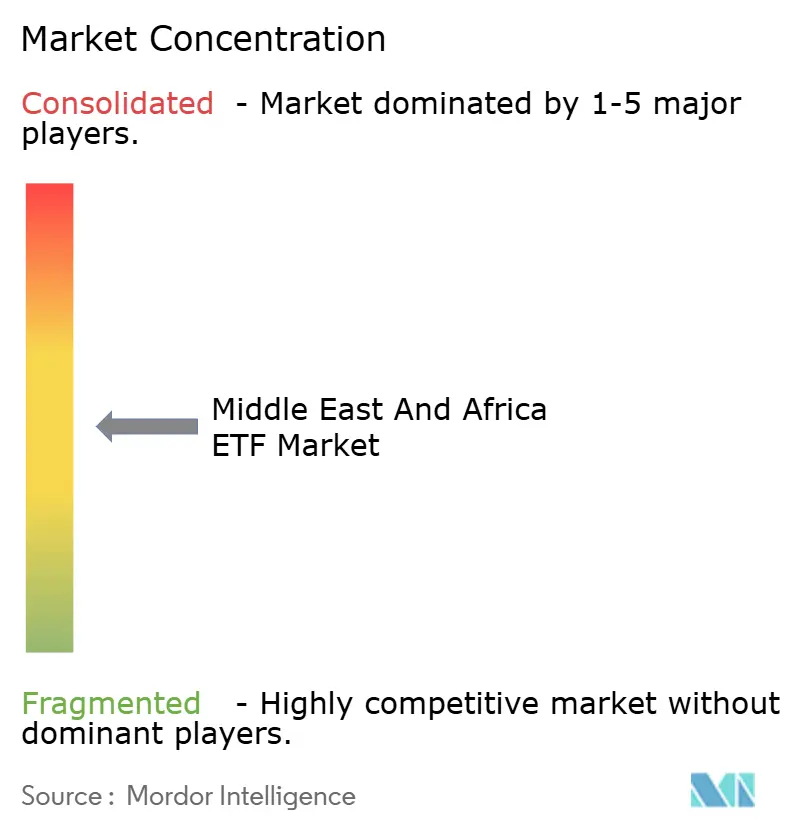
| Market Concentration | Medium |
Major Players *Disclaimer: Major Players sorted in no particular order Image © Mordor Intelligence. Reuse requires attribution under CC BY 4.0. | |
Middle East And Africa ETF Market Analysis by Mordor Intelligence
Middle East and Africa ETF market size in 2026 is estimated at USD 23.2 billion, growing from 2025 value of USD 22.08 billion with 2031 projections showing USD 29.74 billion, growing at 5.09% CAGR over 2026-2031. The region’s rapid capital-market reforms, rising digital-platform penetration, and growing demand for Sharia-compliant fixed-income products are reinforcing momentum. Sovereign-wealth-fund allocations, exemplified by the Saudi Public Investment Fund’s USD 200 million anchor commitment to a Saudi bond ETF, highlight the institutional pull that continues to deepen liquidity and product breadth. Digital-first retail adoption, regulatory fee waivers on exchange trading, and post-trade infrastructure upgrades are collectively lowering transaction frictions and improving price discovery. At the same time, the gradual rotation from commodity-heavy portfolios toward global equity exposure is broadening the investor base and attracting international issuers keen to capture first-mover advantages in the Middle East and Africa ETF market.
Key Report Takeaways
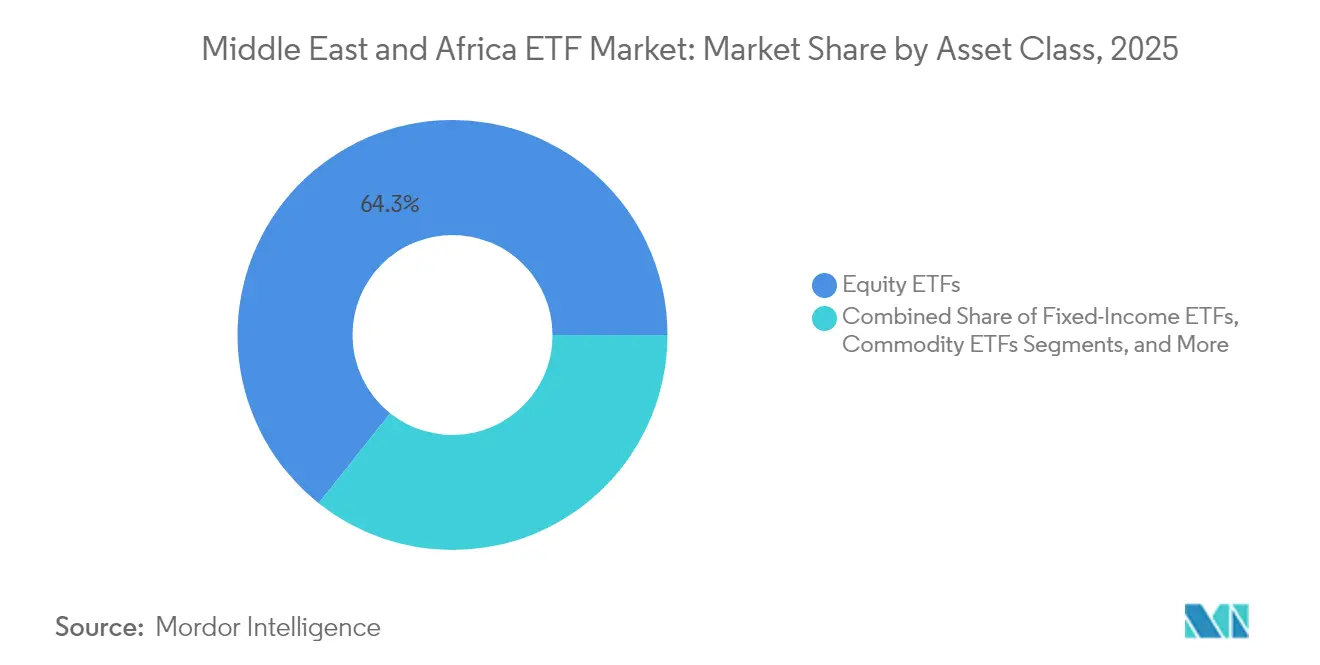
- By asset class, equity ETFs led with 64.30% of Middle East and Africa ETF market share in 2025, while fixed-income ETFs are projected to compound at a 6.52% CAGR through 2031.
- By investment strategy, passive products dominated with 76.10% of the Middle East and Africa ETF market share in 2025; active ETFs are expected to post the fastest growth at 7.02% CAGR to 2031.
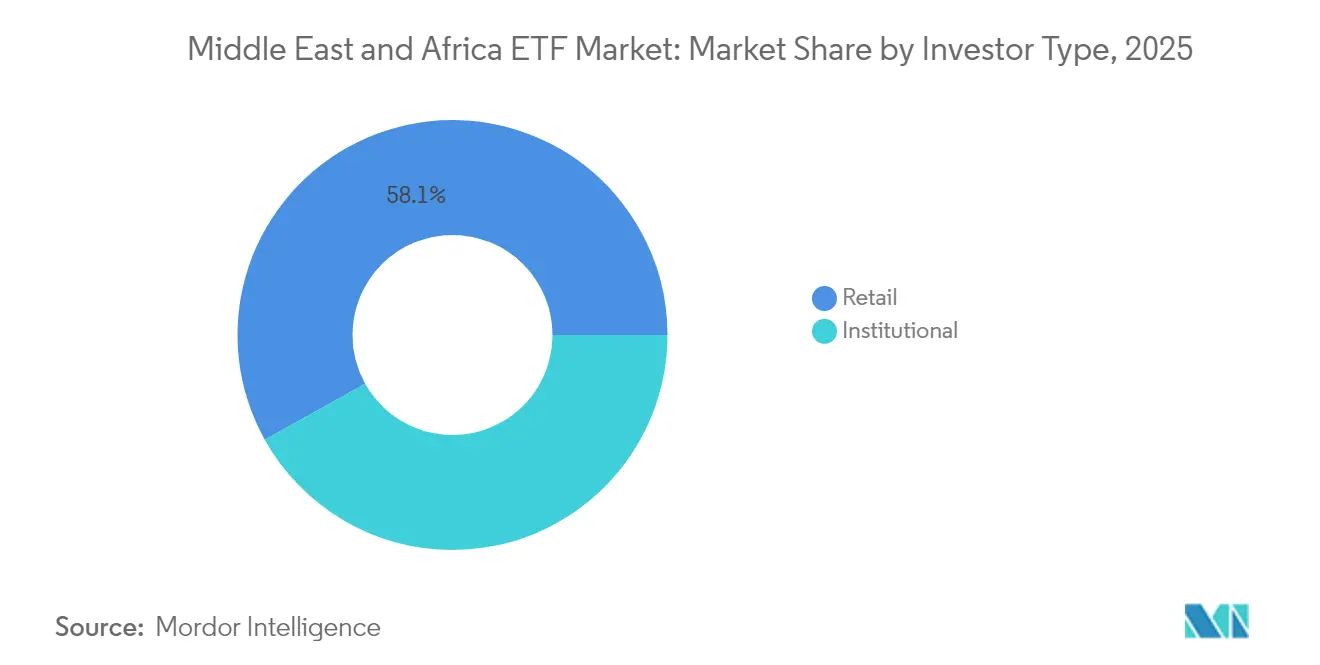
- By investor type, retail investors accounted for 58.10% of the Middle East and Africa ETF market share in 2025; institutional flows are slated to rise at a 5.92% CAGR through 2031.
- By distribution channel, direct and digital retail platforms captured 35.60% share of the Middle East and Africa ETF market size in 2025 and are expanding at 7.48% CAGR to 2031.
- By geography, Saudi Arabia held 21.45% of the Middle East and Africa ETF market in 2025, whereas the United Arab Emirates is forecasted to grow the fastest at a 6.31% CAGR through 2031.
Note: Market size and forecast figures in this report are generated using Mordor Intelligence’s proprietary estimation framework, updated with the latest available data and insights as of 2026.
Middle East And Africa ETF Market Trends and Insights
Drivers Impact Analysis*
| Driver | (~) % Impact on CAGR Forecast | Geographic Relevance | Impact Timeline |
|---|---|---|---|
| GCC Capital-Market Reforms & Index Upgrades | +1.2% | Saudi Arabia, UAE, Qatar, Kuwait | Medium term (2-4 years) |
| Qatar & Saudi Fee Waivers Boosting On-Exchange ETF Liquidity | +0.9% | Qatar, Saudi Arabia | Short term (≤ 2 years) |
| Commodity-to-Equity Portfolio Diversification | +0.8% | GCC countries, South Africa | Long term (≥ 4 years) |
| Rise of Sharia-Compliant Sukuk ETFs | +0.7% | Saudi Arabia, UAE, Qatar, Kuwait | Medium term (2-4 years) |
| CBDC and Digital-Asset Frameworks | +0.5% | UAE, Saudi Arabia | Long term (≥ 4 years) |
| Pension-Fund Auto-Enrolment in Nigeria & Kenya | +0.5% | Nigeria, Kenya | Medium term (2-4 years) |
| Source: Mordor Intelligence | |||
GCC Capital-Market Reforms & Index Upgrades (MSCI/FTSE)
Foreign equity inflows doubled to USD 60 billion by end-2024 after Saudi Arabia’s MSCI Emerging Markets weight rose to 4.4%. Post-trade system upgrades on the Saudi Exchange improved creation and redemption cycles, narrowing ETF tracking error and attracting global issuers eager to scale in the Middle East and Africa ETF market[1]Saudi Exchange, “Post-Trade Transformation Program Completion,” saudiexchange.sa.
Qatar & Saudi Fee Waivers Boosting On-Exchange ETF Liquidity
Trading-fee eliminations compressed bid-ask spreads, lifting lendable inventory in Saudi Arabia by 190% year-on-year in early 2025[2]State Street Global Advisors, “Global ETF Flows Report 2025,” ssga.com. Heightened turnover has spurred market-maker participation, accelerating volume growth in fixed-income funds across the Middle East and Africa ETF market.
Rise of Sharia-Compliant Sukuk ETFs
Sovereign-wealth-fund demand for sukuk exposure underpins the 6.7% CAGR outlook for fixed-income ETFs. The May 2025 debut of an Asia-listed Saudi sukuk ETF illustrates global appetite for these instruments, further internationalizing the Middle East and Africa ETF market.
CBDC and Digital-Asset Frameworks
Regulatory sandboxes in the UAE and Saudi Arabia are paving the way for crypto-linked ETFs. These frameworks enhance custody clarity and settlement efficiency, laying the groundwork for diversified digital-asset strategies within the Middle East and Africa ETF market.
Restraints Impact Analysis*
| Restraint | (~) % Impact on CAGR Forecast | Geographic Relevance | Impact Timeline |
|---|---|---|---|
| Fragmented Listing Rules | -0.4% | Pan-regional | Medium term (2-4 years) |
| Low Liquidity Outside GCC & South Africa | -0.3% | Nigeria, Kenya, Egypt, Rest of MEA | Short term (≤ 2 years) |
| Foreign-Ownership Caps | -0.2% | Egypt, Nigeria, Kuwait | Long term (≥ 4 years) |
| High Withholding-Tax Leakage | -0.2% | Pan-regional | Medium term (2-4 years) |
| Source: Mordor Intelligence | |||
Fragmented Listing Rules Raising Tracking-Error Costs
Differing disclosure and creation-redemption protocols force issuers to run bespoke processes, inflating expense ratios and widening deviations between market price and NAV. Although a GCC passporting initiative is slated for 2025, initial coverage will exclude ETFs, preserving cost headwinds across the Middle East and Africa ETF market.
Low Secondary-Market Liquidity Outside GCC & South Africa Elevates Bid-Ask Spreads
Wide spreads—often exceeding 100 bps—discourage large trades in Nigeria, Kenya, and Egypt. Limited market-maker depth undermines confidence, particularly in thematic funds, hindering fuller participation in the Middle East and Africa ETF market.
*Our forecasts treat driver/restraint impacts as directional, not additive. The impact forecasts reflect baseline growth, mix effects, and variable interactions.
Segment Analysis
By Asset Class: Fixed-Income ETFs Accelerate on Sukuk Demand
Equity ETFs dominated the Middle East and Africa ETF market with a 64.30% share in 2025, yet sukuk launches provide diversified yield for investors wary of rate volatility. Fixed-income products, though smaller than equities, are projected to grow 6.52% annually, powered by sovereign-wealth-fund allocations to sukuk mandates. Commodity funds, chiefly gold-linked, offer inflation protection, while currency and real-estate strategies remain niche. The Franklin Global Sukuk Fund’s regional allocation underscores mounting institutional appetite for Islamic-compliant credit.
Broader adoption of sukuk ETFs is deepening secondary-market depth, narrowing spreads, and encouraging cross-border listings. As foreign investors gain confidence in Saudi and UAE sovereign curves, fixed-income exposure within the Middle East and Africa ETF market is expected to converge toward global best practices in portfolio construction and liquidity management.


By Investment Strategy: Active ETFs Gain Traction Amid Market Inefficiencies
Passive segment held a 76.10% share of the Middle East and Africa ETF market in 2025. Active strategies are forecasted to see 7.02% CAGR through 2031, capitalizing on price dislocations and sectoral imbalances. Regulatory adjustments now permit non-transparent structures, allowing managers to implement proprietary screens while retaining ETF liquidity benefits. Sovereign-wealth-fund mandates are increasingly carving out allocations for tactical active overlays, reinforcing demand across the Middle East and Africa ETF market.
Evolving investor preferences for outcome-oriented solutions, such as dividend quality or low-volatility screens, are pressing issuers to differentiate through active wrappers. Enhanced digital distribution funnels these strategies into retail portfolios, providing accessible exposure to specialized themes without traditional fund minimums.
By Investor Type: Retail Dominance Sustained as Institutional Flows Accelerate
Retail clients accounted for 58.10% of the Middle East and Africa ETF market in 2025, reflecting intuitive app-based access and sub-USD 100 entry points. Younger demographics leverage ETFs for core holdings, supporting steady inflows to the Middle East and Africa ETF market. Meanwhile, institutions are scaling exposure, especially to fixed-income products, amid reforms that encourage defined-contribution structures across GCC pension systems. The institutional segment is projected to grow at a CAGR of 5.92% between 2026 and 2031.
As auto-enrolment frameworks mature in Nigeria and Kenya, institutional penetration is set to expand. Multi-asset model portfolios increasingly embed ETF cores, lowering operational complexity and boosting transparency for trustees and regulators alike.
By Distribution Channel: Digital Platforms Reshape Access
Direct and Digital Retail Platforms commanded a 35.60% share and display the fastest growth at 7.48% CAGR. Fractional trading, robo-advisory integration, and commission-free pricing democratize ownership for first-time investors. Hybrid partnerships between incumbent banks and fintech firms blend advisory depth with technological scalability, reinforcing the Middle East and Africa ETF market’s distribution transformation.
Financial advisers still wield influence for affluent segments, but fee compression pushes them toward asset-allocation services rather than product selection. Institutional channels remain pivotal for block trades and bespoke baskets, particularly in Saudi Arabia, where sovereign-wealth-fund trades can exceed USD 100 million per ticket.
Geography Analysis
Saudi Arabia retained a 21.45% share of the Middle East and Africa ETF market in 2025, underpinned by Vision 2030 reforms, post-trade automation, and index inclusions that lifted foreign inflows. Completion of the TASI 50 benchmark facilitates granular exposure, while USD 1 trillion in planned infrastructure outlays presents scope for thematic launches in logistics, green hydrogen, and banking.
The United Arab Emirates exhibits the region’s quickest trajectory at a 6.31% CAGR through 2031. Regulatory clarity from Dubai’s Virtual Assets Regulatory Authority supports crypto-linked fund structures, and the expansion of the DEWS pension scheme channels steady contributions toward passive solutions. ESG and clean-energy themes resonate with the government’s net-zero ambitions, nudging issuers to cross-list sustainable strategies on Abu Dhabi’s ADX.
South Africa features the continent’s most mature ETF ecosystem, anchored by Satrix, 1nvest, and Sygnia Itrix. While liquidity concentrates in flagship indices, actively managed wrappers are gaining share as retail demand for tactical plays rises. The Johannesburg Stock Exchange’s robust settlement backbone makes the market a regional benchmark for trading efficiency within the Middle East and Africa ETF market.
Regulatory Landscape
ETF authorization and ongoing compliance in the Middle East and Africa are being tightened and modernized through exchange and regulator rulebooks, with Saudi Arabia and the UAE among the main rule-setters. In Saudi Arabia, ETF registration and offering sit under the Capital Market Authority (CMA) framework, including the Investment Funds Regulations (amended in 2025), while Saudi Exchange rules shape on-venue trading and liquidity support. In December 2025, the Saudi Exchange implemented amendments to its Market Making Regulations and Procedures that specifically strengthen ETF market-making governance, with tighter spreads and more reliable secondary-market liquidity as the stated targets.
In 2026, regulators added further building blocks for product issuance and investor protection. In March 2026, the CMA Board issued Instructions of Simplified Investment Funds (Resolution No. 1-26-2026), introducing a more flexible approach to certain fund structures, and in April 2026 the CMA approved Al Rajhi Capital to offer the Al Rajhi MSCI Saudi Equity Dividends ETF on Tadawul. In the UAE, the Dubai Financial Services Authority (DFSA) published Consultation Paper No. 173 in July 2026 proposing significant updates to its Collective Investment Fund framework (its first major review since 2010), while its existing rules in the DIFC continue to define ETF characteristics and constraints. South Africa also adds market-infrastructure safeguards, including JSE requirements that include audit expectations around cold storage for crypto-asset custody where crypto-based ETPs are involved.
Value Chain Analysis
The MEA ETF value chain runs from index and benchmark design through product structuring and Sharia screening (where relevant), then fund management, custody, and portfolio operations, followed by primary-market creation and redemption supported by authorized participants and market makers. Listing venues such as Tadawul (Saudi Exchange), ADX (Abu Dhabi Securities Exchange), and the JSE sit at the center of distribution, while brokers, banks, and direct-to-consumer digital platforms route orders and enable fractional access for retail participants. Institutional anchors, including sovereign wealth funds and domestic pensions, also play an outsized role by seeding AUM for new launches and supporting early trading depth, particularly for fixed-income and sukuk-linked products.
Liquidity provision and rule harmonization are key choke points and enablers across the chain. Policy actions like the Qatar Financial Markets Authority trading-fee waiver in March 2025 directly reduce transaction friction and improve displayed liquidity, while exchange-level choices on market making influence day-to-day spreads and inventory availability. Cross-border scaling depends on operational readiness for secondary listings and local investor access, but the delisting of the Cloud Atlas Big 50 Africa ETF from the JSE in 2024 highlighted how thin underlying markets outside the largest MEA venues can undermine ETF viability when constituent liquidity is limited. Product distribution is also becoming more internationalized as global issuers use GCC hubs for regional reach, with listings such as KraneShares on ADX in 2025 reflecting how exchange access and local service providers, including custody, market making, and settlement, can shorten time-to-market.
Competitive Landscape
Global giants such as BlackRock’s iShares, State Street Global Advisors, and Invesco compete alongside regional specialists including Emirates NBD Asset Management, Chimera Capital, and Satrix. Product pipelines increasingly target first-to-market status in Sharia-compliant fixed income and digital-asset baskets, reflecting the strategic importance of differentiation in the Middle East and Africa ETF market.
White-label platforms lower barriers for boutique managers seeking rapid entry, while sovereign-wealth-fund endorsements provide scale advantages to domestically domiciled issuers. Technology upgrades on the Saudi Exchange and the UAE’s adoption of streamlined listing rules enable quicker time-to-market and support efficient creation-redemption cycles.
Competitive dynamics are sharpening as active ETFs proliferate. Global issuers leverage quantitative research pedigrees to launch rule-based active funds, while regional managers highlight local-market insights. Strategic alliances, such as co-branded sukuk products between Hong Kong and Saudi entities, signal growing cross-border collaboration aimed at deepening the Middle East and Africa ETF market linked to the wider global investor base.
Middle East And Africa ETF Industry Leaders
Satrix
1nvest
Sygnia Itrix
Tabula Investment Management
STANLIB
- *Disclaimer: Major Players sorted in no particular order

Market Opportunities and Future Outlook
Opportunity is being created as regulators and exchanges broaden the addressable ETF shelf and improve market microstructure. In Saudi Arabia, the CMA approval for Al Rajhi Capital to publicly offer the Al Rajhi MSCI Saudi Equity ETF in June 2026 adds another locally anchored issuer to the domestic lineup, strengthening competition in beta building blocks and creating room for differentiated factor and dividend variants. In the UAE, Sharia-compliant income themes are moving from concept to listed products, illustrated by Lunate listing the Chimera Solactive GCC Shariah Dividend ETF on ADX on June 23, 2026. This supports a clearer pathway for additional GCC-focused Sharia strategies and cross-listing activity where investor demand is already visible on regional exchanges.
A second whitespace area is rule standardization and trading efficiency, which directly affects liquidity and ETF adoption beyond the deepest venues. Egypt took a step toward more formal index-tracking fund governance with EGX rolling out new regulations for index-tracking investment funds in June 2026, and Kuwait advanced its ETF ecosystem with Boursa Kuwait approving a new regulatory and legislative framework for ETFs in June 2026. Tighter investor-protection requirements can also change product design and custody practices, as shown when Nigeria’s SEC halted new gold-backed ETF issuances in May 2026 pending audited proof of physical backing. Meanwhile, ADX’s decision to remove daily price limits on ETFs and futures, effective August 3, 2026, targets better market-maker functioning and price discovery. Taken together, these actions point to near-term commercial whitespace for issuers and service providers that can meet higher transparency standards while supporting tighter spreads and scalable secondary-market liquidity.
Recent Industry Developments
- July 2026: Satrix expanded its African footprint into Botswana by securing secondary listings for three JSE-listed feeder ETFs on the Botswana Stock Exchange (MSCI World Equity Feeder, MSCI Emerging Markets Feeder, and S&P 500 Feeder). The move extends offshore beta access through a local venue and broadens the addressable investor base beyond South Africa, supporting cross-border ETF distribution models within Sub-Saharan Africa.
- July 2025: Satrix completed the secondary listing of the Satrix MSCI World Feeder ETF on the Nairobi Securities Exchange (NSE). This expanded Kenyan investors access to global equities via an on-exchange wrapper and strengthened the role of secondary listings as a practical route to scale ETF usage in markets with smaller domestic product shelves.
- March 2024: State Street Global Advisors highlighted robust non-US inflows within its SPDR ETF suite, pointing to stronger demand for emerging-market exposures. The disclosure underscored the continued role of global issuers and cross-border investor appetite in shaping product positioning and distribution priorities for MEA-linked allocations.


Research Methodology Framework and Report Scope
Market Definition and Coverage
For this study, the market covers exchange-traded funds (ETFs) listed across Middle East and Africa exchanges, measured as total assets under management (AUM) valued in USD for the calendar year. We compute AUM using fund units outstanding multiplied by end-period pricing.
Scope exclusions: We exclude closed-end funds, exchange-traded notes, and products marketed to investors without a primary Middle East or Africa listing.
Segmentation Overview
- By Asset Class
- Equity ETFs
- Fixed-Income ETFs
- Commodity ETFs
- Currency ETFs
- Real-Estate ETFs
- Alternative ETFs
- By Investment Strategy
- Active
- Passive
- By Investor Type
- Retail
- Institutional
- By Distribution Channel
- Direct and Digital Retail Platforms
- Financial Advisors and Wealth Managers
- Institutional Channels
- Traditional Banks and Full-Service Brokers
- By Country
- United Arab Emirates
- Saudi Arabia
- Qatar
- Kuwait
- Oman
- Bahrain
- Egypt
- South Africa
- Nigeria
- Rest of Middle East and Africa
Data Sources, Market Sizing, and Validation
Desk Research
Desk research sets the guardrails for what should be counted as an ETF in this region and how AUM should be valued consistently across countries. We relied on public, non-paywalled sources such as exchange websites and listing rulebooks (for listing and product definitions), central bank and securities regulator publications (for market structure and fund oversight), IMF and World Bank datasets (for macro and capital-market indicators), and OECD-style statistical releases where available for fund flows and investor participation.
On top of that, we used issuer fund factsheets, annual reports, and investor presentations to understand units outstanding, fee schedules, and product changes that can shift AUM. Reputed business press and exchange notices helped flag new launches, delistings, and major index changes. Where needed, paid subscriptions for company financials and news intelligence were used to cross-check timelines and disclosures, and patent databases were referenced for structuring signals. This list is not exhaustive, and many other sources were referred to for data collection, validation, and research clarification.
Primary Interviews and Surveys
Primary work was used to verify how regional ETF AUM is tracked in practice and to sense-check how pricing moves, liquidity constraints, and investor mix changes show up in reported assets. We spoke with a mix of ETF issuers, exchange and market infrastructure participants, institutional allocators, and distribution-side professionals across the Gulf and key African markets, then used their feedback to tighten assumptions that were unclear in public documents.
Distribution of primary research fieldwork respondents
| Company type | Respondent position | Region |
|---|---|---|
| Top tier: 27% | CXOs: 13% | |
| Mid tier: 53% | Functional/Unit leaders: 42% | |
| Smaller Players: 20% | Managers: 45% |
Market-Sizing & Forecasting
We sized the market mainly using a top-down build that reconstructs regional ETF AUM by country coverage. For each country, we start from the exchange-listed ETF universe and value it using units outstanding multiplied by end-period prices, then convert into USD using a consistent timing basis across geographies. After forming totals, we added selective bottom-up checks, including rolling up a sample of large funds by issuer, and using channel feedback on what share of the listed universe is actively tradable versus nominally listed.
Key inputs that shaped the model included the count of listed ETFs by exchange, net creation and redemption trends (as reflected by units outstanding), price movements in the main underlying exposures (equity, fixed income, commodities, and sukuk-linked baskets), headline FX movements that affect USD AUM, and the pace of new listings or delistings. Because some exchanges and issuers disclose data with different lags, missing points were handled by carrying forward the last confirmed units outstanding and then adjusting for known corporate actions and price moves before the next disclosure window.
For forecasting, scenario analysis was used, anchored on expected ETF adoption and the capital-market reform pace discussed in interviews, then translated into AUM growth paths using assumptions for net inflows and market performance. We kept the outputs practical by ensuring each scenario could be traced back to a small set of observable indicators rather than overly complex equations.
Data Validation & Update Cycle
Validation was done through multiple passes that compare the modeled AUM totals against independent market signals, including exchange-published product lists, major fund factsheet snapshots, and reported changes in units outstanding where available. When an outlier appeared, it was reviewed for currency timing issues, stale pricing, delistings, and one-off large creations or redemptions, then corrected only after a second analyst review.
Reports are refreshed annually, and interim updates are triggered when a material event changes the investable universe, such as a major exchange rule change, a wave of new ETF launches, or a sharp market move that impacts AUM. Before delivery, we run a final update pass to ensure the latest public disclosures and news-linked events are reflected in the numbers and commentary.
Mordor Intelligence's Middle East and Africa Etf Market Size Compared Against Other Published Estimates
Published estimates for the Middle East and Africa ETF market can differ even when the same region is named, because the underlying counting rules are not always identical. The biggest differences typically come from whether the estimate treats the market as AUM at period-end, whether cross-listed products are included, and how USD conversion timing is handled for countries with higher FX swings.
Exchange product lists, fund factsheets, and units-outstanding checks are the evidence points that keep Mordor Intelligence tied to a repeatable AUM definition (end-period price multiplied by units outstanding) and a clear primary listing rule, instead of mixing in non-listed vehicles or marketing-only distributions.
Benchmark comparison
| Source | Market Size | Gaps in Research Methodology |
|---|---|---|
| Mordor Intelligence | USD 22.08 B (2025) | |
| Trade Journal A | USD 22.11 B (2025) | Uses a broad AUM snapshot narrative that can blend GCC-only totals with wider MEA coverage and may not standardize FX timing across markets, which can slightly shift USD totals. |
| Industry Publication B | USD 28.68 B (2030) | Presents a forward value without a transparent step-by-step link to units outstanding and end-period pricing, and the definition of what is counted as an ETF versus adjacent listed products is not clearly stated. |
The table shows that the spread is small when the same year and an AUM-style definition are used, and it grows when a forecast year is compared against a base-year estimate. By keeping the scope tied to listed ETFs in the region and valuing assets with consistent timing, the final number stays traceable to simple inputs that can be rechecked and updated.


Key Questions Answered in the Report
What is the current value of the Middle East and Africa ETF market?
The market is valued at USD 23.2 billion in 2026 and is forecast to reach USD 29.74 billion by 2031.
Which asset class is growing fastest within the region’s ETF universe?
Fixed-Income ETFs, propelled by sukuk demand, are projected to expand at a 6.52% CAGR between 2026 and 2031.
How important are retail investors to regional ETF growth?
Retail accounts for 58.10% of turnover and remains the primary volume driver thanks to digital-platform accessibility and low investment thresholds.
Why are active ETFs gaining momentum in the Middle East and Africa ETF market?
Active wrappers appeal to investors seeking to exploit market inefficiencies and sector opportunities unique to the region, leading to an expected 7.02% CAGR.
Which country leads the region in ETF assets under management?
Saudi Arabia holds the largest share at 21.45%, supported by post-trade infrastructure upgrades and sovereign-wealth-fund sponsorship.
What regulatory development could most improve cross-border ETF distribution?
The planned GCC fund passporting system, expected to roll out after 2025, aims to harmonize rules and reduce listing-cost fragmentation across member exchanges.
Page last updated on:






