
Market Overview
| Study Period | 2020 - 2031 |
|---|---|
| Forecast Data Period | 2026 - 2031 |
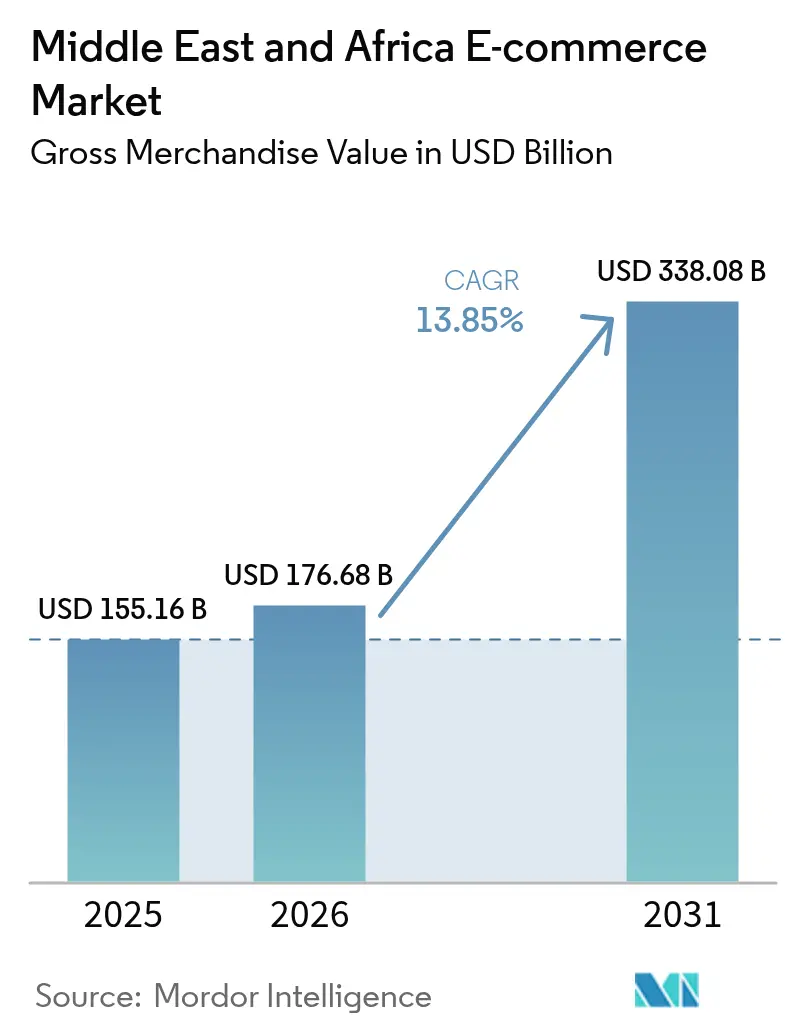
| Base Year Market Size (2025) | USD 155.16 Billion |
| Market Size (2026) | USD 176.68 Billion |
| Market Size (2031) | USD 338.08 Billion |
| Growth Rate (2026 - 2031) | 13.85% CAGR |
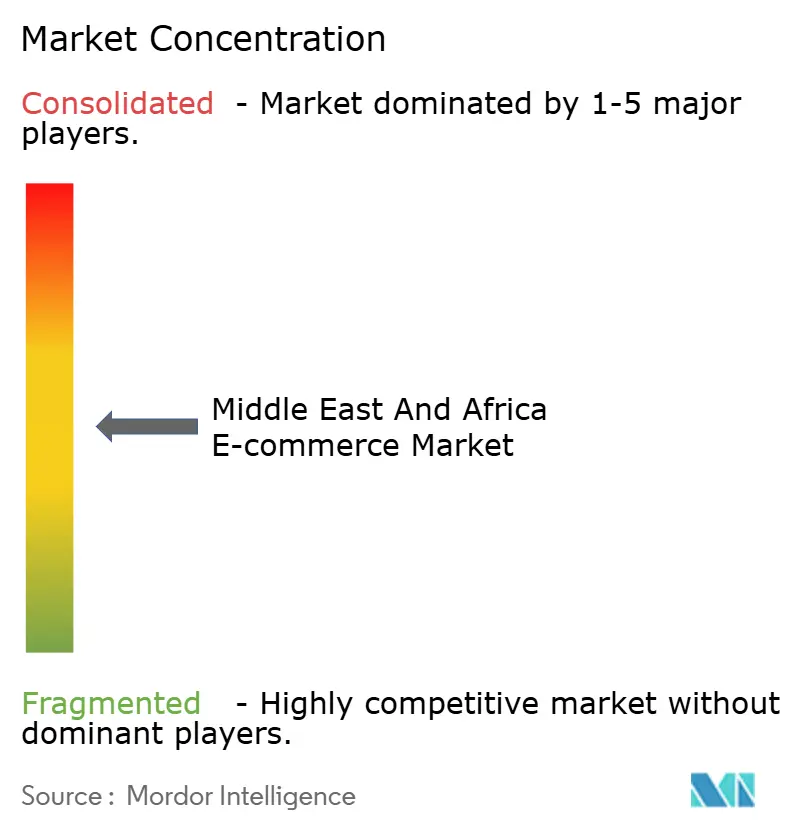
| Market Concentration | Medium |
Major Players *Disclaimer: Major Players sorted in no particular order Image © Mordor Intelligence. Reuse requires attribution under CC BY 4.0. | |
Middle East And Africa E-commerce Market Analysis by Mordor Intelligence
The Middle East and Africa e-commerce market size was valued at USD 155.16 billion in 2025 and estimated to grow from USD 176.68 billion in 2026 to reach USD 338.08 billion by 2031, at a CAGR of 13.85% during the forecast period (2026-2031). Healthy disposable-income growth in the Gulf, accelerating smartphone upgrades, and logistics investments are jointly expanding the addressable base of online shoppers. Marketplaces are courting consumers with ultra-fast delivery promises, while merchants adopt embedded-finance tools that smooth checkout friction. Cross-border corridors, especially China-to-GCC and intra-Africa routes, now carry a rising share of parcels, signaling greater integration between regional sellers and global supply chains. As regulatory sandboxes scale, fintech and e-commerce firms are co-developing credit-at-checkout products that spur basket-size growth, reinforcing a virtuous cycle of digital adoption.
Key Report Takeaways
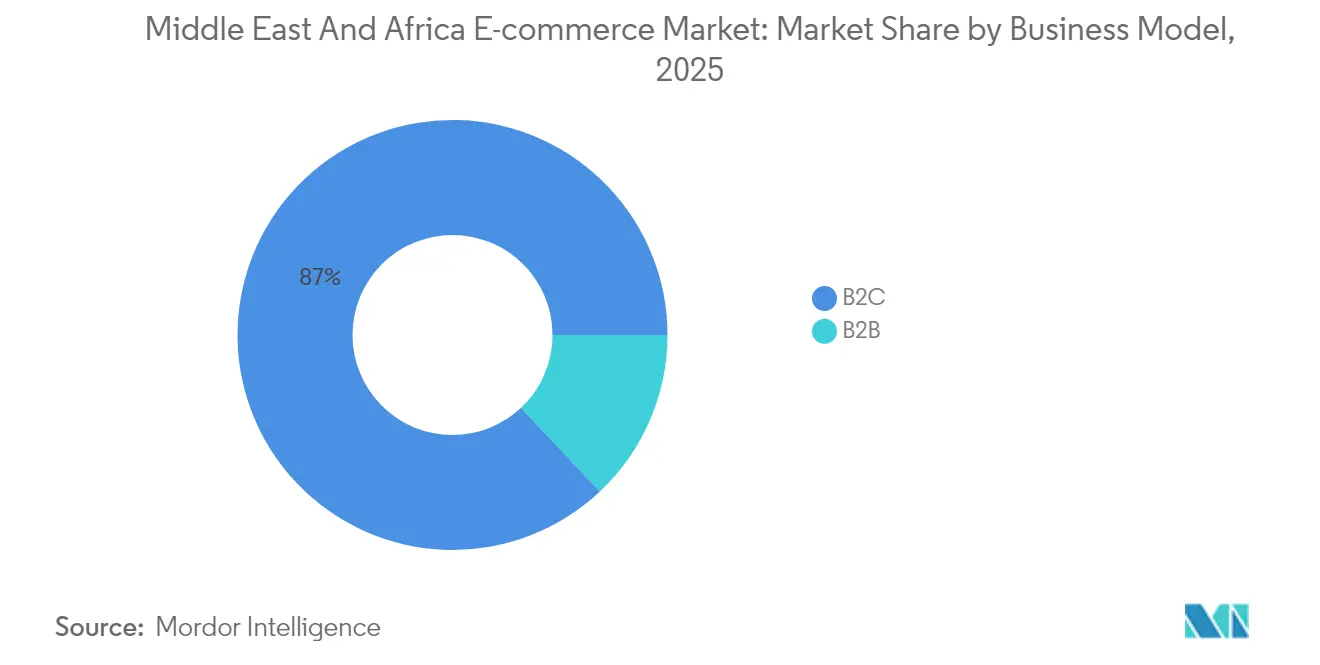
- By business model, the B2C segment held 87.02% of the Middle East and Africa e-commerce market size in 2025, while B2B is projected to post the highest CAGR at 15.97% during 2026-2031.
- By product category for B2C, Fashion and Apparel led with 25.96% of Middle East and Africa e-commerce market share in 2025; Food and Beverages is forecast to expand at a 14.41% CAGR through 2031.
- By device type for B2C, smartphones captured 71.78% of Middle East and Africa e-commerce market share in 2025 and are advancing at a 15.36% CAGR to 2031.
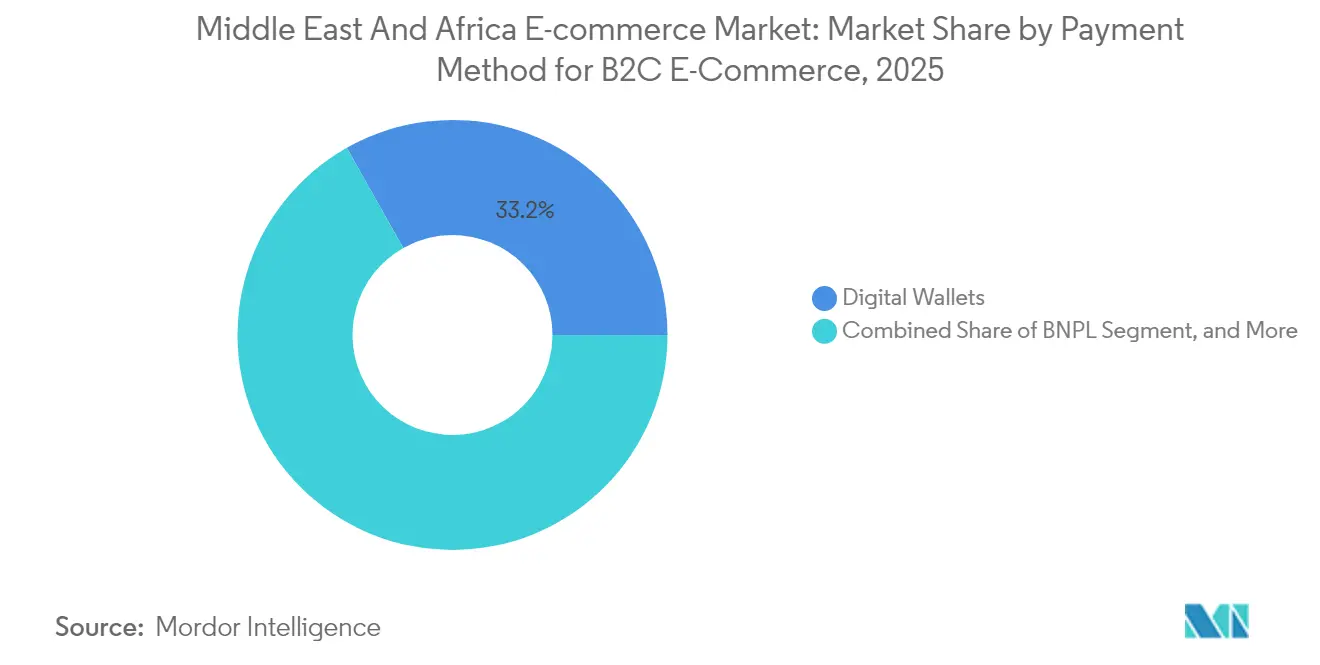
- By payment method for B2C, digital wallets accounted for 33.18% of the Middle East and Africa e-commerce market size in 2025; Buy Now Pay Later is set to expand at 14.21% CAGR over the same horizon.
- By geography, Saudi Arabia commanded 34.12% revenue share in 2025 and is growing at a 14.59% CAGR through 2031.
Note: Market size and forecast figures in this report are generated using Mordor Intelligence’s proprietary estimation framework, updated with the latest available data and insights as of 2026.
Middle East And Africa E-commerce Market Trends and Insights
Drivers Impact Analysis*
| Driver | (~) % Impact on CAGR Forecast | Geographic Relevance | Impact Timeline |
|---|---|---|---|
| Rising smartphone penetration and affordable data plans | +2.8% | Global, with UAE and Saudi Arabia leading adoption | Medium term (2-4 years) |
| Government-led digital transformation and cashless initiatives | +2.1% | Saudi Arabia, UAE, South Africa core markets | Long term (≥ 4 years) |
| Expansion of logistics and fulfilment infrastructure | +1.9% | MENA core, spill-over to Sub-Saharan Africa | Medium term (2-4 years) |
| Surge in digital wallet adoption and interoperability | +1.7% | Regional focus on GCC and North Africa | Short term (≤ 2 years) |
| Cross-border marketplace enablement for MEA SMEs | +1.4% | Global, with emphasis on China-MEA corridors | Long term (≥ 4 years) |
| AI-driven Arabic-dialect personalisation | +1.2% | Arabic-speaking markets primarily | Medium term (2-4 years) |
| Source: Mordor Intelligence | |||
Rising Smartphone Penetration and Affordable Data Plans
Smartphones already drive 72.41% of regional B2C transactions, and the metric keeps rising as 4G and 5G coverage expands in GCC cities. Annual data-price declines make video-rich listings and augmented-reality try-ons accessible to middle-income shoppers, boosting conversion on fashion and furniture SKUs. Retailers layer super-app features, ride-hailing, food delivery, peer-to-peer payments, so users stay in-app from discovery to post-purchase engagement. In markets such as Saudi Arabia, mobile-initiated orders grew 9% year over year in 2024, underscoring the structural tilt toward handheld commerce. Robust handset upgrade cycles will keep mobile bandwidth demand high, sustaining incremental gains in session time and order frequency across the Middle East and Africa e-commerce market.
Government-Led Digital Transformation and Cashless Initiatives
Saudi Arabia’s Vision 2030 and the UAE’s national digital-economy agenda oblige ministries to migrate services online, normalizing e-payments across daily life. Revised e-invoicing mandates, real-time gross-settlement rails, and open-banking frameworks shrink cash usage, and cash-on-delivery preferences have already fallen 51% across MENA. Fintech sandboxes run by SAMA and CBUAE allow wallets, BNPL, and tokenized-payment pilots to operate under clear guardrails, lifting merchant confidence. Procurement portals such as Tradeling plug directly into public-sector purchasing systems, accelerating B2B order flows.[1]Tradeling Group, “The eMarketplace for MENA Business Buyers,” tradeling.com These reforms lock in long-term gains for the Middle East and Africa e-commerce market by institutionalizing digital trust and expanding access to working-capital tools for SMEs.
Expansion of Logistics and Fulfillment Infrastructure
Private operators and sovereign funds are pouring capital into automated sortation hubs, dark stores, and temperature-controlled fleets. Al-Futtaim Logistics’ deployment of AI-powered route planning shaved average delivery windows to same-day for 85% of Dubai orders.[2]Al-Futtaim Logistics, “Last-Mile Delivery for Ecommerce,” aflogistics.com In Africa, Jumia’s partnerships with postal agencies extend network reach into peri-urban zones, while micro-fulfillment nodes near Cairo and Casablanca enable sub-two-hour grocery dispatches. Smart-locker installations, 1,200 units in South Africa alone, circumvent informal addressing challenges. As Belt-and-Road infrastructure matures, container-to-parcel transload times on Sino-GCC corridors fall, lowering landed costs and enriching SKU depth in the Middle East and Africa e-commerce market.
Surge in Digital Wallet Adoption and Interoperability
Digital wallets processed 32.62% of B2C payments in 2024, aided by ISO 20022 messaging adoption that allows real-time settlement across issuers. HyperPay’s tap-on-phone capability turns any Android handset into a POS, onboarding micro-merchants without hardware outlays. Wallets embedded in ride-hailing and food apps create closed-loop ecosystems where loyalty points convert seamlessly to checkout credits. Central-bank mandates on tokenization and risk-based authentication push fraud rates lower, cementing consumer trust in the Middle East and Africa e-commerce market. Cross-border interoperability pacts with global processors further shrink friction on international orders.
Restraints Impact Analysis*
| Restraint | (~) % Impact on CAGR Forecast | Geographic Relevance | Impact Timeline |
|---|---|---|---|
| Persistent security and fraud concerns | -1.8% | Global, with heightened impact in emerging markets | Short term (≤ 2 years) |
| Low rural broadband connectivity in Sub-Saharan Africa | -1.5% | Sub-Saharan Africa, excluding urban centers | Long term (≥ 4 years) |
| Fragmented customs thresholds in intra-Africa trade | -1.1% | Africa-wide, particularly cross-border commerce | Medium term (2-4 years) |
| Escalating last-mile costs from informal addressing | -0.9% | Urban centers across MEA with informal settlements | Medium term (2-4 years) |
| Source: Mordor Intelligence | |||
Persistent Security and Fraud Concerns
Fraudulent chargebacks and account takeovers cost African merchants tens of millions USD in 2024, prompting heavier KYC investments and PSD2-style strong authentication rollouts. A high-profile breach that exposed 39 million customer records drew USD 1.9 million in penalties, accelerating GDPR-equivalent lawmaking in non-EU markets. Platforms now deploy machine-learning risk engines that score transactions in milliseconds, balancing false positives against shopper friction. Social-commerce channels introduce counterfeit-listing risks, forcing tighter seller-verification protocols. Despite these mitigations, lingering fear of data theft can delay first-time purchases, dampening growth potential in the Middle East and Africa e-commerce market until education campaigns and insurance products mature.
Low Rural Broadband Connectivity in Sub-Saharan Africa
Only small percentage of Nigeria’s food spend occurs online because patchy rural coverage throttles order density and inflates unit-delivery costs.[3]ECDB, “Food eCommerce Market in Nigeria,” ecommercedb.com MNOs are extending 4G pop-up towers along transport corridors, yet last-mile fiber remains commercially unviable in many agrarian districts. Satellite-internet pilots offer hope, but dish acquisition costs exceed annual farm incomes. Governments layer universal-service obligations into spectrum auctions, nudging operators toward shared-infrastructure models. Until cost-effective connectivity scales, the Middle East and Africa e-commerce market will rely on urban concentric growth, leaving rural households underserved.
*Our forecasts treat driver/restraint impacts as directional, not additive. The impact forecasts reflect baseline growth, mix effects, and variable interactions.
Segment Analysis
By Business Model: B2B Growth Surpasses B2C Maturity
B2C accounted for 87.02% of GMV in 2025, confirming its entrenched role in the Middle East and Africa e-commerce market size; yet B2B volumes are climbing at a 15.97% CAGR, signaling a structural pivot among wholesalers seeking transparent procurement. Tradeling extended USD 15 million in supplier credit to more than 65 SMEs, compressing order cycles from weeks to days. Egyptian wholesalers on Cartona report 30% inventory-turn acceleration after onboarding the platform. Because bulk orders travel via palletized freight, carriers monetize higher-margin capacity, encouraging logistics players to deploy dedicated B2B lanes. As blockchain-verified smart contracts automate dispute resolution, invoice-financing risk premia fall, stimulating additional supplier participation and reinforcing the B2B flywheel in the Middle East and Africa e-commerce market.
While consumer marketplaces chase loyalty via same-day grocery, B2B operators prioritize payment-term flexibility, localized after-sales support, and embedded-insurance modules. Regulatory clarity around electronic invoices and digital signatures boosts adoption among public-sector buyers, who increasingly procure office supplies and IT peripherals through vetted portals. Traditional B2C leaders such as Carrefour are piloting wholesale storefronts aimed at small restaurants, evidencing convergence between business models. This interplay sustains overall GMV momentum, ensuring B2B retains double-digit share in the broader Middle East and Africa e-commerce industry.


By Device Type for B2C E-Commerce: Mobile-First Era Consolidates
Smartphones delivered 71.78% of 2025 B2C GMV and will keep compounding at 15.36% CAGR, reinforcing mobile primacy within the Middle East and Africa e-commerce market share. Voice search, social-video shopping, and augmented-reality try-ons make small-screen buying more immersive, driving higher conversion on discretionary categories. Desktop retains niche relevance for big-ticket electronics and B2B catalog browsing, where screen real estate and complex configuration tools matter. Smart TVs and in-car infotainment systems form an emerging channel as affluent GCC households upgrade home and auto tech.
5G bandwidth removes latency barriers for livestream flash sales, while progressive-web-app caching secures seamless checkout in low-signal zones. Tap-on-phone enablers slash hardware costs for micro-merchants, onboarding kiosk operators and food-truck vendors who historically shunned digital payments. The virtuous cycle of mobile adoption heightens data-analytics fidelity, enabling retailers to refine personalization engines that anchor customer-lifetime value in the Middle East and Africa e-commerce market.
By Payment Method for B2C E-Commerce: Wallets Lead, BNPL Accelerates
Digital wallets processed 33.18% of checkouts in 2025, reflecting their ubiquity across ride-hailing, food, and ticketing super-apps. BNPL, however, races ahead at 14.21% CAGR, with UAE penetration at 39% and Saudi Arabia at 42%. Providers align with Sharia-compliant profit-rate structures, widening addressable segments. Card rails persist for high-value electronics, though tokenization and network-token vaults improve authorization rates and fraud detection.
Declining COD usage, down 51% across MENA, frees working capital previously trapped in return logistics, boosting merchant liquidity. Wallet-to-wallet cross-border remittances drop transaction costs, encouraging expatriate shoppers to spend on home-country platforms. Crypto-enabled checkout remains marginal but gains mindshare among early adopters. As real-time payment schemes interoperate, refund times compress, reducing after-sales friction and enhancing the shopper journey in the Middle East and Africa e-commerce market.
By Product Category for B2C E-Commerce: Fashion Holds Lead, Food Surges
Fashion and Apparel retained a 25.96% revenue lead in 2025, buoyed by Shein capturing 35% of South African women’s online apparel sales within four years. Flash-sale pricing and influencer-led capsule drops sustain impulse purchasing. Yet Food and Beverages is the fastest riser, compounding at 14.41% CAGR on the back of ultra-fast grocery delivery and meal-kit adoption. Saudi Arabia’s food-delivery GMV hit USD 10 billion in 2023 and is forecast to reach USD 14.9 billion by 2028.
Consumer-electronics demand benefits from cyclical smartphone replacement and smart-home adoption. Beauty and Personal Care gains from social-commerce tutorials and livestreamed product reveals. Furniture demand spikes as hybrid-work norms fuel home-office upgrades. Category diversification limits concentration risk and underpins resilient revenue expansion in the Middle East and Africa e-commerce market.
Geography Analysis
Saudi Arabia’s 34.12% share underscores its role as demand fulcrum for the Middle East and Africa e-commerce market. National spending incentives and the digital-only Nol digital bank pilot pave pathways for deeper basket penetration. Riyadh’s decision to subsidize fiber to secondary cities enlarges the addressable consumer base and accelerates loyalty-program scale. Meanwhile, the UAE’s innovation sandbox attracts cross-border sellers who value Dubai’s free-zone warehousing for instant re-export to GCC neighbors. Expo-driven tourism inflates luxury and souvenirs categories, lifting GMV seasonality peaks that merchants monetize through dynamic inventory allocation.
In Africa, South Africa offers formal addressing, card adoption, and developed courier networks, making it fertile ground for global entrants. Domestic incumbents respond with loyalty assets and courier partnerships that shrink national delivery times to sub-two-day averages. Kenya and Tanzania illustrate mobile-money-led commerce, where P2P wallets simplify micro-seller checkout and curb fraud. Nigeria trails on fulfillment reliability, but fintech-driven escrow models mitigate trust issues and catalyze social-commerce growth. Moroccan customs reforms cut clearance from three days to one, courting European sellers to stage inventory in Tangier Med logistics clusters. Collectively these moves shape a patchwork of growth nodes that aggregate into a cohesive Middle East and Africa e-commerce market trajectory.
Regulatory Landscape
Regulation across the Middle East and Africa e-commerce market is tightening around merchant identification, consumer protection, and digital-transaction transparency, with the GCC setting many operational norms. In Saudi Arabia, the Ministry of Commerce oversees the E-Commerce Law (Royal Decree No. M/126, 2019) and its implementing requirements for e-store disclosures and platform intermediary obligations, supported by ecosystem governance through bodies such as the Saudi E-Commerce Council. In February 2026, UNCTAD and the Saudi E-Commerce Council advanced a methodology to measure e-commerce and digital trade value, indicating more standardized reporting and compliance expectations for platforms and cross-border sellers operating at scale.
In the UAE, Federal Decree-Law No. 14 of 2023 on Trading by Modern Technological Means sets obligations for online trading conduct, while Federal Law No. 15 of 2020 on Consumer Protection applies to registered suppliers selling online. Market entry and ongoing operations also depend on licensing pathways through the Department of Economic Development (DED) for mainland businesses, along with alignment with the Telecommunications and Digital Government Regulatory Authority (TDRA) for relevant digital service approvals. These frameworks reinforce a shift from informal online selling to registered commerce, raising the baseline for KYC, disclosures, and complaint handling in core hubs such as Saudi Arabia and the UAE.
Value Chain Analysis
The Middle East and Africa e-commerce value chain begins with brand owners, importers, and marketplace sellers listing inventory across B2C and fast-growing B2B channels, backed by cross-border sourcing corridors that connect Asia to GCC demand centers and intra-Africa trade routes. Demand capture and conversion are driven by marketplace platforms and direct-to-consumer storefronts, while payment orchestration is increasingly anchored by digital wallets and BNPL at checkout. Fraud screening, KYC/AML processes, and customer support operations sit alongside the front end and influence trust and repeat purchase behavior.
Fulfillment and delivery are the cost and service differentiation core, covering inbound port and airport gateways, bonded and free-zone warehousing, automated sortation, and last-mile delivery networks that must handle informal addressing and variable rural connectivity. Recent capacity additions point to upgrading at key nodes, including Bosta launching an automated sorting hub in Cairo in February 2026 (11,000 parcels per hour) and DP World opening an integrated Logistics Distribution Centre at Sokhna Logistics Park in July 2026 to support regional and global distribution flows. Upstream trade enablement and infrastructure expansion, including Gulftainer progressing expansion at Sharjahs Khor Fakkan Port and plans to link the Port of Dar es Salaam with Ain Sokhna Port via a cargo hub concept, highlight how port-to-warehouse-to-last-mile integration is being built to reduce cycle times and landed costs for cross-border e-commerce.
Competitive Landscape
Competitive intensity is escalating as global titans collide with well-capitalized regional champions. Amazon leverages Prime logistics to push same-day delivery in select GCC metros, while Noon capitalizes on deep local merchandising ties and Arabic UX familiarity. Jumia doubles down on African last-mile partnerships, co-opting postal agencies to improve rural reach. Talabat’s USD 32 million InstaShop acquisition broadens grocery assortment and lifts pro-forma GMV above USD 2.5 billion. Shein and Temu deploy price-discovery algorithms and social-viral marketing to rapidly accumulate cohorts, forcing incumbents to revisit supplier-cost structures.
Technology differentiation centers on AI-driven Arabic-dialect search, hyper-personalized recommendation engines, and predictive inventory placement. Payment incumbents embed wallet credit lines to sustain purchase frequency, while logistics players race to install smart lockers and drone-delivery trials. Regulatory compliance, PCI DSS certification, data-residency adherence, becomes a threshold capability that filters out lightly capitalized entrants. As a result, the Middle East and Africa e-commerce market gravitates toward an oligopoly of scale-advantaged platforms, balanced by a tail of niche vertical specialists.
Middle East And Africa E-commerce Industry Leaders
Amazon.com Inc.
Alibaba Group Holding Limited
Shopify Inc.
Costco Wholesale Corporation
Best Buy Co. Inc.
- *Disclaimer: Major Players sorted in no particular order

Market Opportunities and Future Outlook
A primary opportunity area is compliance-ready cross-border commerce routed through major logistics gateways, where platforms and enablers package licensing, tax documentation, and returns handling into a single merchant offering. This is supported by concrete policy and infrastructure actions in 2026, including Kuwait issuing Decree-Law No. 26 of 2026 regulating digital commerce with consumer protection requirements (including a 14-day return right) and Qatar introducing a licensing framework for e-commerce platforms without physical premises under Ministerial Decision No. 25 of 2026 (effective March 16, 2026). At the same time, the UAE Ministry of Finance began the national Electronic Invoicing System pilot on July 1, 2026, tightening invoice standardization and opening room for software, ERP connectors, and marketplace tools that help SMEs comply while selling across borders.
Express commerce and automated fulfillment are also visible opportunities, backed by investment moves such as Talabat Egypt inaugurating a large express distribution center in April 2026 with AI-enabled logistics systems, and Pattern opening a new Dubai Investment Park warehouse and office facility in June 2026 to scale MENA operations with automated and temperature-controlled fulfillment. On the regional distribution spine, DP World Sokhna Logistics Park LDC launch in July 2026 strengthens Egypt as a staging point for orders moving across Africa, the Middle East, and into Europe, supporting multi-country inventory placement and faster delivery promises. Together, these actions support opportunities for inventory positioning, cross-border returns, cold-chain capable grocery fulfillment, and B2B procurement platforms that deliver compliant invoicing and financing workflows alongside logistics execution.
Recent Industry Developments
- July 2026: Amazon launched Amazon Now in Egypt, introducing 20-minute delivery across select areas of Cairo, Giza, Alexandria, and the North Coast. The service sets a higher benchmark for quick commerce and pressures competing marketplaces and grocers to invest in micro-fulfillment and high-frequency last-mile capacity.
- February 2026: Bosta launched an automated sorting hub in Cairo (11,000 parcels per hour), signaling a step-change in last-mile capacity. The addition supports higher throughput for e-commerce fulfillment across North Africa.
- October 2025: Alibaba Cloud launched its second data center in Dubai to expand cloud capacity for enterprise customers in the Middle East. The extra in-region compute and storage strengthens the infrastructure base used by e-commerce platforms for latency-sensitive shopping experiences, analytics, and data residency compliance.


Research Methodology Framework and Report Scope
Market Definition and Coverage
For this study, the Middle East and Africa e-commerce market is the value of goods and services purchased through online channels across the region, covering both B2C and B2B transactions completed on websites and apps.
Scope exclusions: We exclude offline retail sales that are only influenced by digital marketing and do not include orders placed by phone or in-store kiosks.
Segmentation Overview
- By Business Model
- B2B
- B2C
- By Device Type for B2C E-commerce
- Smartphone / Mobile
- Desktop and Laptop
- Other Device Types
- By Payment Method for B2C E-commerce
- Credit / Debit Cards
- Digital Wallets
- BNPL
- Other Payment Method
- By Product Category for B2C E-commerce
- Beauty and Personal Care
- Hair Care
- Skin Care
- Cosmetics and Beauty
- Other Types
- Consumer Electronics
- Mobile
- PC and Laptops
- Audio Devices
- Gaming Devices
- Other Types
- Fashion and Apparel
- Clothing
- Footwear
- Fashion Accessories
- Other Types
- Food and Beverages
- Packaged Food
- Bakery and Confectionery
- Meat, Poultry, and Seafood
- Other Types
- Furniture and Home
- Home Furniture
- Office Furniture
- Outdoor Furniture
- Other Types
- Other Product Categories
- Beauty and Personal Care
- Geography
- United Arab Emirates
- Saudi Arabia
- South Africa
- Rest of Middle East and Africa
Data Sources, Market Sizing, and Validation
Desk Research
Desk research helped anchor the model on measurable demand and payment behavior across Middle East and Africa. We used public datasets and updates from sources such as the International Telecommunication Union for connectivity trends, the World Bank for income and digital access indicators, UN Comtrade for cross-border trade signals tied to online retail, and national statistics offices where retail and ICT releases are published.
On the commercial activity side, we reviewed central bank and regulator publications on card usage, instant payments, and wallet adoption. We then cross-checked those inputs with customs and logistics authority releases that indicate delivery volumes and cross-border flows. Company annual reports, investor presentations, and reputable press were used to sanity check expansion plans, category focus, and the reported online revenue mix. In a few cases, paid subscriptions for company financials and news intelligence, shipment-level import-export records, and patent databases were referenced where public reporting was not consistent. These desk sources are illustrative, and many other public documents were reviewed to support validation and clarification.
Primary Interviews and Surveys
Primary work was used to confirm what gets counted as e-commerce revenue in practice and how quickly the channel mix is shifting by country and category. We spoke with marketplace operators, brand-led online sellers, payment stakeholders, and logistics and fulfillment participants, then validated assumptions with buyers and category managers across the region so weak data points could be corrected.
We also used these conversations to pressure-test key inputs such as average order values, take-rate and commission logic, cross-border share, and the split between B2C and B2B transactions. This improved the final sizing and the forecast path.
Distribution of primary research fieldwork respondents
| Company type | Respondent position | Region |
|---|---|---|
| Top tier: 39% | CXOs: 16% | |
| Mid tier: 45% | Functional/Unit leaders: 32% | |
| Smaller Players: 16% | Managers: 52% |
Market-Sizing & Forecasting
Sizing started with a top-down build where online retail and service demand was reconstructed from connected-population trends, digital payment usage, and category spend patterns. We then allocated the totals across key MEA countries based on adoption differences and purchasing power.
To corroborate the overall numbers, we used selective bottom-up approximations, including sampled GMV and revenue disclosures, channel checks on commissions and seller fees, and simple ASP times volume logic for high-frequency categories.
To keep the model grounded, we relied on inputs that can be tracked year to year. Illustrative variables include internet and smartphone penetration, share of shoppers using cards and wallets, cash-on-delivery decline patterns, cross-border parcel intensity, category mix shifts (for example, electronics versus fashion), and B2B online procurement adoption. Where a bottom-up signal was missing for smaller markets, we used proxy ratios from similar markets and adjusted them after expert feedback so the model did not over-extend sparse data.
Forecasting used scenario analysis tied to payment penetration, logistics capacity expansion, and expected improvements in delivery reliability and returns handling. Assumptions were tightened after primary feedback so growth is not driven by a single factor, and the output remains traceable to observable adoption and spend drivers.
Data Validation & Update Cycle
Model outputs were triangulated against independent signals such as payments growth, parcel and cross-border activity, and reported online channel contribution in public filings. Outliers were flagged, investigated, and either corrected through assumption changes or marked for re-check. A second analyst review was completed before sign-off.
Reports are refreshed annually, with interim updates when material events change payment rules, consumer protection requirements, taxation, or cross-border fulfillment conditions. Before delivery, we do a final pass to ensure recent releases and major announcements are reflected in the numbers and the commentary.
Mordor Intelligence's Middle East and Africa Ecommerce Market Size Compared Against Other Published Estimates
Published estimates for MEA e-commerce often differ because the market boundary is not consistent, and even the same label can mix GMV, platform revenue, and retail sales value. Timing also matters since currency conversion points, inflation, and fast-moving adoption curves can shift a single-year number quickly.
By tracking payment-method mix, cross-border share, and B2B inclusion rules, Mordor Intelligence keeps the estimate aligned to transaction value counted only when an online order is placed and paid for within the Middle East and Africa scope. The biggest gaps usually come from whether a source limits the market to MENA only, counts platform commission instead of the full basket value, or applies aggressive take-rate and ASP increases without checking them against category-level order behavior.
Benchmark comparison
| Source | Market Size | Gaps in Research Methodology |
|---|---|---|
| Mordor Intelligence | USD 155.16 B (2025) | |
| Trade Journal A | USD 34.50 B (2024) | Uses a narrower geography focus (MENA) and is typically closer to recorded retail e-commerce sales in select countries, which can undercount broader MEA coverage and B2B online transactions. |
| Industry Publisher B | USD 146.90 B (2025) | Often presents a B2C-only view and may blend GMV and revenue concepts across platforms, which changes the measured base when commission-led models dominate. |
The spread is mainly explained by geography choices, whether B2B is included, and whether the measure is full basket value or platform revenue. Our approach stays transparent by linking the final total back to trackable adoption, payment, and category spend inputs that can be rechecked each year.


Key Questions Answered in the Report
What is the current value of the Middle East and Africa e-commerce market?
The market stood at USD 176.68 billion in 2026 and is on track to reach USD 338.08 billion by 2031.
Which country contributes the most GMV in the region?
Saudi Arabia leads with 34.12% share, supported by high consumer spending and Vision 2030 digital targets.
How quickly is B2B online trade expanding?
B2B channels are growing at a 15.97% CAGR, outpacing consumer segments as SMEs digitize procurement.
Which payment method is gaining momentum fastest?
Buy Now Pay Later is the fastest-growing, advancing at 14.21% CAGR amid strong uptake in GCC markets.
What role do smartphones play in regional online shopping?
Smartphones account for 71.78% of B2C transactions and will keep dominating as 5G and super-apps spread.
Page last updated on:






