
Market Overview
| Study Period | 2020 - 2031 |
|---|---|
| Forecast Data Period | 2026 - 2031 |
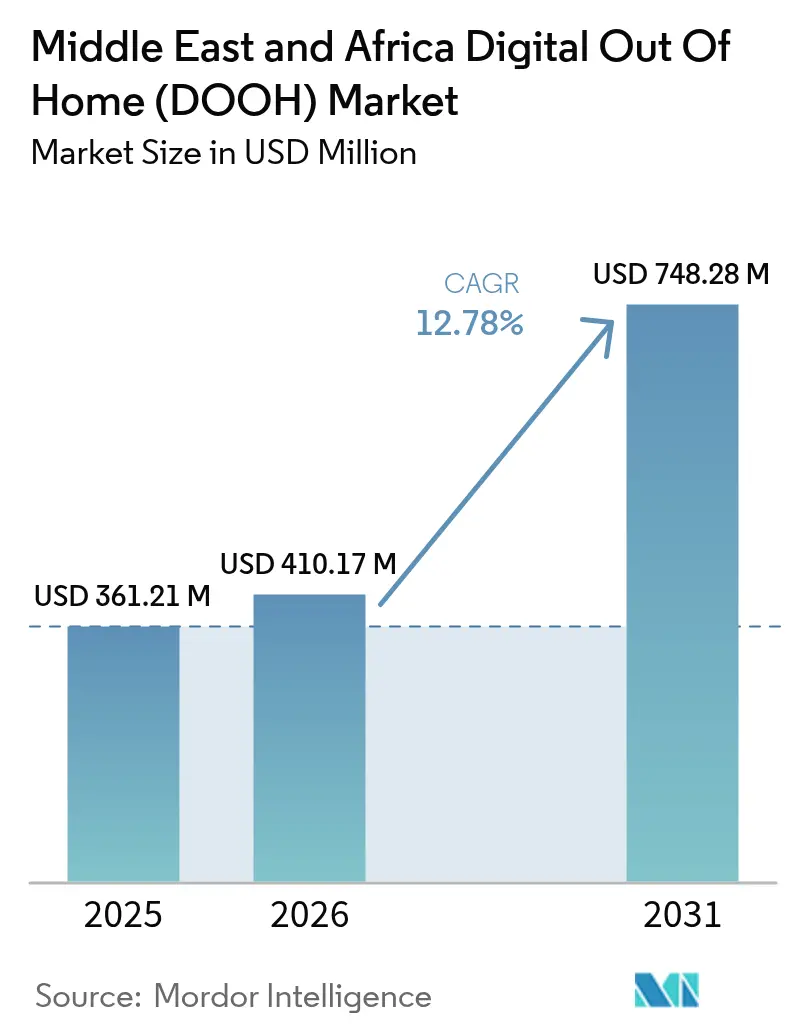
| Base Year Market Size (2025) | USD 361.21 Million |
| Market Size (2026) | USD 410.17 Million |
| Market Size (2031) | USD 748.28 Million |
| Growth Rate (2026 - 2031) | 12.78 % |
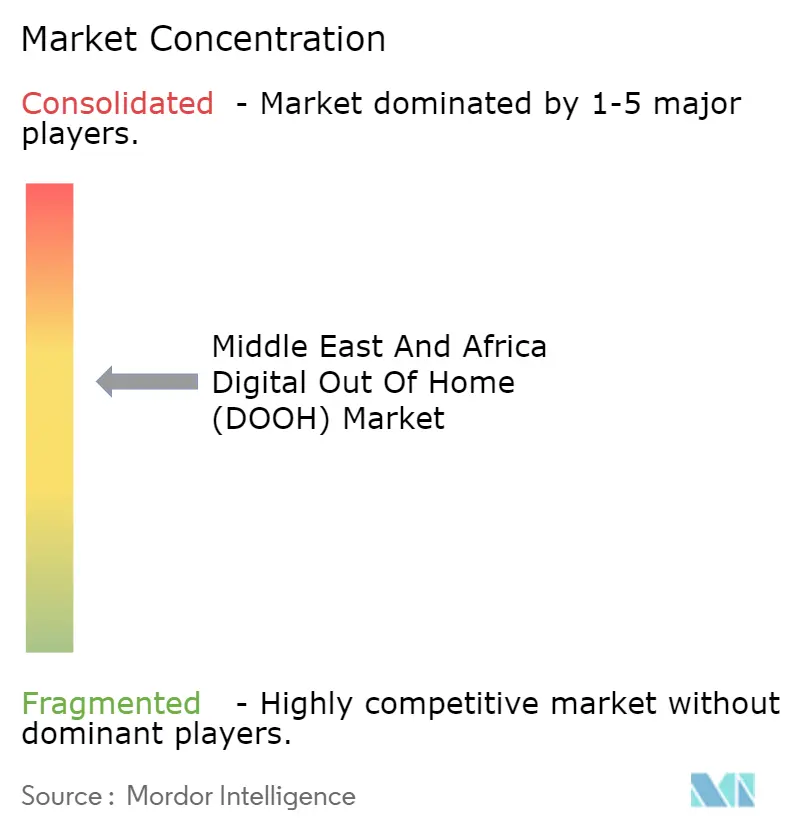
| Market Concentration | Medium |
Major Players *Disclaimer: Major Players sorted in no particular order Image © Mordor Intelligence. Reuse requires attribution under CC BY 4.0. | |
Middle East And Africa Digital Out Of Home (DOOH) Market Analysis by Mordor Intelligence
The Middle East and Africa DOOH market size size is projected to expand from USD 361.21 million in 2025 and USD 410.17 million in 2026 to USD 748.28 million by 2031, registering a CAGR of 12.78% between 2026 to 2031. The region’s quick pivot to data-driven inventory is being underpinned by giga-projects in Saudi Arabia, airport and metro upgrades in the United Arab Emirates, and regulatory timetables that push operators to replace static faces with networked LED panels. Advertisers are steadily shifting spend toward screens that support closed-loop attribution, while demand-side platforms make the format accessible inside omnichannel buying consoles. Programmatic penetration is rising fastest in premium transit locations, where long dwell times, 5G connectivity, and audience-classification sensors enable real-time creative decisions. Consolidation among media owners, coupled with exclusive long-term concessions for metro and airport estates, is creating scale advantages for operators that can fund the high capital outlays of digital conversion.
Key Report Takeaways
- By geography, Saudi Arabia led with 33.17% of Middle East and Africa DOOH market share in 2025, while the United Arab Emirates is forecast to record the fastest 13.09% CAGR to 2031.
- By service type, non-programmatic DOOH held 70.88% revenue share in 2025, and programmatic DOOH is set to expand at a 13.29% CAGR through 2031.
- By application, billboards commanded 45.79% of the Middle East and Africa DOOH market size in 2025, whereas street furniture and transit screens are advancing at a 14.17% CAGR to 2031.
- By location environment, roadside formats captured 56.84% share in 2025, yet malls and transit hubs are accelerating at a 13.41% CAGR over the forecast window.
- By end-user industry, retail contributed 28.76% revenue share in 2025 and healthcare is projected to widen fastest at a 15.23% CAGR up to 2031.
Note: Market size and forecast figures in this report are generated using Mordor Intelligence’s proprietary estimation framework, updated with the latest available data and insights as of 2026.
Market Trends and Insights
Drivers Impact Analysis of Middle East And Africa Digital Out Of Home (DOOH) Market*
| Driver | (~) % Impact on CAGR Forecast | Geographic Relevance | Impact Timeline |
|---|---|---|---|
| Ongoing Shift Toward Digital Advertising | +2.8% | Saudi Arabia, UAE, Qatar, Egypt | Short term (≤ 2 years) |
| Expansion of Public-Transit Infrastructure | +2.5% | Saudi Arabia, UAE, Egypt | Medium term (2-4 years) |
| Accelerating Adoption of Programmatic DOOH | +2.3% | UAE, Saudi Arabia, Qatar, Bahrain | Short term (≤ 2 years) |
| Saudi Giga-Projects Boosting Smart-City Media | +2.1% | Saudi Arabia | Long term (≥ 4 years) |
| 5G-Enabled Real-Time Dynamic Creative Triggers | +1.8% | UAE, Saudi Arabia, Qatar, Kuwait | Medium term (2-4 years) |
| ESG Push for Renewable-Powered LED Displays | +1.2% | UAE, Saudi Arabia, Qatar | Medium term (2-4 years) |
| Source: Mordor Intelligence | |||
Ongoing Shift Toward Digital Advertising
Ad budgets are moving from vinyl billboards to networked screens that deliver measurable impressions and quick creative swaps. Egypt’s DOOH inventory doubled between 2023 and 2024 and digital occupancy hit 90.1% in November 2025, underscoring format substitution momentum. The UAE confirmed that more than 70% of its outdoor faces were digital by end-2025 after regulators set firm retirement dates for static units.[1] Operators that connected inventory to supply-side platforms, such as ELAN Media, saw digital contributions pass 50% of revenue in 2025, a dramatic swing from negligible levels in 2020.[2] The growth is reinforced by mobile-retargeting, where a screen exposure triggers a follow-up ad on social channels, helping brands trace the consumer journey. Together, these factors keep the Middle East and Africa DOOH market on a steep replacement curve.
Expansion of Public-Transit Infrastructure
Billions of U.S. dollars are flowing into metros, airports, and bus shelters that are pre-wired for digital screens. Riyadh Metro integrates 2,688 displays across six lines, offering exclusive media rights to Saudi Signs Media.[3] In Dubai, 595 smart bus shelters were in service by December 2025, each featuring passenger Wi-Fi and panels ready for programmatic triggers. Major Gulf airports have adopted a similar blueprint, with Dubai International alone hosting 378 JCDecaux panels addressable through the Play+ platform. Average dwell times of 100 minutes inside flagship malls such as Place Vendôme in Qatar further tilt spend toward transit-linked environments.[4] These venues offer predictable footfall that justifies premium CPMs and underpins long-run revenue visibility for asset owners.
Accelerating Adoption of Programmatic DOOH
Impression-based trading is moving DOOH away from fixed-term deals. JCDecaux rolled out Play+ in February 2025 across Gulf airports, letting buyers push or pause campaigns in real time. BackLite Media connected more than 300 roadside screens to VIOOH, Place Exchange, and The Trade Desk, projecting that 5-7% of its turnover will be programmatic within 18 months. ELAN Media followed suit, exposing 220 Qatar-based units to global DSPs in September 2025. Supply-side integrations lower transaction friction, expand the buyer base, and introduce automated targeting features such as weather-responsive creatives that lift conversion rates. This dynamic feeds directly into the Middle East and Africa DOOH market trajectory by monetizing each screen more efficiently.
Saudi Giga-Projects Boosting Smart-City Media
Vision 2030 mega-developments are embedding advertising networks at the planning table. NEOM’s blueprint pairs 5G backbones with IoT nodes so that screens can adjust messages to footfall density, temperature, or event schedules. Alongside The Line and Oxagon, these districts ensure thousands of premium ad faces will come online through the late 2020s, keeping Saudi Arabia in the lead on inventory scale. Al Arabia Outdoor has already secured metro, roadside, and pilgrimage-route concessions that total more than 49,000 ad faces, 90% digital. The structural linkage between urban development and advertising infrastructure cements long-term demand for high-spec LED units and gives operators confidence to commit fresh capex.
Restraints Impact Analysis of Middle East And Africa Digital Out Of Home (DOOH) Market*
| Restraint | (~) % Impact on CAGR Forecast | Geographic Relevance | Impact Timeline |
|---|---|---|---|
| Stringent Advertising Regulations in GCC | -1.5% | UAE, Saudi Arabia, Qatar, Kuwait, Bahrain | Short term (≤ 2 years) |
| Persistence of Traditional OOH in Rural Areas | -1.2% | Egypt, Morocco, rest of region | Medium term (2-4 years) |
| Fragmented Audience-Measurement Standards | -0.9% | Regional | Medium term (2-4 years) |
| High Ambient-Temperature Maintenance Costs | -0.8% | Desert climates | Long term (≥ 4 years) |
| Source: Mordor Intelligence | |||
Stringent Advertising Regulations in GCC
Dubai’s Decree 6-2020 requires every creative to clear multiple agencies, stretching lead times and adding compliance expenses. The RTA manual further caps brightness, animation length, and proximity to sensitive sites. In Saudi Arabia, cybersecurity laws classify certain DOOH networks as critical infrastructure, obliging operators to file security audits and incident reports. Manual content reviews clash with real-time bidding logic, muting some of the flexibility that makes programmatic attractive. Smaller advertisers lacking legal resources may therefore stick to static buys or avoid the medium altogether, tempering the pace at which the Middle East and Africa DOOH market migrates to 100% digital.
Persistence of Traditional OOH in Rural Areas
Outside core metros, static boards remain economical because traffic volumes and advertiser budgets are lower. Egypt still derived 25-30% of its outdoor impressions from vinyl faces in 2024, with roughly 40,000 boards blanketing secondary corridors. Morocco shows a similar pattern beyond Casablanca and Rabat, and even the UAE expects two-thirds of spend to stay with conventional faces through 2027. Sparse mobile-location data in rural zones also undermines impression verification, making buyers cautious about premium CPMs. Until screen prices fall further or government programs subsidize upgrades, static formats will coexist with their digital successors, keeping the Middle East and Africa DOOH market from capturing its full theoretical ceiling.
*Our forecasts treat driver/restraint impacts as directional, not additive. The impact forecasts reflect baseline growth, mix effects, and variable interactions.
Middle East And Africa Digital Out Of Home (DOOH) Market Segment Analysis
By Service Type:
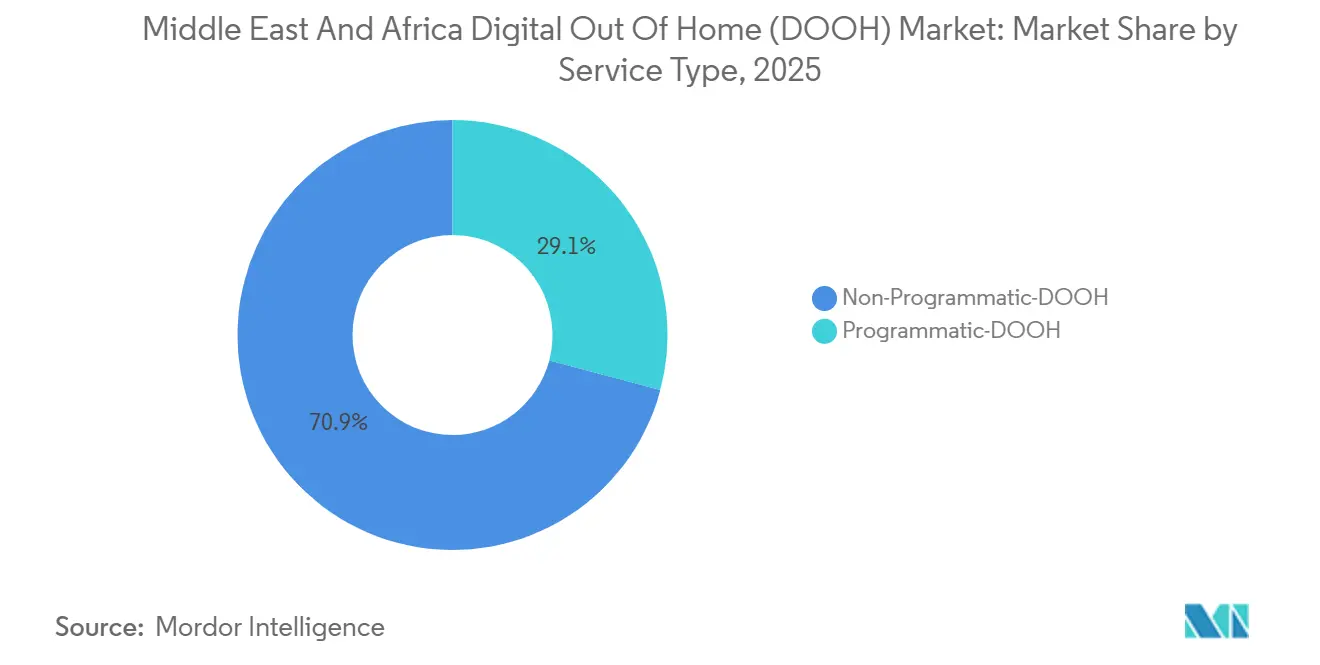
Programmatic Growth Widens but Direct Deals PrevailProgrammatic still represents a minority of sales, yet its CAGR outpaces that of traditional contracts. Non-programmatic inventory accounted for 70.88% of Middle East and Africa DOOH market share in 2025, reflecting entrenched direct media-owner relationships with large advertisers. Exclusive concessions, such as Saudi Signs Media’s Riyadh Metro deal, lock in revenue streams through multi-year guarantees, explaining why the model endures. Nevertheless, platforms like Play+ let buyers pulse budgets by hour or day, which is proving persuasive for performance-led brands.
In the next five years, sustained 13.29% growth for automated buying will compress that gap. Integration friction is falling as operators connect to global SSPs, giving omnichannel traders one-click access to Sheikh Zayed Road, Bahrain International Airport, or Doha’s luxury malls. With telecom operators rolling out 5G that covers more than 90% of GCC urban centers, latency constraints no longer block real-time optimisation. As a result, the Middle East and Africa DOOH market size attributable to programmatic lines is forecast to multiply while still leaving room for long-duration sponsorships in flagship transit estates.
By Application:
Street Furniture and Transit Screens Gain MomentumBillboards retained 45.79% of 2025 revenue thanks to high-impact roadside canvases, yet street furniture and in-station displays are scaling faster at a 14.17% CAGR. Bus shelters fitted with Wi-Fi, QR codes, and passenger information screens convert fleeting passerby attention into measurable engagements. Metro platforms add further value, as commuters spend up to eight minutes awaiting trains, creating multiple impression windows per passenger.
Over time, digital enablement of public furniture will redirect budgets once locked into static roadside walls. Municipalities prefer the low visual clutter of slim LED to fabric vinyl, and advertisers appreciate creative rotation by daypart without re-printing costs. This twin preference supports a proportional rise in the Middle East and Africa DOOH market size generated by “other applications” relative to legacy billboard strongholds.
By Location Environment:
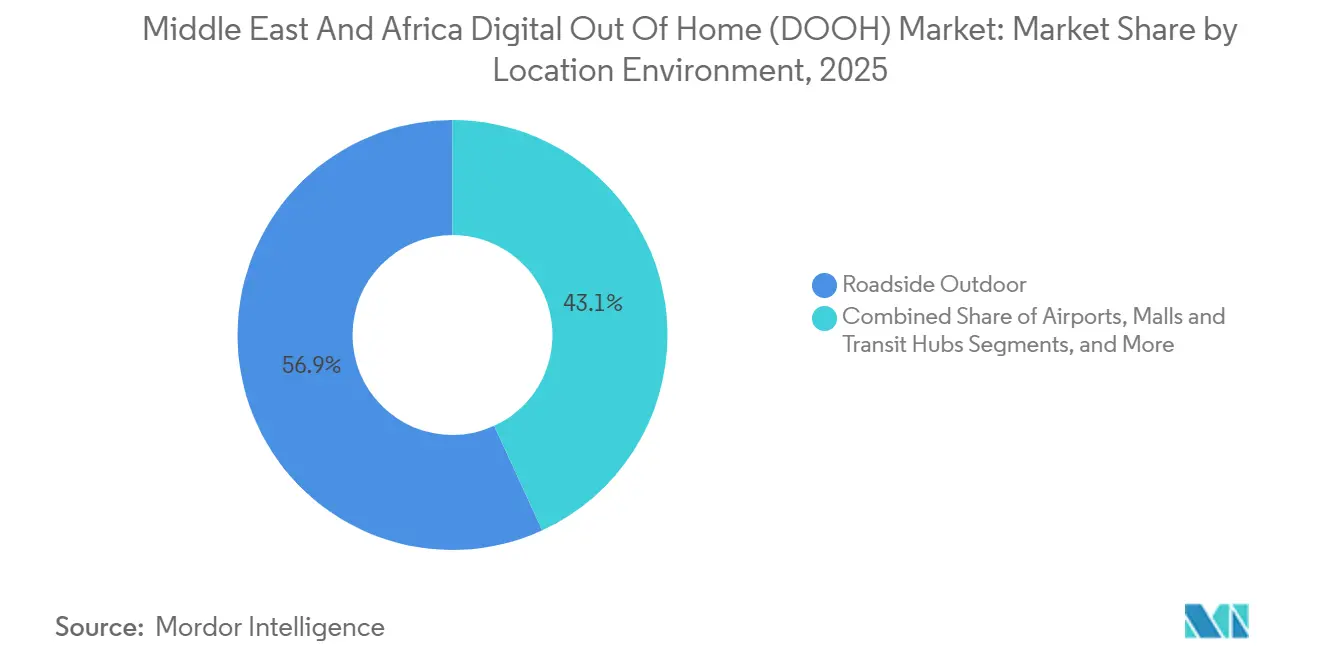
Indoor Venues Outpace RoadsidesRoadside formats amassed 56.84% of spend in 2025 because they blanket every major corridor from King Fahd Road to the Cairo Ring. Yet malls, airports, and metro stations are on a steeper 13.41% CAGR arc. ELAN Media screens in Place Vendôme record dwell times above 100 minutes, allowing campaigns to deliver meaningful frequency. In grocery aisles, Majid Al Futtaim ties screen exposures to point-of-sale data, proving double-digit sales lifts and justifying higher CPMs.
As more retailers, pharmacies, and gyms monetise walls and kiosks, indoor environments will absorb incremental budgets that historically defaulted to highways. Operators that own both roadside and mall stock can cross-sell packages, ensuring balanced revenue even as share migrates. In coming years, the Middle East and Africa DOOH market share attributable to captive indoor audiences is expected to continue rising, shrinking the historical dominance of roadside impressions.

By End-User Industry:
Healthcare Rockets While Retail Stays on TopRetail provided the single largest slice at 28.76% in 2025, buoyed by mall traffic and supermarket networks that target shoppers close to point-of-purchase. Campaign proof-points, such as Panadol’s 17% lift from a Carrefour-based AI screen roll-out, keep FMCG and electronics marketers loyal to the medium. Banking, automotive, and luxury fashion also fill premium rotations in airports and downtown arterials.
Healthcare, however, is the breakout star, advancing at 15.23% CAGR through 2031. Pharmaceutical brands lean on closed-loop attribution to justify higher investment, especially during flu seasons. Sensor technology can now parse shopper demographics, letting creative swap between family health remedies and sports injury solutions within the same aisle. The upgrade positions pharmacies and hypermarkets as high-value micro-networks, expanding the Middle East and Africa DOOH market share captured by healthcare relative to slower-growing verticals.
Geography Analysis
Saudi Arabia Digital Out of Home (DOOH) Market
Saudi Arabia anchors regional revenue with 33.17% share, driven by Vision 2030 schemes that weave LED surfaces into every metro car, airport lounge, and pilgrimage route. The Riyadh Metro alone places 2,688 screens inside 85 stations, instantly creating one of the world’s densest transit media estates. Parallel expansion across NEOM districts adds new-build environments purpose-designed for plug-and-play DOOH assets, locking in long-term capacity growth.
United Arab Emirates Digital Out of Home (DOOH) Market
The United Arab Emirates is moving faster in relative terms, tracking a 13.09% CAGR thanks to mandatory digital conversion rules and early programmatic uptake. JCDecaux’s Play+ launch at Dubai International Airport, covering 378 addressable faces, illustrates how the emirates use aviation hubs as technology test beds. BackLite Media’s AED 1 billion (USD 0.27 billion), 12-year RTA contract further consolidates roadside digitisation, ensuring broad screen density along Sheikh Zayed Road.
MEA Digital Out of Home (DOOH) Market
Qatar, Kuwait, and Bahrain trail in absolute dollars yet punch above weight on innovation. VIOOH’s tie-up with ELAN Media unlocked 220 Qatar screens for global DSPs, while Bahrain International Airport joined the Play+ network in 2025. Morocco and Egypt present contrasting pictures: Morocco enforces strict data-protection rules that slow programmatic adoption, whereas Egypt adds inventory quickly but keeps a sizable static footprint in provincial corridors. The rest of Middle East and Africa offers green-field upside once telecom coverage, measurement standards, and capital formation improve.
Regulatory Landscape
Regulation for DOOH in the Middle East and Africa is tightening around safety, content, and technical performance, particularly across the GCC. In the UAE, Federal Decree-Law No. (55) of 2023 and Cabinet Resolution No. (68) of 2024 updated national media content standards, age ratings, and licensing rules that also apply to digital advertising placements, increasing scrutiny over creative approvals and operator licensing.
At the emirate level, Dubai has formalized detailed siting and technical requirements through advertising manuals and public-safety rules. This includes Administrative Resolution No. (180) of 2025 approving the Out-of-Home Advertising Manual, alongside Dubai Development Authority Circular 603 (August 2024) and subsequent rule updates that specify lighting and placement constraints to reduce road-safety risks. In Saudi Arabia, the General Authority for Media Regulation (GAMR) enforces licensing for advertising and marketing offices via the national Media Platform, while hardware compliance has gained emphasis after SASO updated the SABER platform (July 13, 2026) to mandate energy labeling and dual certification for interactive digital signage, covering photobiological safety and energy-efficiency requirements under SASO IEC 62471:2026 Class A. For networks treated as critical infrastructure, cybersecurity obligations aligned to National Cybersecurity Authority controls also shape architecture and data handling.
Competitive Landscape
Regional concentration is moderate, with a core cluster of multinationals and well-capitalised locals vying for metro, airport, and roadside franchises. JCDecaux leverages international experience, launching Play+ to fold its Gulf stock into the same buying pipes used in Europe and Asia. BackLite Media defends its dominance on Sheikh Zayed Road and extends reach through a 12-year smart-street furniture deal with Dubai’s RTA, while integrating with four leading SSPs for flexible trading.
Al Arabia Outdoor operates the broadest asset base at more than 49,000 faces, giving it pricing power across Saudi transit and Makkah pilgrimage corridors. In June 2025, BackLite, Viola, and Media 247 merged as Multiply Media Group, illustrating how consolidation accelerates scale economics critical to funding high-brightness LED upgrades. Niche players such as Pikasso focus on often-overlooked North African and Levant markets, positioning themselves as first movers in locations where global majors have limited presence. Across all operators, competitive edge is increasingly tied to AI audience measurement, 5G-enabled dynamic creatives, and energy-efficient hardware that meets emerging ESG mandates.
Middle East And Africa Digital Out Of Home (DOOH) Industry Leaders
-
JCDecaux SE
-
ELAN Media W.L.L.
-
BackLite Media LLC
-
Hypermedia FZ LLC
-
Abu Dhabi Media Company PJSC
- *Disclaimer: Major Players sorted in no particular order
Middle East And Africa Digital Out Of Home (DOOH) Market Companies Covered in this Report
- JCDecaux SE
- ELAN Media W.L.L.
- BackLite Media LLC
- Hypermedia FZ LLC
- Abu Dhabi Media Company PJSC
- Dooha Media W.L.L.
- EyeMedia Advertising W.L.L.
- Pikasso SARL
- Elevision Media FZ LLC
- Al Arabia Outdoor Advertising CJSC
- Faden Media Company Ltd.
- Hills Advertising LLC
- Arabian Outdoor Advertising LLC
- MBC Media Solutions FZ LLC
- Al Barq Digital Media LLC
- Publicity Qatar W.L.L.
- Sahara Media Advertising Co. LLC
- Ethraa Advertising Company LLC
- Wow Media LLC
- Al Fahad Advertising LLC
- Blue Rhine Media LLC
- Pixcom Technologies LLC
Market Opportunities and Future Outlook
Programmatic access and connected screen corridors are creating incremental demand from performance-led buyers seeking DOOH inside standard omnichannel workflows. In February 2026, The Trade Desk partnered with AiOO to provide media buyers access to DOOH and retail media inventory in the Middle East through its platform, extending reach beyond direct-sales relationships. On the supply side, BackLite Media introduced The Helix in February 2026 as a connected DOOH network along Sheikh Zayed Road, reinforcing the push toward unified, measurable premium roadside inventory that can be packaged and traded more dynamically.
Retail and place-based networks also stand out as a practical whitespace for scaling premium inventory in Saudi Arabia and the UAE, supported by recent operator moves and venue partnerships. In July 2026, Multiply Media Group announced expansion into Saudi Arabia through a strategic partnership with Cenomi Centers, launching BackLite KSA to manage more than 80 digital screens across Riyadh and Jeddah, which increases commercial screen density in high-footfall retail destinations and strengthens cross-market buying propositions. New operator entry and specialized platforms add further depth to the regional stack, including Moving Walls launching Middle East operations in January 2026 and Africa-focused infrastructure and planning layers such as Candle (Alpha & Jam Africa) reporting over USD 10 million raised and more than USD 102 million in advertising spend routed through its DOOH-focused platform as of March 2026.
Recent Industry Developments in Middle East And Africa Digital Out Of Home (DOOH) Market
- July 2026: Multiply Media Group announced expansion into Saudi Arabia through a strategic partnership with Cenomi Centers, launching BackLite KSA to manage more than 80 digital screens across Riyadh and Jeddah. The move extends a major UAE-linked DOOH operator footprint into Saudi retail destinations and adds new premium inventory that can be packaged for regional advertisers.
- February 2026: BackLite Media introduced The Helix, a connected DOOH network of seven digital screens along a 12-kilometer stretch of Sheikh Zayed Road in Dubai, positioned to deliver about 60 million monthly impressions. The launch supports higher-value corridor selling and strengthens the infrastructure needed for more automated and data-driven trading of premium roadside inventory.
- February 2024: Multiply Group PJSC completed the acquisition of 100% of BackLite Media, bringing a major UAE DOOH operator into its media and communications portfolio. This consolidation increased access to capital and scale for digitization and network upgrades across core UAE assets.
Middle East And Africa Digital Out Of Home (DOOH) Market Report Scope and Research Methodology
Market Definition and Coverage
For this methodology, the market is defined as revenue earned from digital out-of-home advertising inventory sold and delivered across public and commercial venues in the Middle East and Africa, including programmatic and non-programmatic buying.
Scope exclusions: It excludes non-digital out-of-home formats, creative production services, and pure hardware sales when they are not bundled with ad inventory delivery.
Segments Covered in This Report
- By Service Type
- Programmatic-DOOH
- Non-Programmatic-DOOH
- By Application
- Billboard
- Transit
- Street Furniture
- Other Applications
- By Location Environment
- Roadside Outdoor
- Airports
- Malls and Transit Hubs
- In-Store and Indoor Venues
- Other Location Environments
- By End-User Industry
- Automotive
- Retail
- Healthcare
- Banking and Financial Services (BFSI)
- Media and Entertainment
- Other End-User Industries
- By Geography
- Saudi Arabia
- United Arab Emirates
- Kuwait
- Qatar
- Morocco
- Egypt
- Rest of Middle East and Africa
Data Sources, Market Sizing, and Validation
Desk Research
Desk work starts with defining what counts as DOOH ad revenue in the region and then mapping how inventory is commonly sold across roadside, airports, malls, transit hubs, and indoor venues. We used public references to frame ad spend and digital readiness, including ITU indicators, World Bank macro series, national telecom regulator releases, and airport authority statistics on passenger volumes.
To keep assumptions grounded, additional checks were taken from sources such as press releases on network expansions, investor presentations and annual reports, and association websites that explain OOH concession models and venue partnerships. In a few cases, paid subscriptions for company financials and news were used to cross-check the direction of reported revenue and major contract wins, without forcing the model to match one publication. The sources listed here are illustrative only, and many other public documents were also reviewed for validation and clarification.
Primary Interviews and Surveys
Primary work focused on confirming how DOOH inventory is priced and sold in the Middle East and Africa, and on understanding what share is traded programmatically versus through direct deals. We spoke with media owners, agencies, ad tech participants, venue operators, and large buyers across key markets, and then used these inputs to close gaps from desk findings and sanity-check the final totals.
Distribution of primary research fieldwork respondents
| Company type | Respondent position |
|---|---|
| Top tier: 27% | CXOs: 12% |
| Mid tier: 51% | Functional/Unit leaders: 40% |
| Smaller Players: 22% | Managers: 48% |
Market-Sizing & Forecasting
Market sizing was built using a top-down and bottom-up approach, where regional ad demand is reconstructed through venue activity and monetization patterns, and then corroborated using selective roll-ups from typical operator economics. In practice, we start from the addressable DOOH opportunity by location environment (such as airports, roadside outdoor, malls and transit hubs, and indoor venues) and then apply adoption and utilization factors to reach revenue.
Key inputs used in the model include the count of active digital screens by venue type, expected sell-through of available slots, typical CPM and package pricing ranges by premium versus standard locations, mix of programmatic versus direct sold inventory, and the share of spend coming from large advertiser verticals active in the region. When gaps appear, the model is adjusted using practical proxies, such as using comparable city traffic intensity or airport passenger throughput to estimate demand density. Forecasts were produced using scenario analysis supported by expert consensus on drivers like digital screen rollout pace, programmatic penetration, and pricing movement in high-footfall locations.
Data Validation & Update Cycle
Validation is done through a set of checks that compare the model outputs with independent signals, and then outliers are reviewed before sign-off. We test for unusual jumps in revenue that do not align with screen additions, venue footfall direction, or known contract cycles, and we re-check assumptions when the variance is large versus interview feedback.
Reviews are completed in multiple steps so that inputs, calculations, and final outputs are consistent across countries and venue types. Reports are refreshed annually, and interim updates are made when there are material events such as major concession awards, sharp currency movement, or sudden pricing changes in premium venues. Before delivery, an analyst performs a fresh pass so clients receive the latest updated view.
Mordor Intelligence's Middle East and Africa Digital Out of Home Dooh Market Size Versus Other Published Estimates
Published market numbers can differ even when the topic looks similar, because the counted revenue pool is not always the same and the pricing logic can be handled differently. We also see differences coming from how fast programmatic share is assumed to grow and how quickly new screens are assumed to monetize.
Some published figures fold in the wider out-of-home ad market, or they count screen hardware and installation revenue along with media sales. In Mordor Intelligence, the total is restricted to DOOH advertising revenue delivered through programmatic and non-programmatic buying across defined venue environments in the Middle East and Africa, which keeps the estimate tied to media inventory and sell-through.
Benchmark comparison
| Source | Market Size | Gaps in Research Methodology |
|---|---|---|
| Mordor Intelligence | USD 361.21 M (2025) | |
| Industry Association A | USD 0.49 B (2025) | Often presented as a combined OOH and DOOH pool for major markets, which can lift totals by adding static inventory revenue and broader venue categories that are not consistently digital. |
| Trade Journal B | USD 0.31 B (2025) | Typically built from a smaller tracked screen set and limited country coverage, and pricing is sometimes based on posted rate cards without adjusting enough for discounting and occupancy. |
The spread is mainly explained by what gets counted as revenue and how coverage is handled across countries and venue types. By keeping the inputs anchored to screen availability, sell-through, and price realization by environment, we can deliver a number that is easy to trace, update, and explain in repeatable steps.
Key Questions Answered in the Report
How big will the Middle East and Africa DOOH market be by 2031?
It is forecast to reach USD 0.75 billion, growing at a 12.78% CAGR from 2026.
Which country currently leads spending on digital out-of-home in the region?
Saudi Arabia held 33.17% share in 2025, supported by Vision 2030 transport and smart-city projects.
Where is growth fastest within the region?
The United Arab Emirates is projected to expand at a 13.09% CAGR through 2031 due to rapid programmatic uptake.
What segment is growing quickest by application?
Street furniture and transit screens are expected to rise at a 14.17% CAGR, outpacing billboards.
Why are healthcare advertisers increasing DOOH budgets?
In-store pharmacy screens link exposure to point-of-sale data, proving up to 17% sales uplift and validating higher CPMs.
How does programmatic buying change the medium?
It lets brands purchase impressions in real time, pause or boost flights instantly, and target audiences by context or behavior, making campaigns more flexible and measurable.