
Market Overview
| Study Period | 2020 - 2031 |
|---|---|
| Forecast Data Period | 2026 - 2031 |
| Base Year Market Size (2025) | USD 403.72 Million |
| Market Size (2026) | USD 417.93 Million |
| Market Size (2031) | USD 496.62 Million |
| Growth Rate (2026 - 2031) | 3.52 % |
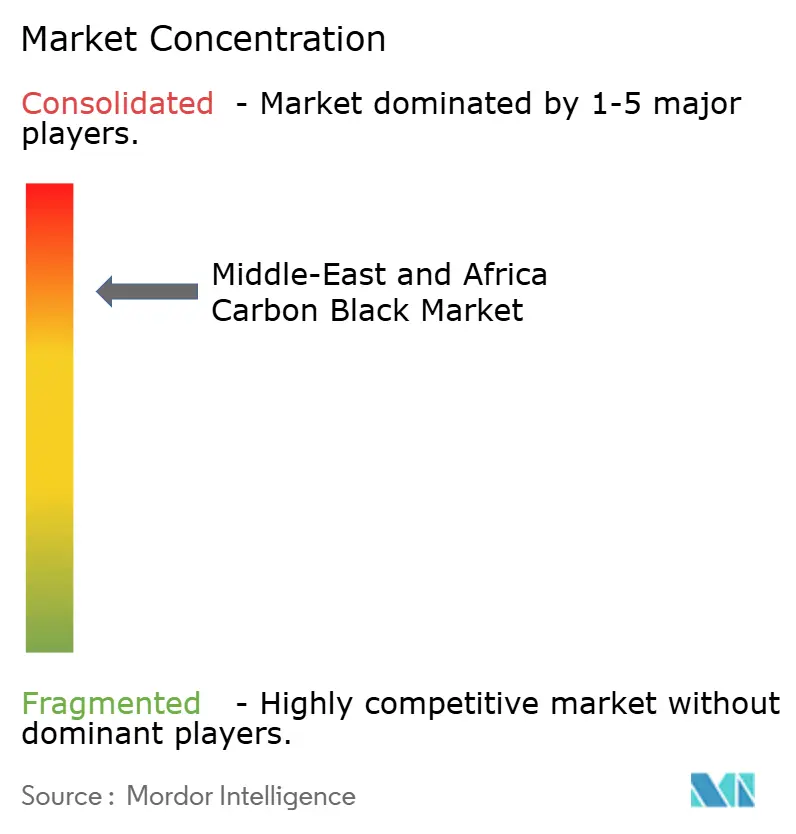
| Market Concentration | High |
Major Players *Disclaimer: Major Players sorted in no particular order Image © Mordor Intelligence. Reuse requires attribution under CC BY 4.0. | |
Middle-East And Africa Carbon Black Market Analysis by Mordor Intelligence
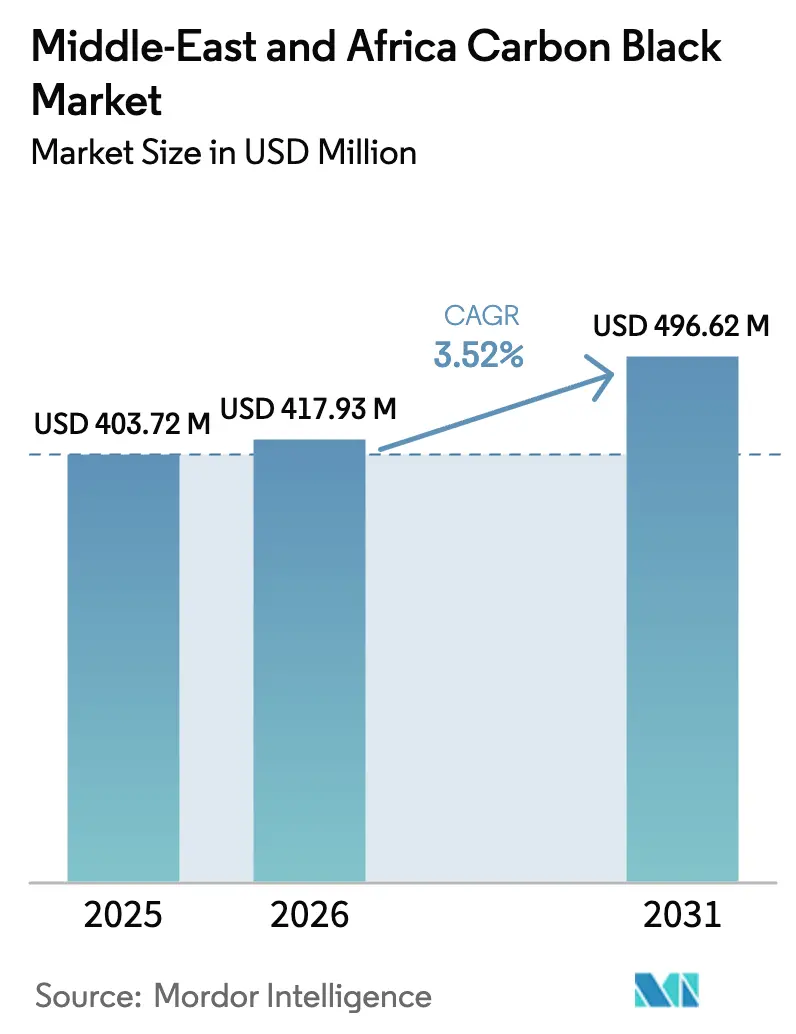
The Middle-East and Africa Carbon Black Market size is expected to grow from USD 403.72 million in 2025 to USD 417.93 million in 2026 and is forecast to reach USD 496.62 million by 2031 at 3.52% CAGR over 2026-2031. Firm feedstock availability in oil-rich economies underpins cost competitiveness, while sovereign wealth funds channel capital into petrochemical clusters that anchor tire, plastics, and energy-storage supply chains. Automotive localization programs in Saudi Arabia and the United Arab Emirates elevate in-region procurement of reinforcement and conductive grades, and public-private ventures accelerate recovered carbon black adoption in circular economy roads. At the same time, specialty grades for batteries, textiles, and coatings command higher margins, partially cushioning the impact of the gradual switch to silica-rich “green” tires. Competitive focus rests on process efficiency, emissions abatement, and strategic partnerships that secure customer offtake in diversified downstream industries.
Key Report Takeaways
- By process type, Furnace Black captured 71.62% of the Middle-East and Africa carbon black market share in 2025; it is also the fastest-growing process segment at a 4.31% CAGR through 2031.
- By application, Tires and Industrial Rubber Products led with a 53.88% revenue share in 2025, while Other Applications are projected to expand at a 4.66% CAGR to 2031.
- By geography, Saudi Arabia held 29.86% of regional revenue in 2025, whereas the United Arab Emirates is forecast to post the fastest growth at a 4.52% CAGR between 2026 and 2031.
Note: Market size and forecast figures in this report are generated using Mordor Intelligence’s proprietary estimation framework, updated with the latest available data and insights as of 2026.
Middle-East And Africa Carbon Black Market Trends and Insights
Drivers Impact Analysis*
| Drivers | (~) % Impact on CAGR Forecast | Geographic Relevance | Impact Timeline |
|---|---|---|---|
| Growing application in the fiber and textile industries | +0.8% | Turkey, Egypt, Morocco | Medium term (2-4 years) |
| Expansion of the automotive and tire sector | +1.2% | Saudi Arabia, UAE, Turkey | Long term (≥ 4 years) |
| Surge in conductive carbon black for Li-ion battery gigafactories | +0.9% | UAE, Saudi Arabia | Medium term (2-4 years) |
| Recovered carbon black uptake in circular-economy road projects | +0.6% | UAE, Saudi Arabia | Long term (≥ 4 years) |
| Increasing market penetration of specialty black | +0.7% | UAE, Saudi Arabia, Turkey | Medium term (2-4 years) |
| Source: Mordor Intelligence | |||
Growing Application in Fiber and Textile Industries
Advanced fiber-modification techniques now embed carbon black pigments that deliver antimicrobial protection against Staphylococcus aureus and Escherichia coli, helping regional mills supply healthcare and hygiene fabrics. Turkey benefits by aligning these technologies with its Twelfth Development Plan green mandates, while Egypt’s petrochemical complex secures upstream feedstock. The integration of carbon black in nylon, polyester, and acrylic fibers spreads demand beyond commodity apparel into higher-value technical textiles. As brands pursue traceable and sustainable inputs, specialty black grades gain pricing power and longer contracts.
Expansion of Automotive and Tire Sector
Saudi Arabia’s USD 550 million Pirelli plant in King Abdullah Economic City will roll out 3.5 million passenger tires annually from 2026, locking in furnace-grade volumes for two decades. Localization extends into electric-vehicle housings, battery components, and sealing systems, all of which employ tailored carbon black dispersions. Turkey leverages EU proximity to supply emission-compliant tire lines, while the United Arab Emirates channels petrochemical intermediates into synthetic rubber. Construction and mining projects across the Gulf and Africa further enlarge off-highway tire demand, reinforcing steady shipments of abrasion-resistant reinforcement blacks. Collectively, these dynamics anchor long-term baseline consumption even as vehicle electrification reshapes materials mixes.
Surge in Conductive Carbon Black for Li-ion Battery Gigafactories
Regional power-storage ambitions call for high-conductivity additives that lower cell impedance and extend cycle life. Orion’s PRINTEX kappa series reports premium uptake in pouch-cell electrodes destined for the United Arab Emirates’s solar-plus-storage farms. Saudi Arabia’s NEOM project lists more than 20 GWh of stationary storage, translating to incremental carbon black offtake in both anode and cathode slurries. Nanoparticle morphologies optimized for electronic pathways also enhance dynamic charge acceptance in advanced lead-acid batteries used for grid balancing. Government incentives that waive import duties on battery inputs shorten payback periods for local gigafactory investors, locking in multi-year supply contracts for conductive blacks.
Recovered Carbon Black Uptake in Circular-Economy Road Projects
Pyrolysis systems deliver recovered carbon black (rCB) with 40 to 50% cost savings against virgin equivalents while emitting less than 0.5 tons of CO2 per tonne produced[1]. United Arab Emirates highway tenders now mandate rCB asphalt modifiers, cutting virgin binder use and diverting waste tires from landfills. Nigeria’s extended-producer-responsibility laws funnel scrap tires into organized recycling streams, ensuring feedstock flow for new rCB plants. As infrastructure outlays accelerate across East and West Africa, contractors specify rCB-modified asphalt that improves fatigue life and skid resistance. The material’s lower carbon footprint aids governments in meeting Paris Agreement targets without compromising pavement durability.
Restraints Impact Analysis*
| Restraints | (~) % Impact on CAGR Forecast | Geographic Relevance | Impact Timeline |
|---|---|---|---|
| Accelerating switch to silica-based “green” tires | -1.1% | Turkey, UAE | Medium term (2-4 years) |
| Volatile feedstock pricing and supply risk | -0.9% | Saudi Arabia, UAE, Nigeria | Short term (≤ 2 years) |
| Competition from low-cost Asian imports | -0.7% | Import-dependent economies | Short term (≤ 2 years) |
| Source: Mordor Intelligence | |||
Accelerating Switch to Silica-Based “Green” Tires
OEM mandates for lower rolling resistance drive the replacement of carbon black with precipitated silica and silane coupling agents that cut fuel consumption by as much as 7%[2]. While silica improves wet grip, it complicates tire recycling and raises compounding costs, forcing Turkish plants to retrofit mixers and sourcing logistics. The transition threatens baseline demand for furnace blacks used in passenger car treads across the GCC. Producers respond by co-developing hybrid filler systems and expanding into specialty blacks for sidewalls and inner liners that retain reinforcement roles.
Volatile Feedstock Pricing and Supply Risk
Crude-linked feedstock swings squeeze margins, prompting Cabot to raise global contract prices in December 2024 to recover higher energy and maintenance costs. Currency depreciation in Nigeria and spot shortages tied to refinery turnarounds further destabilize procurement budgets for small compounding firms. South Africa’s coal-based stream faces rising carbon taxes, eroding cost advantages, and hastening potential capacity rationalization. Integrated producers in the Gulf partially hedge risk through long-term naphtha contracts, yet they remain exposed to geopolitical disruptions that constrain shipping lanes in the Red Sea and Strait of Hormuz.
*Our forecasts treat driver/restraint impacts as directional, not additive. The impact forecasts reflect baseline growth, mix effects, and variable interactions.
Segment Analysis
By Process Type: Furnace Black Drives Technical Innovation
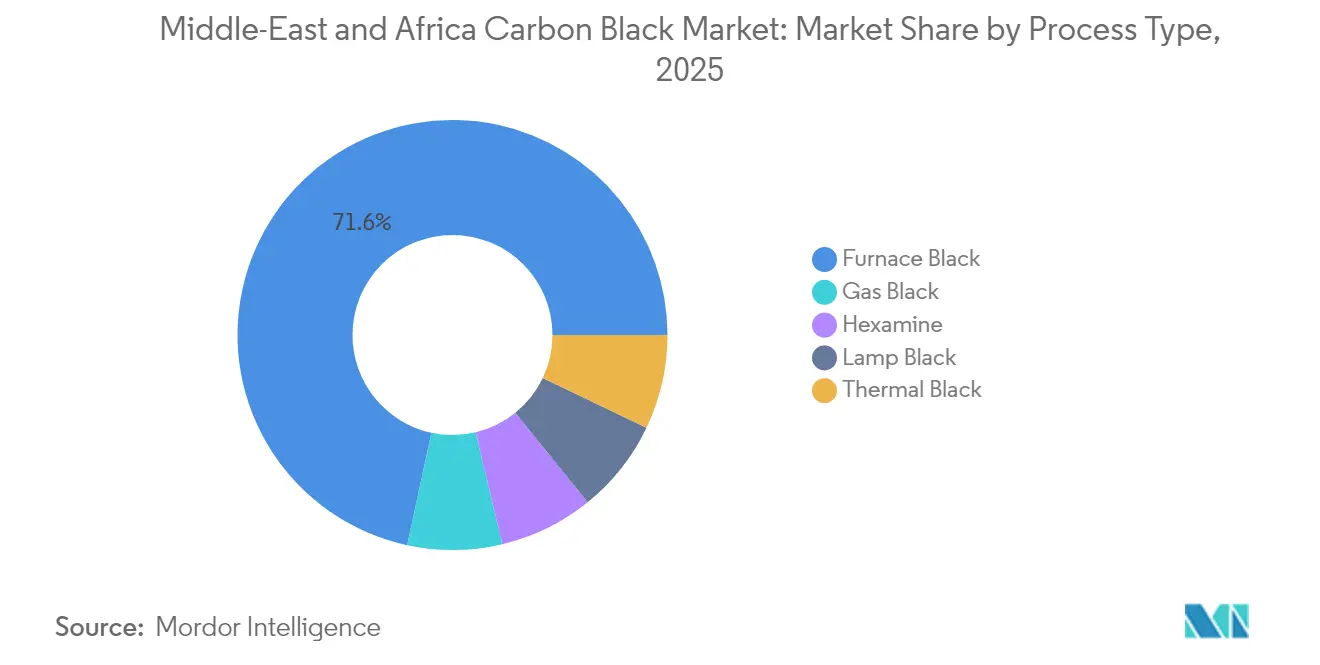
Furnace Black contributed 71.62% of regional revenue in 2025 and is projected to expand at 4.31% CAGR through 2031, supported by retrofits that recover waste heat and lower SOx emissions. Producers in Saudi Arabia and the United Arab Emirates leverage captive feedstock from steam crackers to maintain continuous operations and tight particle-size control. Gas Black retains niche status for high-jetness inks and Li-ion electrodes, yet supply remains constrained by reactor complexity. Lamp Black grows steadily in inks and coatings for metal packaging, benefiting from e-commerce-driven canning volumes. Thermal Black and Acetylene Black provide specialty conductivity in wire and cable insulation. The process landscape favors integrated refiners able to monetize by-product streams while meeting tightening emission caps.

By Application: Specialty Segments Outpace Traditional Demand
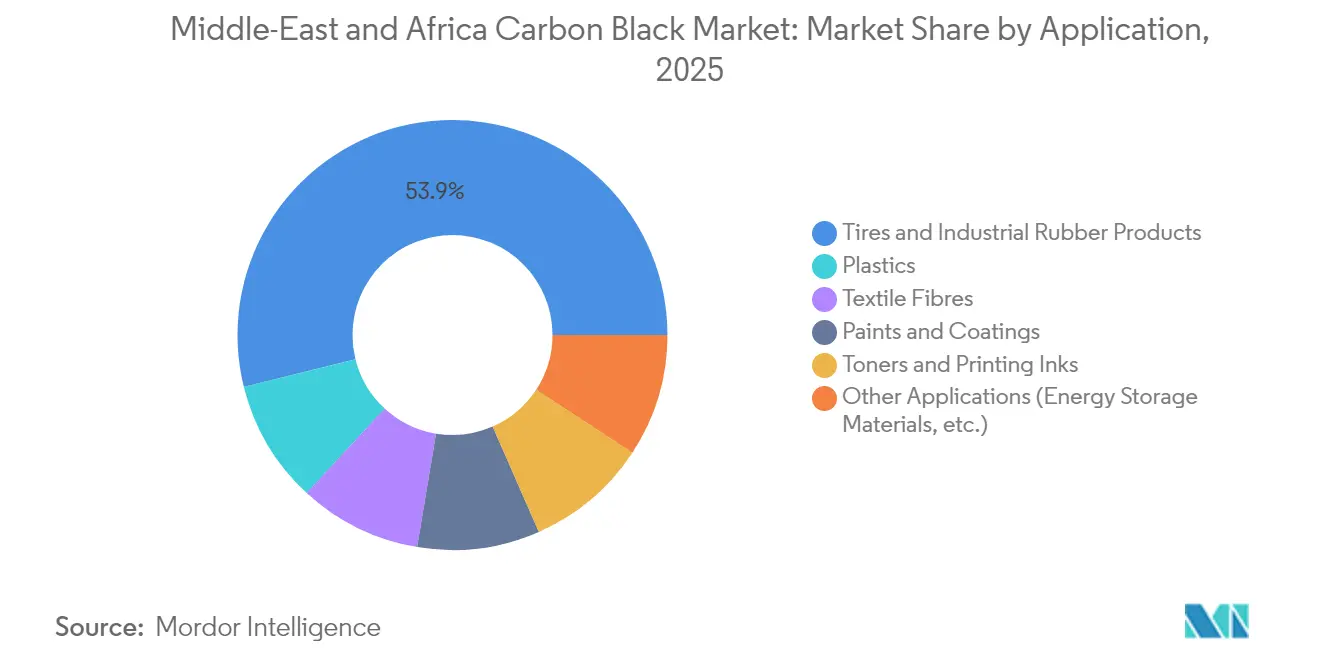
Tires and Industrial Rubber Products still accounted for 53.88% of 2025 revenue, anchored by OEM expansions and aftermarket growth. The Middle East and Africa carbon black market share that this application holds is projected to ease slightly as specialty grades accelerate. Other Applications, covering batteries, plastics, coatings, and fibers, are forecast to grow at a 4.66% CAGR.
Energy-storage demand rises as gigawatt-scale PV projects integrate lithium-iron-phosphate batteries requiring highly conductive carbon additives. Textile mills in Turkey and Morocco embed antimicrobial blacks in athletic and medical fabrics to command export premiums. Inkjet and laser printing segments use fine-particle blacks that enable high optical density at reduced tint strength, lowering overall pigment cost per square meter. This diversification shields producers from cyclical swings in tire output and supports balanced plant loadings.
Geography Analysis
Saudi Arabia anchored the Middle-East and Africa carbon black market in 2025 with a 29.86% revenue share, thanks to embedded feedstock advantages and multi-year offtake agreements with global tire majors. The United Arab Emirates is set to outpace the region with a 4.52% CAGR to 2031.
Free-zone incentives in Abu Dhabi streamline equipment imports for new masterbatch and energy-storage ventures, creating a virtuous feedback loop that lifts carbon black offtake. Turkey combines EU-aligned regulations with strong automotive and textile bases, tapping its Twelfth Development Plan to modernize green logistics and enhance materials circularity. Strategic rail links shorten lead times to European customers, boosting exports of value-added compound and battery components. In Africa south of the Sahara, Nigeria’s end-of-life tire rules trigger investment in pyrolysis hubs that supply recovered carbon black and fuel. South Africa wrestles with high carbon taxes on its coal-based stream, pushing Sasol to evaluate gasification retrofits or capacity cuts. Morocco sees rising demand for automotive wiring harnesses and textile fibers, reinforcing imports of conductive and pigment grades. Collectively, these geographies illustrate how policy, feedstock, and industrial strategy converge to shape growth trajectories across the Middle East and Africa carbon black market.
Value Chain Analysis
The regional value chain begins with crude-oil-derived feedstocks, including decant oil, FCC slurry, and other heavy aromatic streams, sourced from integrated refining and petrochemical clusters in the Gulf. Saudi industrial hubs such as Jubail and Yanbu act as key nodes that support furnace black production at scale. Carbon black producers then run continuous reactor operations, across furnace and specialty processes, with on-site utilities, emissions controls, and quality systems, before product is shipped through bulk handling and packaging into bagged and bulk logistics for compounders and converters.
Downstream, the largest pull comes from tire and industrial rubber manufacturing, supported by automotive localization programs that lift in-region procurement of reinforcement and conductive grades. Plastics, coatings, inks, and energy-storage materials contribute a broader specialty mix. Distribution is split between direct offtake contracts with large rubber and plastics compounders and regional distributors for smaller converters, with lead times and delivered cost tied to port access, cross-border trade frictions, and freight volatility. Circular flows are increasingly relevant through recovered carbon black from tire pyrolysis, which feeds back into rubber and asphalt modifier applications where specifications and tender requirements allow partial substitution for virgin grades.
Competitive Landscape
The Middle-East and Africa carbon black market features consolidation with vertically integrated majors such as Birla Carbon, SABIC, and ADNOC holding the advantage of captive feedstock and regional logistics. Mid-tier independents fill supply gaps in specialty grades, while new entrants pursue recovered carbon black technology to undercut virgin costs and meet sustainability quotas. Price leadership remains fluid because each quarterly contract now includes feedstock escalation clauses tied to Brent and propylene benchmarks.
Middle-East And Africa Carbon Black Industry Leaders
-
Cabot Corporation
-
Birla Carbon
-
Continental Carbon Company
-
Orion S.A
-
SABIC
- *Disclaimer: Major Players sorted in no particular order
Market Opportunities and Future Outlook
Localization of the tire and broader automotive supply chain creates commercial whitespace for regional offtake-backed supply of reinforcement and conductive grades. In February 2026, SABIC signed a supply agreement with the PIF-Pirelli joint venture for the King Abdullah Economic City tire project, covering polybutadiene rubber and carbon black for a plant targeting 3.5 million tires per year, which strengthens the case for local and nearby sourcing models supported by long-duration volumes.
Specialty carbon black opportunities focus on conductivity and dispersion performance in energy-storage materials and on higher-value pigment applications in coatings, inks, and technical textiles. Buyer behavior already reflects tighter management of volatility and logistics risk, visible in 2026 specialty-grade price actions and surcharge mechanisms by global suppliers, which increases interest in supply structures that reduce delivered-cost uncertainty. Circular-economy road and recycling initiatives, including recovered carbon black integration in infrastructure uses, also broaden partnership pathways among pyrolysis operators, asphalt contractors, and compounders to qualify rCB-containing formulations and extend end-market reach beyond conventional tire tread reinforcement.
Recent Industry Developments
- March 2026: Cabot Corporation announced a global price increase for specialty carbon black products of up to 20 percent, citing supply chain disruptions from the Middle East conflict and rising logistics and feedstock costs. The increase reflects price dynamics in specialty carbon black supply and highlights pressures on regional cost structures amid ongoing regional tensions. It also realigns margins for high value grades and supports profitability in a volatile market environment.
- March 2026: Orion S.A. announced a global price increase for its Specialty segment of up to 25 percent and the introduction of a variable surcharge, citing supply chain volatility and feedstock costs related to the Middle East conflict. This pricing approach targets volatility in regional procurement while stabilizing earnings through a dynamic surcharge mechanism. It mitigates feedstock and logistics volatility in regional markets by linking charges to changing input costs.
- March 2026: SABIC signed an agreement to supply carbon black and polybutadiene rubber to the new PIF-Pirelli tire manufacturing joint venture located in King Abdullah Economic City, Saudi Arabia. The arrangement strengthens local supply chain integration and anchors regional carbon black demand for tire production. It positions SABIC as a key regional supplier in a strategic automotive and rubber cluster supporting in-region manufacturing capacity.
Research Methodology Framework and Report Scope
Market Definition and Coverage
For this study, the market covers carbon black sold and consumed across the Middle East and Africa for rubber reinforcement and non-rubber uses, measured in value terms at the regional level.
Scope exclusions: We exclude activated carbon, graphite, carbon fiber, carbon nanotubes, and general carbon additives that are not traded as carbon black.
Segmentation Overview
- By Process Type
- Furnace Black
- Gas Black
- Lamp Black
- Thermal Black
- Hexamine
- By Application
- Tires and Industrial Rubber Products
- Plastics
- Films and Sheets
- Pressure Pipes
- Molded Parts
- Toners and Printing Inks
- Paints and Coatings
- Textile Fibres
- Nylon
- Polyester
- Acrylic
- Other Applications (Energy Storage Materials, etc.)
- By Geography
- Saudi Arabia
- United Arab Emirates
- Qatar
- Kuwait
- Turkey
- South Africa
- Egypt
- Nigeria
- Morocco
- Rest of Middle-East and Africa
- Saudi Arabia
Data Sources, Market Sizing, and Validation
Desk Research
Desk work starts by mapping the demand pool that drives carbon black in this region, and then aligning it with what is visible in public statistics. We leaned on non-paywalled sources such as UN Comtrade for trade flows under relevant carbon black codes, national statistics offices and customs authorities for import and production indicators, and OICA-style automotive output series where available to anchor tire-linked demand.
On the supply side, we reviewed producer and downstream company filings, investor presentations, and reputable press releases to capture capacity changes, utilization commentary, and pricing or feedstock signals. We also used paid subscriptions that consolidate company financials, shipment level trade records, patents, and contracts and tenders, which helped us avoid missing smaller but active flows. The sources listed here are illustrative, and many other public and paid references were used for cross-checking, validation, and clarifying gaps.
Primary Interviews and Surveys
Primary work focused on checking real buying patterns, not just theoretical consumption, through interviews and structured surveys with producers, distributors, tire and rubber compounders, plastics and masterbatch participants, and inks and coatings buyers. Since this is a regional market, inputs were balanced across the Gulf, North Africa, and Sub-Saharan Africa, and then refined using local pricing, logistics constraints, and substitution effects (including partial shifts toward silica in tire recipes).
Distribution of primary research fieldwork respondents
| Company type | Respondent position |
|---|---|
| Top tier: 30% | CXOs: 20% |
| Mid tier: 48% | Functional/Unit leaders: 27% |
| Smaller Players: 22% | Managers: 53% |
Market-Sizing & Forecasting
Sizing uses a top-down and bottom-up blend, starting from an end-use demand pool build up that links carbon black needs to tire output, replacement demand, and non-tire rubber and plastics activity across key countries. The totals are then corroborated through selective bottom-up checks using supplier and distributor views on regional volumes, typical grade splits, and sampled ASP x volume snapshots for main trade lanes.
Inputs that mattered in the model included tire production and import dependence by country, rubber compounding intensity in key hubs, carbon black import volumes and unit values, announced capacity additions and shutdowns, and energy and feedstock signals that influence pricing. Where direct local production data was limited, gaps were handled by combining trade based apparent consumption with interview-backed adjustment factors for inventory swings and re-exports.
Forecasting was done using scenario analysis with a central case, supported by short lists of variables that respondents agreed they track most closely, such as vehicle parc growth, infrastructure-driven commercial tire demand, and regional manufacturing localization programs. Assumptions for ASP movement were kept transparent by using observed unit value trends and agreed pass-through behavior rather than aggressive step changes.
Data Validation & Update Cycle
Validation is done by comparing model outputs against independent signals like import trends, capacity announcements, and downstream production indicators, and then reconciling any large variances country by country. When anomalies show up, the data is re-checked back to the original source, and follow-up calls are triggered to confirm whether the change is timing, pricing, or a real demand shift.
Before sign-off, the model goes through multi-step analyst review so the assumptions, conversions, and aggregation logic are consistent across countries and applications. Reports are refreshed annually, with interim updates when material events happen, and a final pre-delivery review pass is completed so clients receive the most current view available.
Mordor Intelligence's Middle East and Africa Carbon Black Market Estimate Compared With Other Published Estimates
Published market values for MEA carbon black do not always match, mainly because firms apply different boundaries on what counts as carbon black sales in the region and how they time pricing and currency conversion. We also see differences when some estimates rely heavily on a single year of trade values, which can swing due to freight rates and re-export patterns.
Import unit values, apparent consumption built from trade flows, and country level capacity and utilization signals are the evidence checks that tie Mordor Intelligence's estimate to a repeatable demand pool, and then keep the pricing layer realistic for the base year.
Benchmark comparison
| Source | Market Size | Gaps in Research Methodology |
|---|---|---|
| Mordor Intelligence | USD 403.72 M (2025) | |
| Trade Journal A | USD 421.08 M (2022) | Earlier base year and price environment, and the value line can be distorted by short-term freight and currency effects when trade values are used as the main anchor. |
| Regional Consultancy B | USD 521.82 M (2028) | Forward year headline can look larger when optimistic tire growth and faster ASP escalation are assumed, and when re-exports are not consistently netted out across MEA hubs. |
The spread in the table is mostly explained by timing and by how trade and re-export effects are treated in MEA, followed by different price progression assumptions into the forecast years. By keeping the demand pool logic visible and then cross-checking it with supply and trade signals, our market size stays easier to audit and update as conditions shift.
Key Questions Answered in the Report
How large is the Middle East and Africa carbon black market in 2026?
The market is valued at USD 417.93 million in 2026 and is projected to grow at a 3.52% CAGR to USD 496.62 million by 2031.
Which process segment leads the regional market?
Furnace Black leads with 71.62% revenue share in 2025 and is also the fastest-growing process at a 4.31% CAGR through 2031.
What is driving specialty carbon black demand in the region?
Rapid growth in battery gigafactories, technical textiles, and UV-resistant plastics is shifting demand toward conductive and pigment-grade blacks that offer higher margins and performance benefits.
How is recovered carbon black influencing supply dynamics?
Recovered carbon black provides 40-50% cost savings and lower emissions compared with virgin grades, and government mandates for circular economy roads in the UAE and Nigeria are accelerating its uptake.
Which country is expected to grow fastest between 2026 and 2031?
The United Arab Emirates is forecast to record the highest growth, expanding at a 4.52% CAGR as low-carbon investments spur specialty-grade consumption.