
Market Overview
| Study Period | 2020 - 2031 |
|---|---|
| Forecast Data Period | 2026 - 2031 |
| Base Year Market Size (2025) | USD 24.93 Billion |
| Market Size (2026) | USD 29.28 Billion |
| Market Size (2031) | USD 65.39 Billion |
| Growth Rate (2026 - 2031) | 17.45% CAGR |
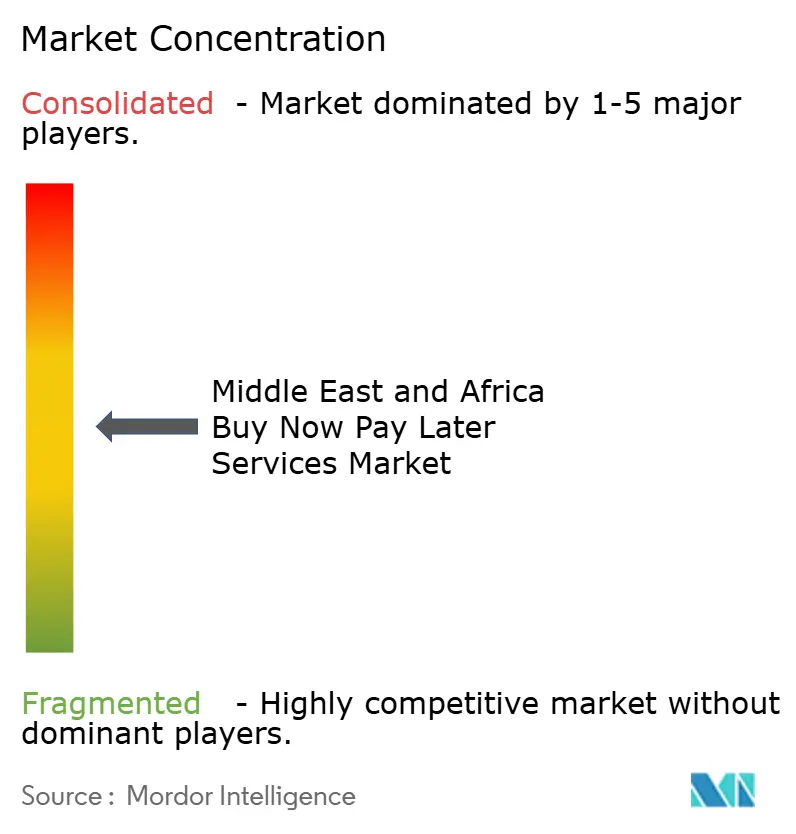
| Market Concentration | Medium |
Major Players *Disclaimer: Major Players sorted in no particular order Image © Mordor Intelligence. Reuse requires attribution under CC BY 4.0. | |
Middle East And Africa Buy Now Pay Later Services Market Analysis by Mordor Intelligence
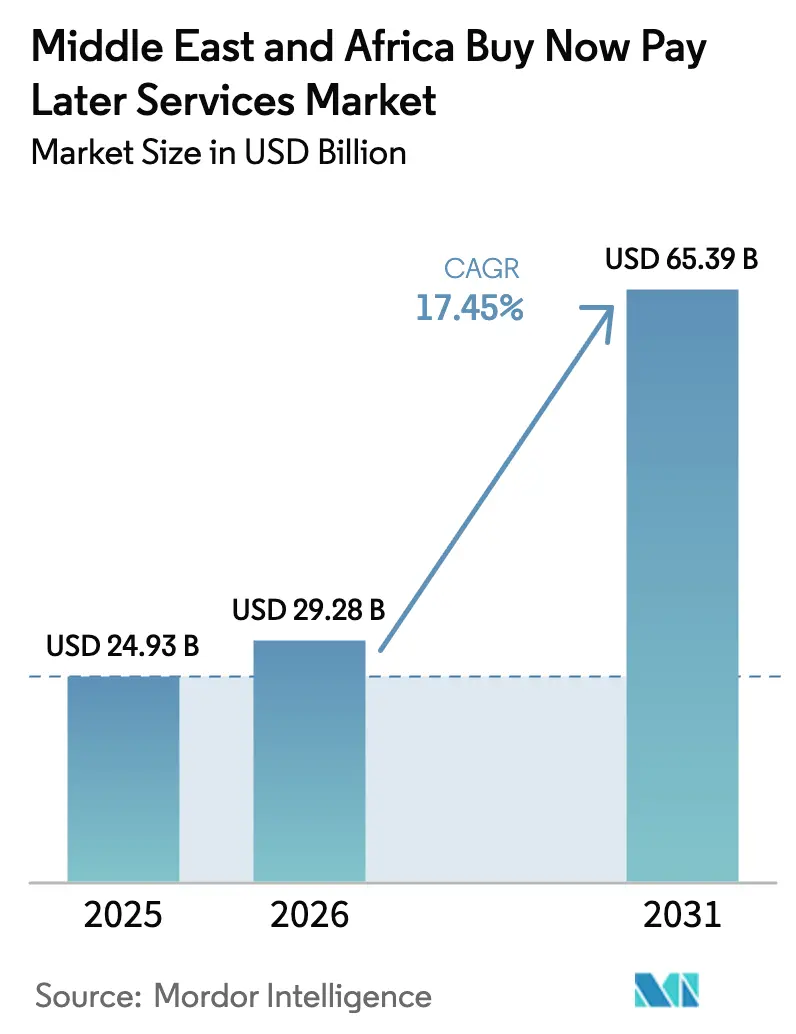
The Middle East and Africa BNPL market size was valued at USD 24.93 billion in 2025 and estimated to grow from USD 29.28 billion in 2026 to reach USD 65.39 billion by 2031, at a CAGR of 17.45% during the forecast period (2026-2031). Rising smartphone ownership, open-banking rollouts, and supportive licensing regimes in Saudi Arabia and the UAE are accelerating provider expansion. Fintech innovators still set the pace, yet established banks are scaling quickly by pairing balance-sheet strength with digital distribution. Country growth differentials are widening: Saudi Arabia’s regulatory clarity is driving mainstream adoption, while Nigeria’s mobile-money momentum is unlocking first-credit access for millions. Segment opportunity is shifting from fashion toward essential services such as healthcare, and from pure e-commerce toward fully omnichannel journeys that blur online and in-store checkout.
Key Report Takeaways
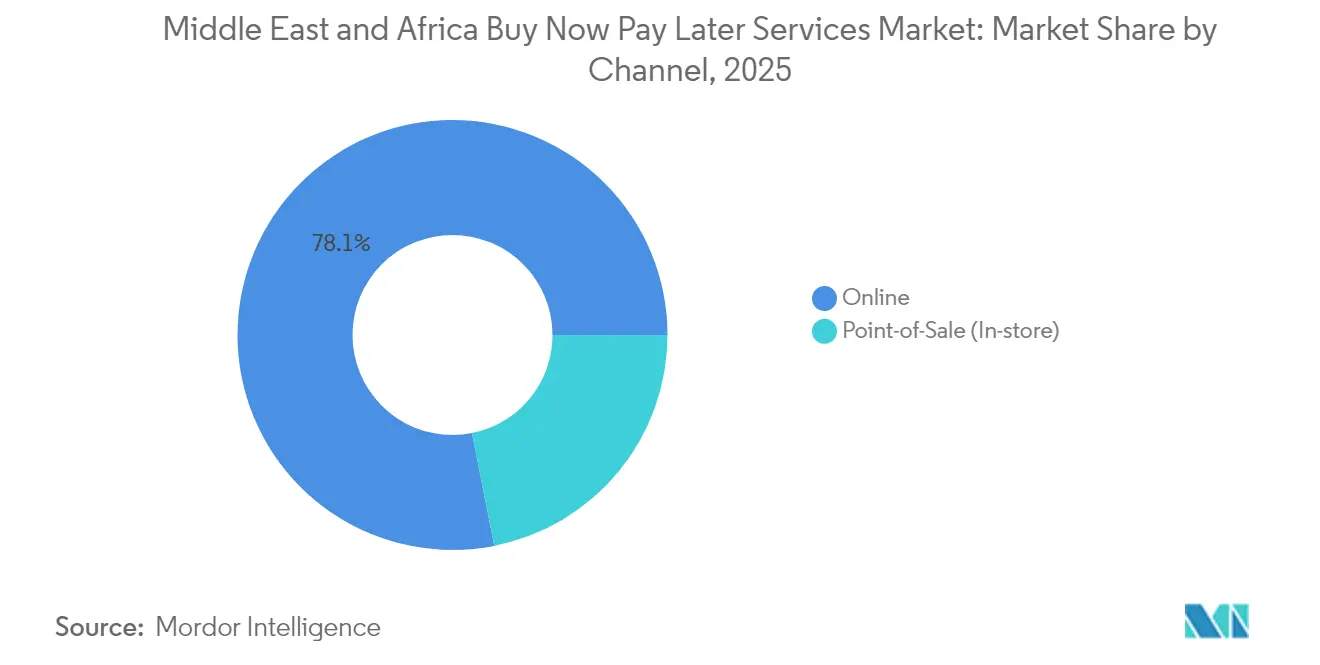
- By channel, the online segment led with 78.12% of Middle East and Africa BNPL market share in 2025; point-of-sale BNPL is projected to expand at a 19.65% CAGR through 2031.
- By end-use industry, fashion and apparel accounted for 32.85% share of the Middle East and Africa BNPL market size in 2025, while healthcare and wellness records the highest forecast CAGR at 21.22% to 2031.
- By age group, millennials held a 44.10% share of the Middle East and Africa BNPL market in 2025; Generation Z is set to grow fastest at a 22.85% CAGR.
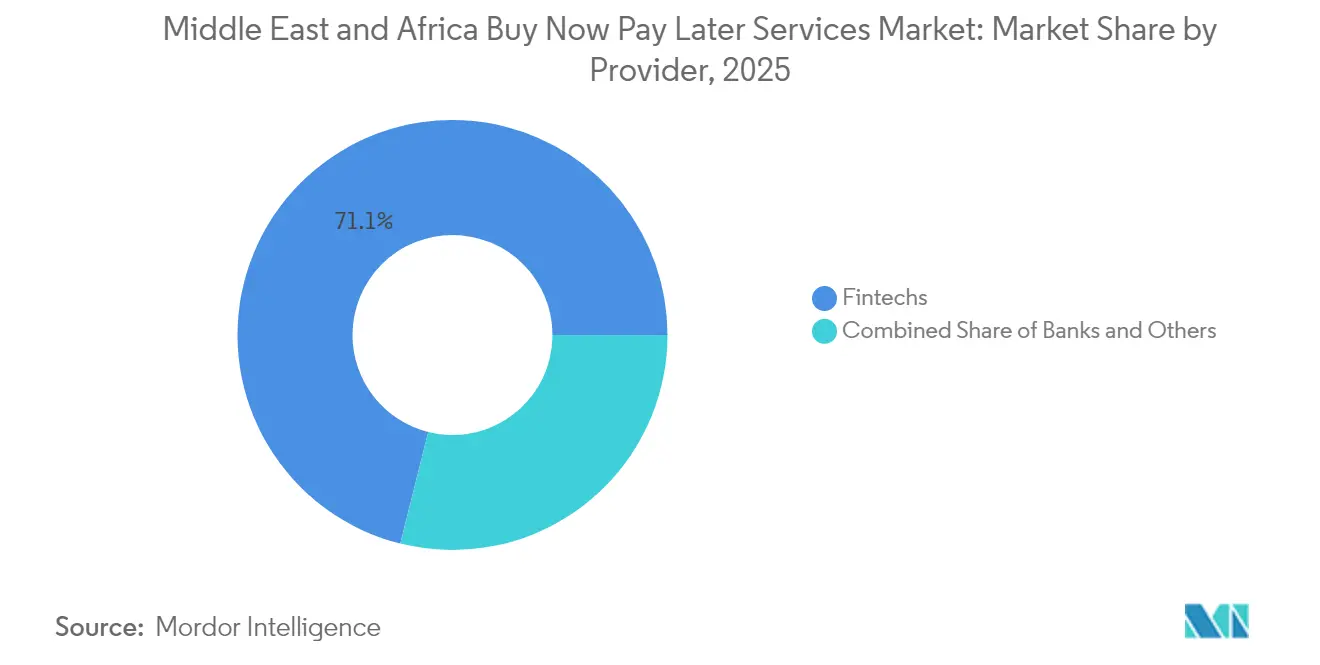
- By provider, fintechs commanded a 71.10% share of the Middle East and Africa BNPL market in 2025, whereas banks show the strongest growth outlook at 18.95% CAGR.
- By country, Saudi Arabia led with 22.30% revenue share in 2025; Nigeria is projected to outpace peers with a 19.15% CAGR during 2026-2031.
Note: Market size and forecast figures in this report are generated using Mordor Intelligence’s proprietary estimation framework, updated with the latest available data and insights as of 2026.
Middle East And Africa Buy Now Pay Later Services Market Trends and Insights
Drivers Impact Analysis*
| Driver | (~) % Impact on CAGR Forecast | Geographic Relevance | Impact Timeline |
|---|---|---|---|
| Regulatory sandboxes & licensing in KSA & UAE | +3.8% | Saudi Arabia, UAE, spillover to wider GCC | Medium term (2-4 years) |
| Smartphone penetration in the GCC | +2.9% | UAE, Saudi Arabia, Qatar, Kuwait, Oman, Bahrain | Short term (≤ 2 years) |
| Youth-dominated demographics | +3.2% | Region-wide, highest in Saudi Arabia, Egypt, Nigeria | Medium term (2-4 years) |
| Merchant conversion gains in fashion & electronics | +2.1% | UAE, Saudi Arabia, South Africa | Short term (≤ 2 years) |
| First-credit access for Africa’s unbanked | +2.7% | Nigeria, Egypt, South Africa, the rest of Africa | Long term (≥ 4 years) |
| Venture funding wave | +1.8% | Region-wide, concentrated in the UAE and Saudi Arabia | Short term (≤ 2 years) |
| Source: Mordor Intelligence | |||
Regulatory Sandboxes & Licensing in KSA & UAE Catalysing BNPL Scale
The Saudi Central Bank issued detailed BNPL rules in December 2023 that formalised capital thresholds and consumer safeguards, prompting investors to fund scale-ups and helping players such as Tamara secure full consumer-finance licences in March 2025. The Central Bank of the UAE followed with revised Finance Companies Regulation in January 2025, allowing Restricted Licence Finance Companies to offer short-term instalment products under clear prudential oversight[1]Central Bank of the UAE, “Amended Finance Companies Regulation,” cbuae.gov.ae. These frameworks anchor long-term confidence, create disciplined entry paths for newcomers, and encourage cross-border passporting across the wider GCC. The net effect is a maturing credit alternative that attracts partnerships with banks and global payment processors, driving broader merchant acceptance and deeper consumer trust.
Smartphone Penetration in GCC Fuelling App-based Checkout
Mobile subscriptions exceed population totals in most GCC states, and this ubiquity lets BNPL apps embed directly into retail journeys. Providers optimise for one-tap approval, personalised instalment schedules and loyalty integration, shrinking checkout friction and lifting merchant conversion. Continuous 5G rollout expands bandwidth for richer app experiences, while biometric ID lets new users onboard in minutes. The result is a feedback loop: as mobile commerce climbs, BNPL volumes soar, which in turn nudges more merchants to enable the option across both web and store environments.
Youth-Dominated Demographics Driving Micro-ticket E-commerce Credit
Nearly 60% of the region’s population is under 30. Surveys show that over half of Gen Z shoppers in the UAE already prefer digital payments, including instalment options[2]Emirates NBD, “Digital Banking Investment Updates,” emiratesnbd.com. Younger cohorts value budget control and dislike revolving credit; BNPL’s transparent schedule resonates strongly. Providers respond with lower ticket-size offers, gamified repayment reminders, and social-media-driven referral programs that capture peer influence. As this generation advances in earning power, their entrenched digital habits are expected to shift overall payment preference definitively toward BNPL.
Merchant Conversion Gains in Fashion & Electronics Boosting Adoption
Retailers that embed BNPL routinely report lower cart abandonment and higher average order value, especially for discretionary categories with mid-range price points. Fashion platforms showcase instalment messaging early in the browsing journey, turning browsers into committed purchasers. Electronics chains deploy QR-based in-store enrolment to match online flexibility. Large merchants now negotiate revenue-share agreements with BNPL partners, exchanging data insights and co-marketing benefits that differentiate the shopping experience.
Restraints Impact Analysis*
| Restraint | (~) % Impact on CAGR Forecast | Geographic Relevance | Impact Timeline |
|---|---|---|---|
| Rising Default Rates amid Inflation in Africa | -1.9% | Nigeria, Egypt, South Africa, Rest of Africa | Medium term (2-4 years) |
| Tighter Compliance Costs under 2024 SAMA / UAE BNPL Rules | -1.2% | Saudi Arabia, UAE | Short term (≤ 2 years) |
| Sparse Credit-Bureau Data Hindering Real-time Risk Scoring | -1.5% | Nigeria, Egypt, Rest of Africa | Long term (≥ 4 years) |
| High Merchant Discount Fees Limiting Adoption in Price-Sensitive Sectors | -0.8% | Pan-regional, with highest impact in Africa | Medium term (2-4 years) |
| Source: Mordor Intelligence | |||
Rising Default Rates amid Inflation in Africa
Currency depreciation and higher food prices reduce disposable income, straining borrowers’ repayment capacity. Nigerian providers report elevated delinquencies, especially among first-time borrowers[3]Central Bank of Nigeria, “Operational Guidelines for Open Banking,” cbn.gov.ng. Firms recalibrate scorecards by incorporating macro indicators and sector exposures, which slows approval speed and dampens customer acquisition. Some shift toward secured offers, such as smartphone-backed loans, to preserve asset recovery options. Over time, inflation moderation and richer credit-bureau data should restore growth momentum, but the near-term effect trims overall expansion.
Tighter Compliance Costs under 2024 SAMA / UAE Rules
Both regulators now mandate granular disclosure, transaction monitoring, and localisation of key functions. Saudi guidelines cap individual BNPL limits at SAR 5,000 (USD 1,332) and set staged Saudisation quotas. Compliance teams, AML systems, and Islamic-finance audits raise fixed costs, particularly for cross-border entrants that lack local entities. Larger banks can absorb the burden more easily, giving them an advantage in rolling out white-label instalment services. Smaller fintechs either consolidate or partner with licensed players, reducing market fragmentation but tempering immediate innovation velocity.
*Our forecasts treat driver/restraint impacts as directional, not additive. The impact forecasts reflect baseline growth, mix effects, and variable interactions.
Segment Analysis
By Channel: Online Dominance Faces In-store Challenge
Online transactions represented 78.12% of the Middle East and Africa BNPL market share in 2025, supported by frictionless web and in-app integration that aligns with the e-commerce boom. Merchants embrace dynamic instalment messaging to trim abandonment, while gateway providers bundle BNPL buttons alongside cards and wallets. Cross-border platforms funnel regional shoppers onto GCC websites, extending reach for local BNPL offers. The integration of real-time open-banking data further streamlines online risk checks, strengthening approval rates without manual review.
Point-of-sale solutions are projected to grow at 19.65% CAGR, closing the gap as retailers seek seamless omnichannel experiences. Near-field communication, QR codes, and cloud-based POS systems now let sales associates trigger BNPL approvals in seconds. Partnerships such as Checkout.com with Tabby embed the option directly into POS terminals, unlocking physical-store categories like furniture and groceries. As a result, the Middle East and Africa BNPL market size for in-store transactions is expected to multiply through 2031, reflecting consumer demand for payment consistency across all shopping contexts.


By End-Use Industry: Fashion Leads While Healthcare Accelerates
Fashion and apparel accounted for 32.85% of the Middle East and Africa BNPL market size in 2025, benefiting from frequent purchase cycles and aspirational buyers. Retailers leverage instalments to upsell premium lines and encourage multi-item baskets, while BNPL apps feature fashion-centric discovery feeds that channel traffic back to merchant sites. Seasonal campaigns around Ramadan and Black Friday amplify volumes, making fashion the bellwether category for new feature rollouts such as instant refunds on returns.
Healthcare and wellness spend is forecast to grow fastest at 21.22% CAGR as consumers embrace instalments for elective surgery, dental work, and preventive packages. Saudi Arabia’s push to develop medical tourism under Vision 2030 widens the addressable demand. Providers tailor longer-tenure plans that fit treatment schedules and partner with clinics for on-site sign-ups. These dynamics position healthcare to narrow the volume gap with fashion by decade-end and diversify revenue beyond discretionary retail.
By Age Group: Millennials Lead While Gen Z Accelerates
Millennials held 44.10% of the Middle East and Africa BNPL market share in 2025. Their peak earning years and comfort with managing app-based finances underpin large ticket sizes across electronics, travel, and home improvement. Providers target this cohort with budgeting dashboards and loyalty cash-backs that mirror card programs, reinforcing repeat use.
Generation Z, with a projected 22.85% CAGR, is set to reshape product design. This cohort values fast onboarding and social validation, prompting features like in-app influencer content and group payment splitting. As their spending power rises, the Middle East and Africa BNPL market size attributable to Gen Z purchases is expected to rival that of millennials, compelling merchants to optimise checkout flows for mobile-native journeys.
By Provider: Fintechs Dominate While Banks Accelerate
Fintechs controlled a 71.10% share in 2025 thanks to first-mover scale, agile underwriting, and brand resonance with younger shoppers. Tabby and Tamara have turned funding rounds into nationwide merchant networks and super-app roadmaps that now include debit products and subscription management. Their rapid product cycles set user-experience benchmarks that incumbents must match.
Banks are catching up, leveraging core deposit franchises and regulatory familiarity to roll out instalment options inside mobile-banking apps. With an expected 18.95% CAGR, their share could double by 2031 as they bundle BNPL with salary accounts and credit-card loyalty. White-label partnerships allow smaller lenders to launch quickly, while larger groups build proprietary orchestration engines that feed risk data into existing credit bureaus.
Geography Analysis
Saudi Arabia commanded 22.30% of the Middle East and Africa BNPL market share in 2025, anchored by strict yet enabling oversight from the Saudi Central Bank. Vision 2030’s goal of 70% cashless payments by 2025 turbo-charges adoption across retail, travel, and public-service portals. Tamara’s full licence and Tabby’s planned IPO on the Saudi Exchange signal confidence in sustained domestic scale. Tourism diversification adds incremental demand as visitors use BNPL for accommodations and leisure packages.
The UAE ranks second, supported by a digital economy growing 12.3% annually. Finance-company rule changes in 2025 legitimise stand-alone BNPL players, while incumbent banks such as Emirates NBD invest in fintech units to co-create instalment engines. Dubai’s e-commerce sellers increasingly mandate at least one BNPL option, and cross-border shoppers from Asia tap UAE-issued BNPL accounts for duty-free purchases, widening transaction pools.
Nigeria leads African growth with a 19.15% CAGR outlook. Open-banking guidelines enable providers to fetch account and salary data for real-time assessments. Telco-powered wallets give BNPL firms low-cost distribution channels, yet inflation volatility raises provisioning costs that temper near-term profitability. South Africa follows with expanding uptake via Payflex and PayJustNow, particularly in home improvement and education verticals. Egypt’s cash-dominant culture slows uptake, but regulatory encouragement of fintech sandboxes is improving visibility.
Regulatory Landscape
Regulation in the Middle East and Africa BNPL market is anchored by formal short-term credit frameworks in the GCC. In Saudi Arabia, the Saudi Central Bank (SAMA) implemented the Rules Governing BNPL Companies effective December 2023, setting licensing, governance, and consumer protection requirements. These include a minimum capital threshold (SAR 5 million) and mandated AML/CTF controls. Saudi rules also formalize consumer exposure guardrails, including a per-consumer outstanding ceiling and installment limits, which increases the compliance burden for smaller fintech entrants while improving lender and merchant confidence.
In the UAE, the Central Bank of the UAE (CBUAE) introduced a framework to regulate short-term credit facilities under the Finance Companies Regulation (effective December 2023). It requires BNPL providers to be licensed as Restricted Licence Finance Companies, or to operate as agents of licensed banks or finance companies. The UAE framework includes consumer affordability and fee safeguards, such as credit size caps (linked to income and an AED 20,000 ceiling) and a cap on total fees as a share of the original credit amount. Across the region, tighter supervision is accelerating the shift from informal pay-later offers to regulated structures and partnership-led operating models.
Value Chain Analysis
The BNPL value chain in the Middle East and Africa starts with funding capacity and risk infrastructure, then moves through platform underwriting and distribution to merchants and consumers. Banks and finance companies supply balance-sheet funding and increasingly act as regulated principals, notably in the UAE where providers must be licensed or operate as agents. Fintech BNPL platforms such as Tabby, Tamara, Postpay, Cashew, and valU manage customer onboarding, credit decisioning, repayment servicing, and customer support.
Credit assessment inputs combine bank and card rails where available, alongside alternative data such as e-commerce behavior, device signals, and telecom-linked data to compensate for uneven bureau coverage in parts of Africa. Distribution and acceptance depend on merchant integrations across e-commerce checkouts, payment gateways, and POS systems, with omnichannel enablement relying on APIs, QR code flows, and compatibility with modern cloud POS stacks. Key value-chain bottlenecks include compliance (AML/CTF monitoring, disclosures, and local licensing), data access quality for real-time risk scoring, especially where credit-bureau depth is limited, and merchant commercial terms such as discount rates and settlement timing. As regulation formalizes, orchestration partnerships between BNPL platforms, payment processors, and banks become more central to scaling coverage while meeting local prudential and consumer-protection requirements.
Competitive Landscape
Competitive intensity is rising yet remains moderately concentrated. Regional fintech champions Tabby, Tamara, and valU have each passed the USD 1 billion valuation mark, collectively covering tens of thousands of merchants and millions of active users. Their marketing budgets and loyalty ecosystems create entry barriers for smaller start-ups. Traditional banks counter with low funding costs and trusted brands, bundling BNPL into holistic digital-banking propositions that appeal to salaried customers.
Strategic alliances are proliferating. Checkout.com now embeds Tabby into its payment rails, giving merchants a single integration path and enriching Tabby’s data lake for risk modelling. Telecom operators explore handset-bundled instalments that feed traffic to their mobile-money services. Consolidation is underway: larger infrastructure players acquire niche BNPL specialists to broaden APIs for card issuers and retailers, as seen in NymCard’s Spotii takeover.
White-space opportunities persist. B2B BNPL aims to solve SME inventory cash-flow gaps, while sector-specific solutions for elective healthcare and education are in pilot. Providers differentiate through AI-driven identity verification, Islamic-finance compliant structures, and embedded loyalty that transforms BNPL from a payment choice into a customer-lifecycle tool. The competitive narrative is therefore shifting from pure instalment functionality toward platform breadth, data depth, and ecosystem partnerships.
Middle East And Africa Buy Now Pay Later Services Industry Leaders
Tabby
Tamara
Postpay
Cashew
valU
- *Disclaimer: Major Players sorted in no particular order

Market Opportunities and Future Outlook
Regulatory formalization across additional MEA markets is creating actionable whitespace for licensed BNPL models and for infrastructure-led distribution. Oman issued Regulation Governing the Practice of the Buy Now, Pay Later Activity in February 2026, providing a defined licensing and consumer-protection structure. This includes a spending limit and maximum term, which supports market entry planning for providers and acquiring partners targeting GCC expansion beyond Saudi Arabia and the UAE. Capability expansion by leading platforms is also pushing BNPL into adjacent financial products that deepen engagement and broaden use cases beyond discretionary retail. Tabby secured a Stored Value Facilities license from the Central Bank of the UAE in April 2026, enabling wallet-like spending accounts and related money management tools within a regulated perimeter.
Category-level opportunity is shifting toward high-ticket and essential spending, where installment affordability is more material and merchant conversion impact is more relevant. In the UAE, networks and issuers are embedding installments into merchant stacks, including the launch of Slice by Network International in June 2026 for UAE merchants. This option is designed to lower integration friction for merchants that prefer card-based installment arrangements over standalone BNPL apps.
Recent Industry Developments
- July 2026: Tabby launched Tabby Cash in the UAE, introducing a spending account with a cashback card and local money transfers. The product expands Tabby beyond checkout financing into day-to-day money movement, strengthening retention and increasing transaction frequency beyond episodic BNPL purchases.
- June 2026: Network International launched Slice in UAE merchants. It expands BNPL-like installment capabilities within existing merchant stacks and improves merchant onboarding at scale.
- May 2025: Checkout.com partnered with Tabby to embed BNPL into its merchant platform across the UAE and Saudi Arabia. This simplified BNPL enablement for enterprise merchants through a single payments integration and increased Tabby distribution through acquirer and gateway-led rollout.


Research Methodology Framework and Report Scope
Market Definition and Coverage
For this study, the market covers consumer buy now pay later (BNPL) services used at checkout in the Middle East and Africa, across online and in-store purchases. We size the value of BNPL transactions facilitated by providers and converted to USD using consistent currency timing.
Scope exclusions: We exclude B2B pay-later products, classic credit card installment plans, and informal IOU or lending apps that are not run as BNPL at checkout.
Segmentation Overview
- By Channel
- Online
- Point-of-Sale (In-store)
- By End-Use Industry
- Consumer Electronics
- Fashion & Apparel
- Healthcare & Wellness
- Home Improvement
- Travel & Leisure
- Media & Entertainment
- Other End-Use Industries
- By Age Group
- Generation Z (18-28 Years)
- Millennials (29-44 Years)
- Generation X (45-60 Years)
- Baby Boomers (61-79 Years)
- Silent Generation (80 Years and Above)
- By Provider
- Fintechs
- Banks
- Others
- By Country
- United Arab Emirates
- Saudi Arabia
- Qatar
- Kuwait
- Oman
- Bahrain
- Egypt
- South Africa
- Nigeria
- Rest of Middle East and Africa
Data Sources, Market Sizing, and Validation
Desk Research
Desk research was used to set the facts that anchor the model, especially the digital payments context in MEA and the pace of e-commerce adoption. Public sources such as central bank payment statistics, national telecom and ICT indicators, the World Bank, IMF, and UN Comtrade helped us frame country level demand signals and currency and inflation context before assumptions were applied.
We also reviewed company annual reports, investor decks, press releases, and reputable press coverage to understand rollouts, merchant coverage, and typical installment structures. For cross-checking, we used paid subscriptions for company financials and intelligence, news and financials, and patent databases where relevant, since these help confirm timelines and product focus. These examples are not exhaustive, and many other sources were also used for data collection, validation, and clarification during the work.
Primary Interviews and Surveys
Primary work focused on validating what drives BNPL usage in MEA at checkout, including conversion lift, average ticket sizes, approval rates, and plan usage frequency by online versus in-store shopping. We spoke with a mix of BNPL operators, payment ecosystem participants, merchants, and informed observers across APAC-linked corridors and the MEA region to fill gaps that secondary sources do not show clearly.
Distribution of primary research fieldwork respondents
| Company type | Respondent position | Region |
|---|---|---|
| Top tier: 35% | CXOs: 12% | |
| Mid tier: 44% | Functional/Unit leaders: 36% | |
| Smaller Players: 21% | Managers: 52% |
Market-Sizing & Forecasting
The core sizing starts with a top-down build where payments and e-commerce indicators are used to reconstruct the BNPL demand pool by country and then roll it up to MEA. Once that structure is set, we corroborate totals with selective bottom-up checks, like sampled BNPL GMV ranges from public disclosures, merchant channel checks, and ASP times volume logic for typical ticket sizes and usage frequency.
Key inputs used in the model include online retail growth and share of digital payments, average order values in relevant merchant categories, BNPL approval and utilization rates, installment plan mix and tenors, and observed take rate or fee structures where they are disclosed. Since some of these variables are not consistently published for every market, missing points are handled through peer market analogs and then adjusted after interviews, especially for cash-heavy countries where adoption patterns differ.
For forecasting, scenario analysis is applied to reflect different adoption paths under changing regulation, credit access, and merchant partnerships, and then smoothed using trend fitting on the most stable indicators. Where the inputs diverge by country, the forecast is built bottom-up at the country level and then aggregated, so the final regional curve is not driven by one large market alone.
Data Validation & Update Cycle
Outputs are validated through multiple checks, where modeled BNPL totals are compared against independent signals like digital commerce growth, consumer credit trends, and provider expansion timing. When a country level result looks too high or too low, the team reviews assumptions and re-contacts sources if the gap is linked to approval rates, ticket size shifts, or a regulatory change.
Before sign-off, the full model is reviewed in steps by another analyst to confirm arithmetic integrity, scope alignment, and currency handling, and then a final pass is completed close to delivery so the latest events are reflected. Reports are refreshed annually, and interim updates are made when major market events materially affect adoption or fee structures.
Mordor Intelligence's Middle East and Africa Buy Now Pay Later Services Market Size Compared Against Other Published Estimates
Published numbers for MEA BNPL often vary because the underlying yardstick is not the same, even when the topic name looks identical. Differences usually come from what gets counted as BNPL, which countries are included, and whether the figures reflect transaction value, provider revenue, or a mixed definition.
The main gap comes from mixing B2B pay-later tools and credit card installment plans into the same bucket, where Mordor Intelligence counts only consumer BNPL at checkout across online and point-of-sale payments in MEA and excludes those adjacent products. Another frequent driver is timing and currency, since some estimates apply one exchange rate for multiple years or assume aggressive adoption in underbanked markets without checking approval and utilization patterns through interviews.
Benchmark comparison
| Source | Market Size | Gaps in Research Methodology |
|---|---|---|
| Mordor Intelligence | USD 24.93 B (2025) | |
| Trade Journal A | USD 2.70 B (2025) | Uses a narrower definition that appears closer to provider revenues or a limited geography set, which can understate the full consumer BNPL transaction value across MEA. |
| Regional Consultancy B | USD 12.12 B (2023) | Covers Middle East only and references a different base year, and it may blend online-first BNPL with broader installment behaviors, making direct comparison to an MEA checkout-based model difficult. |
Looking across the table, the spread is mostly explained by scope and measurement choice, rather than simple math differences. When we keep the definition tied to consumer checkout usage, apply consistent currency timing, and pressure-test adoption inputs with field feedback, the final value becomes easier to trace and repeat for planning.


Key Questions Answered in the Report
What is the current size of the Middle East and Africa BNPL market and how fast is it growing?
The market stands at USD 29.28 billion in 2026 and is projected to reach USD 65.39 billion by 2031, reflecting a 17.45% CAGR.
Which sales channel holds the largest share in the regional BNPL market?
Online transactions account for 78.12% of market share in 2025, driven by seamless e-commerce checkout integration.
Which end-use industry is expanding the fastest with BNPL?
Healthcare and wellness posts the highest forecast growth at a 21.22% CAGR between 2026-2031 as consumers finance essential medical services.
Which country shows the strongest BNPL growth outlook?
Nigeria leads with a projected 19.15% CAGR through 2031, supported by smartphone adoption and open-banking rules.
Who are the dominant BNPL providers in the region today?
Fintechs such as Tabby, Tamara, and valU together held 71.10% market share in 2025, though banks are gaining ground at a 18.95% CAGR.
How are new regulations in Saudi Arabia and the UAE affecting the BNPL landscape?
Licensing frameworks from SAMA and CBUAE formalize consumer safeguards and capital standards, boosting investor confidence while raising compliance costs for smaller entrants.
Page last updated on:






