Market Overview
| Study Period | 2017 - 2030 |
|---|---|
| Base Year For Estimation | 2024 |
| Forecast Data Period | 2025 - 2030 |
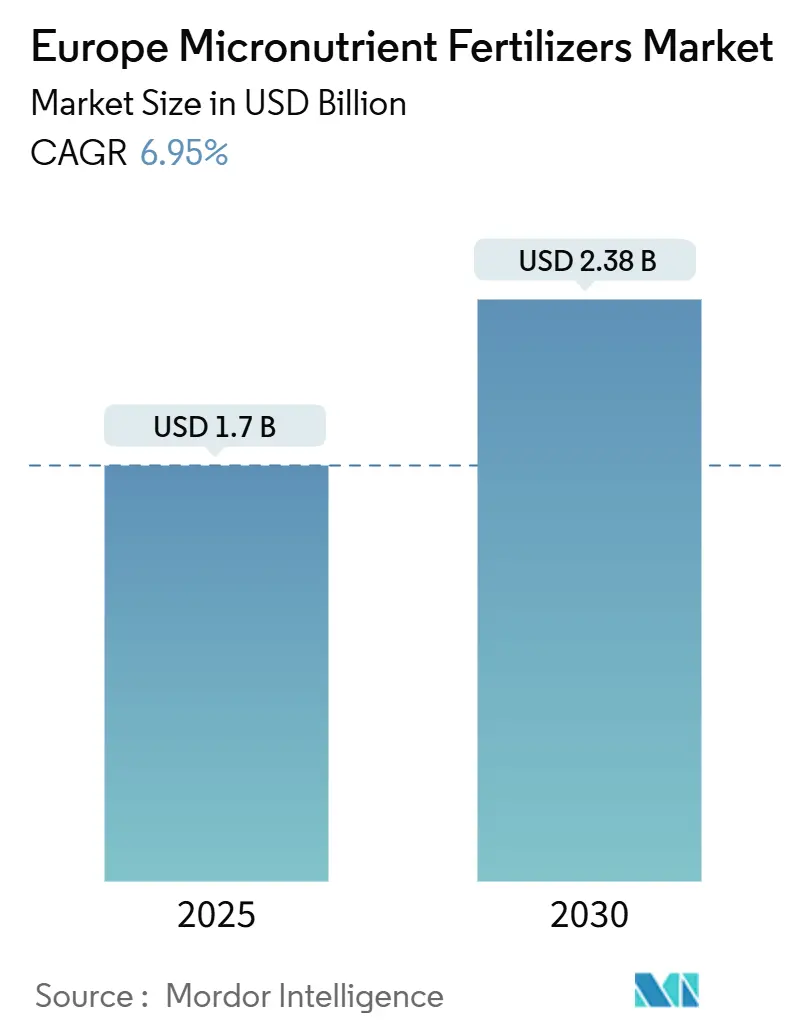
| Market Size (2025) | USD 1.7 Billion |
| Market Size (2030) | USD 2.38 Billion |
| Growth Rate (2025 - 2030) | 6.95% CAGR |
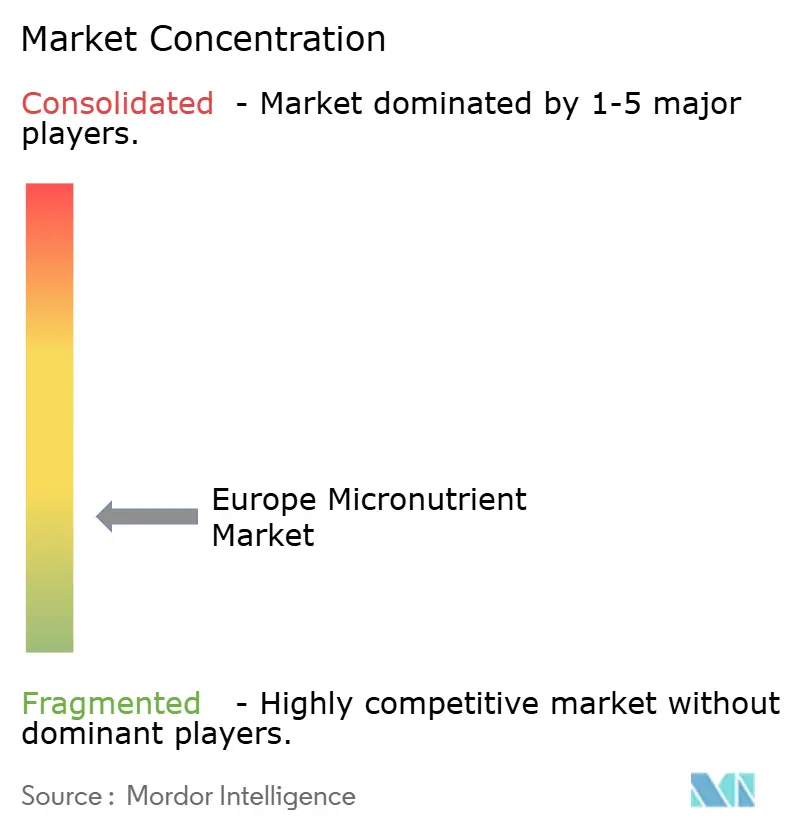
| Market Concentration | Low |
Major Players*Disclaimer: Major Players sorted in no particular order Image © Mordor Intelligence. Reuse requires attribution under CC BY 4.0. |
|
Europe Micronutrient Fertilizers Market Analysis by Mordor Intelligence
The Europe micronutrient fertilizers market size reached USD 1.70 billion in 2025 and is forecast to attain USD 2.38 billion in 2030, reflecting a 6.95% CAGR during 2025-2030. Precision agriculture adoption, Common Agricultural Policy (CAP) eco-scheme payments, and the expansion of high-value horticulture crops together underpin this steady rise in demand for balanced micronutrient programs. Expanded soil-micronutrient mapping, rapid growth in chelated liquid formulations, and digital agronomic platforms from Yara and BASF have simplified decision-making for growers, accelerating product uptake. Meanwhile, greenhouse vegetable exporters in the Netherlands and Spain are favoring premium blends that ensure strict quality standards, reinforcing a steady shift from commodity sulfates to specialized chelates. Ongoing raw-material price swings and heavy-metal limits drive product innovation toward cleaner supply chains and controlled-release technologies[1]Source: European Commission, “CAP Strategic Plans,” EC.EUROPA.EU.
Key Report Takeaways
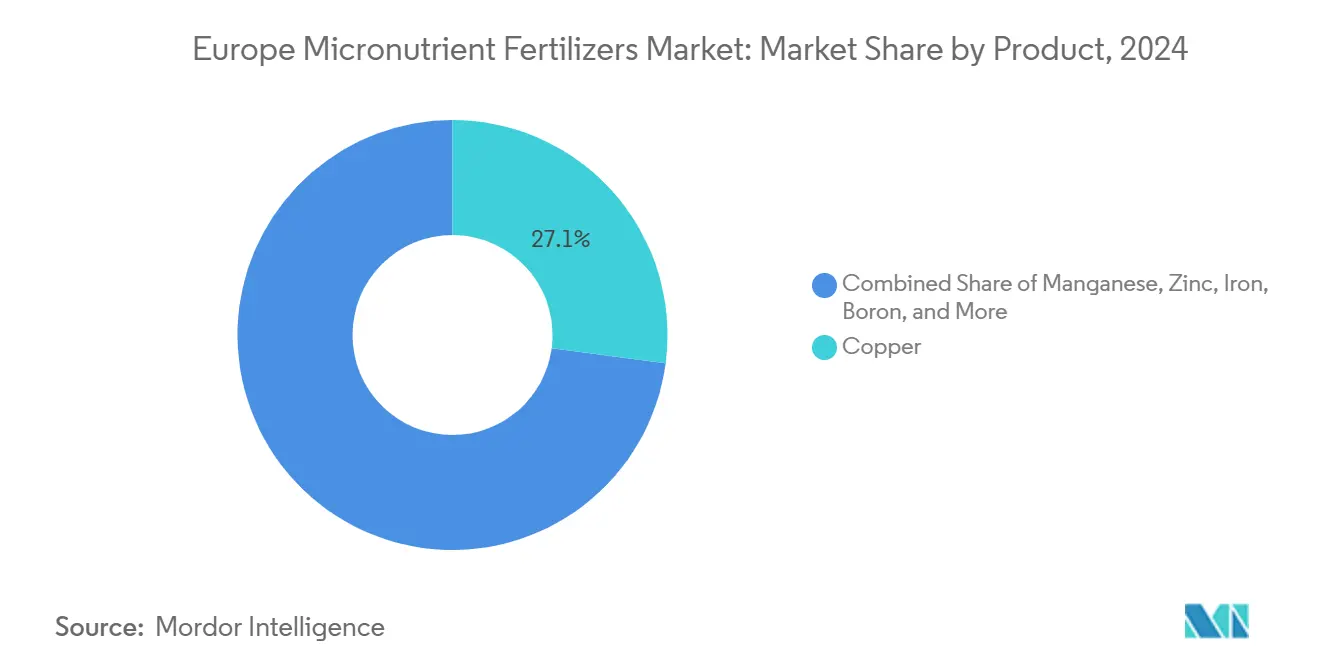
- By product category, copper led with 27.1% of Europe micronutrient fertilizers market share in 2024, while manganese is forecast to advance at a 7.9% CAGR through 2030.
- By application mode, soil applications held 63.0% of the Europe micronutrient fertilizers market size in 2024, while fertigation is projected to expand at a 7.4% CAGR.
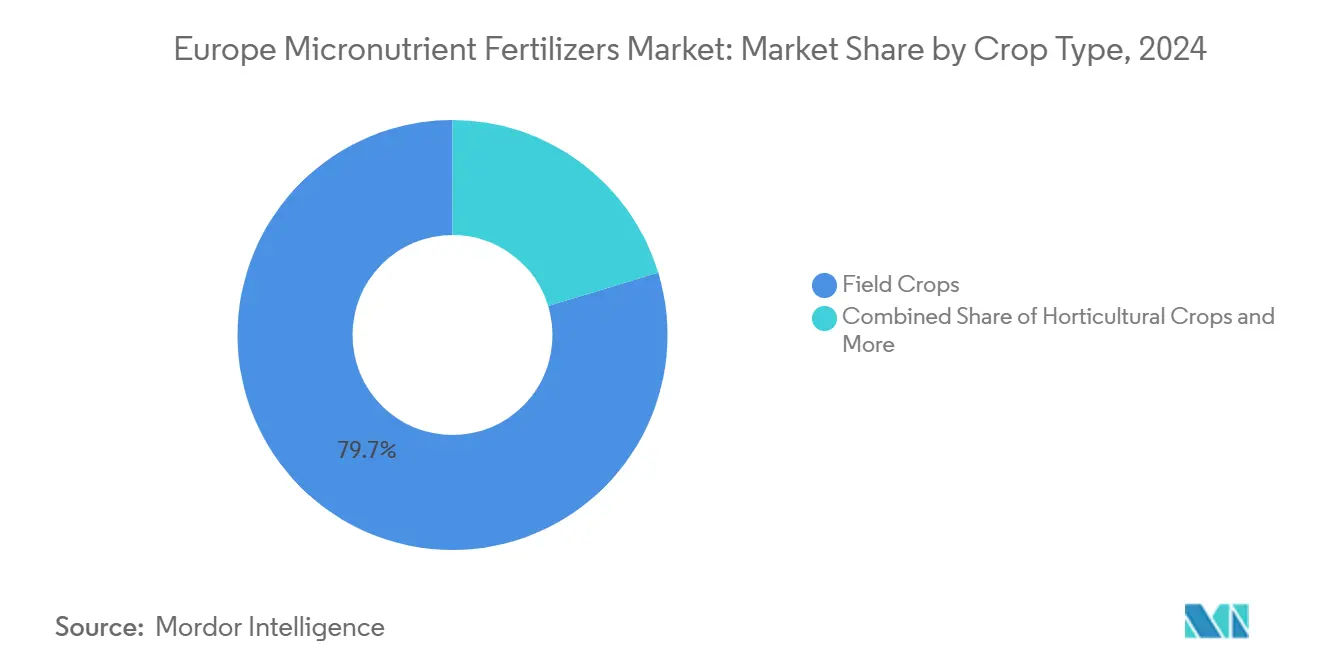
- By crop type, field crops captured an 84.8% share of Europe micronutrient fertilizers market in 2024, whereas horticultural crops applications are growing at a 7.4% CAGR.
- By geography, France accounted for a 14.8% share of the Europe micronutrient fertilizers market in 2024, while Italy is projected to expand at an 8.7% CAGR through 2030.
Europe Micronutrient Fertilizers Market Trends and Insights
Drivers Impact Analysis
| Driver | (~) % Impact on CAGR Forecast | Geographic Relevance | Impact Timeline |
|---|---|---|---|
| Precision-agriculture led soil micronutrient mapping | +1.2% | Netherlands, Germany, and broader European Union | Medium term (2-4 years) |
| European Union Common Agricultural Policy eco-scheme incentives | +1.0% | European Union member states | Short term (≤ 2 years) |
| Rising demand for high-value horticulture crops | +0.9% | Mediterranean basin and Dutch greenhouse belt | Medium term (2-4 years) |
| Shift toward chelated liquid and water-soluble formulations | +0.8% | Western Europe and expanding East | Long term (≥ 4 years) |
| Digital agronomic advisory platforms boosting adoption | +0.7% | Germany, France, and the United Kingdom | Medium term (2-4 years) |
| Post-Brexit fast-track micronutrient registrations in the United Kingdom | +0.4% | United Kingdom | Short term (≤ 2 years) |
| Source: Mordor Intelligence | |||
Precision-Agriculture Led Soil Micronutrient Mapping
Large European farms now operate GPS-guided sampling rigs that generate granular soil maps identifying pockets of zinc, iron, and manganese shortages long masked by blanket fertilization practices[2]Source: European Space Agency, “Copernicus Programme,” ESA.INT. Copernicus imagery adds seasonal moisture and vegetation indices, allowing agronomists to cross-check remote signals with physical samples. German equipment makers have commercialized spreaders that vary micronutrient rates every few meters, trimming over-application by up to 18% in pilot projects. As fields become data-rich, growers turn to chelated blends that stay available in alkaline zones and match prescription maps for each grid. Input distributors report that variable-rate programs convert into repeat orders because deficiencies re-emerge whenever farmers revert to uniform broadcasting. The technology therefore embeds micronutrients into precision-farming playbooks and pushes overall usage higher across the Europe micronutrient fertilizers market.
European Union Common Agricultural Policy Eco-Scheme Incentives
The 2023-2027 CAP earmarks EUR 48 billion (USD 52 billion) for eco-payments that reward documented nutrient-management plans, including micronutrient balance sheets[3]Source: International Fertilizer Association, “Technical Publications,” FERTILIZER.ORG. France and Germany reimburse growers EUR 60-80 per hectare (USD 65-87 per hectare) once soil-test data and application logs show optimum trace-element levels. These funds help small and medium-sized farms absorb the cost of laboratory tests, mobile sensors, and variable-rate controllers. Veterinary health agencies also back balanced fertilization because copper, zinc, and selenium deficiencies in forage crops can weaken livestock immunity. By bundling environmental compliance with farm-level productivity gains, the policy converts what was a voluntary practice into a mainstream agronomic obligation. Consequently, micronutrient suppliers see stable forward demand that is decoupled from commodity-price swings and better aligned with multi-year Common Agricultural Policy (CAP) budgets.
Rising Demand for High-Value Horticulture Crops
Mediterranean and Northern European greenhouse operators have increased tomato, pepper, and cucumber production by 15% since 2022, as retailers seek year-round supply and uniform appearance. These crops exhibit visible quality defects when trace elements fall below threshold levels, prompting growers to maintain tight nutrient monitoring. Field trials in Almería, Spain, have shown that iron and zinc chelates applied via fertigation increase tomato firmness scores by two market grades and extend shelf life by four days, key metrics for shipments to Middle Eastern buyers. Similar programs in Dutch cucumber houses utilize manganese to enhance photosynthetic efficiency under low winter light, enabling steady yields without the need for supplemental heat. Because horticulture revenues per hectare dwarf those of cereals, growers view micronutrient packages as minor cost items that drive premium pricing. This willingness to invest cascades through supply chains, spurring formulators to design crop-specific blends that capture price premiums and lift the overall Europe micronutrient fertilizers market value.
Shift Toward Chelated Liquid and Water-Soluble Formulations
Chelated micronutrients now represent a major share of sales, as sulfates struggle with fixation in high-pH and calcareous soils common across Southern Europe. Ethylenediaminetetraacetic Acid (EDTA), diethylenetriaminepentaacetic acid (DTPA), and Ethylenediamine-N, N'-bis (2-hydroxyphenylacetic) Acid (EDDHA) agents wrap metal ions in organic ligands, preventing precipitation and keeping nutrients mobile around roots. Spanish citrus orchards that transitioned to EDDHA iron cut leaf-chlorosis incidents by 70% and recouped costs within one harvest cycle through higher marketable yield. Dutch and German vegetable houses favor concentrated liquids because dosing pumps can inject micronutrients directly into drip lines without clogging emitters. Cropping-system flexibility also rises, the same drum feeds both foliar sprayers and soil dosing rigs, minimizing on-farm inventory. Regulatory pressure for heavy-metal compliance accelerates the trend, since chelate manufacturers can source higher-purity inputs and document contamination far more easily than bulk sulfate producers.
Restraints Impact Analysis
| Restraint | (~) % Impact on CAGR Forecast | Geographic Relevance | Impact Timeline |
|---|---|---|---|
| Metal-based raw material price volatility | -1.1% | Pan-Europe | Short term (≤ 2 years) |
| Stringent European Union limits on heavy-metal contaminants | -0.8% | European Union | Long term (≥ 4 years) |
| Bio-fortification policies reducing external application | -0.5% | Germany, the Netherlands, and France | Long term (≥ 4 years) |
| Competition from biological inoculants and biofertilizers | -0.6% | Organic farming hubs | Medium term (2-4 years) |
| Source: Mordor Intelligence | |||
Metal-Based Raw-Material Price Volatility
Between January 2024 and September 2025, zinc oxide prices increased by 45%, while copper sulfate prices fluctuated by 20-30% per quarter, reflecting a tight mining supply and surging galvanizing demand. Fertilizer plants cannot hedge metals as easily as energy inputs because contract volumes are smaller and purity specs stricter, so spot market buying often drives finished-product quotes. Distributors facing unpredictable costs cut inventory and pass price spikes directly to growers, who may postpone non-essential micronutrient purchases. Some manufacturers negotiate multi-year offtake deals with smelters or turn to recycled metals, yet alloy by-product streams rarely meet agricultural purity thresholds. When commodity prices retrace, those producers stuck with high-cost stock must discount aggressively, eroding margins. Persistent volatility, therefore, adds a risk premium to retail prices and caps growth during short economic downturns across the Europe micronutrient fertilizers market.
Stringent European Union Limits on Heavy-Metal Contaminants
Regulation 2019/1009 sets cadmium ceilings at 1.5 mg/kg and similarly strict thresholds for lead, mercury, and arsenic, requiring every production batch to be tested through certified labs that charge EUR 500-700 (USD 540-760) per panel. Small formulators struggle to amortize these expenses over limited volumes and either exit the market or seek toll-manufacturing partners with in-house analytical capability. Upstream suppliers must certify ore sources, prompting miners to open new seams or invest in advanced refining, which ultimately drives costs into product pricing. Retailers risk fines or criminal liability if contamination is discovered, so they prefer brands with transparent chain-of-custody records, which can crowd out newcomers. While standards protect soil health, they inadvertently slow the rollout of innovative formulations that cannot yet guarantee sub-ppm purity at scale. Over time, the rule drives consolidation and raises barriers, restraining the overall Europe micronutrient fertilizers market expansion.
Segment Analysis
By Product: Copper Retains Lead While Manganese Races Ahead
Copper accounted for 27.1% of Europe micronutrient fertilizers market size, reflecting its role in enzyme activation and disease suppression. Copper demand grows at a significant rate as cereal and potato producers combat rising fungal pressure linked to wetter growing seasons. Zinc follows at a significant share, critical in maize and soybean fields across Central and Eastern Europe, where alkaline soils hinder availability.
Manganese is projected to exhibit a market-leading 7.9% CAGR through 2030, as breeders release high-yield cultivars with increased photosynthetic demands. Iron maintains a major share, anchored by Mediterranean citrus orchards battling calcareous soils, while niche trace elements such as molybdenum and boron record sturdy growth tied to specialty crops. Product innovators increasingly bundle multiple chelated nutrients to simplify application routines and to secure incremental value in the Europe micronutrient fertilizers market.
Note: Segment shares of all individual segments available upon report purchase
Get Detailed Market Forecasts at the Most Granular Levels
Download PDF
By Application Mode: Soil Broadcast Dominates as Fertigation Accelerates
Soil broadcasting captured 84.8% of Europe micronutrient fertilizers market share in 2024 because it pairs with existing spreaders and minimal labor, suiting broad-acre cereals in France, Germany, and Poland. Variable-rate systems now overlay precise prescription maps, boosting input efficiency without altering equipment fleets. Foliar sprays hold a significant share as horticulture operators prefer rapid leaf uptake to rescue plants mid-season.
Fertigation posts the segment’s fastest 7.4% CAGR. Dutch greenhouses, where 85% of operations run closed-loop drip systems, illustrate fertigation’s ability to couple micronutrients with climate-control software for real-time dosing. Water-quality regulations that curb runoff further incentivize fertigation across the Europe micronutrient fertilizers market.
By Crop Type: Field Crops Command Volume; Turf and Ornamental Outpace
Field crops accounted for 79.7% of sales in 2024, corresponding to approximately 4 million hectares under regular micronutrient programs. Extension surveys indicate that zinc and manganese deficiencies can reduce yields by 10-15% if untreated, prompting cereal growers to adopt soil tests and targeted inputs. Horticultural crops register the highest 7.4% CAGR, propelled by greenhouse vegetables that demand consistent nutrient delivery and stringent residue control.
Turf and ornamental plantings, underpinned by new golf courses in Eastern Europe and municipal greenscaping budgets. Professional turf managers apply chelated iron for aesthetic purposes, manganese for disease control, and zinc for robust root development, often at rates exceeding those used in food crops. Rising tourism and real-estate projects will extend this premium niche within the Europe micronutrient fertilizers market.
Note: Segment shares of all individual segments available upon report purchase
Get Detailed Market Forecasts at the Most Granular Levels
Download PDF
Geography Analysis
France led the Europe micronutrient fertilizer market with a 14.8% share in 2024, driven by CAP eco-scheme funds and one of Europe’s most advanced precision agriculture infrastructures. The adoption of GPS-guided applicators and comprehensive soil testing is anticipated to drive significant growth in the nation through 2030. Germany follows with a major share and a prominent CAGR, farmers there top the continent in per-hectare micronutrient spend due to rigorous environmental compliance and strong machinery uptake.
Italy thrives on Mediterranean horticulture and viticulture that rely on chelated iron and boron to counteract calcareous soils, advancing at an 8.7% CAGR. The Netherlands, despite its limited landmass, holds a prominent share because greenhouse exporters employ high-frequency fertigation, which places the Europe micronutrient fertilizer market at the heart of global controlled-environment agriculture. Spain and the United Kingdom, owing to their Spanish citrus and olive estates, prioritize iron chelates, while the UK leverages faster product registration to test novel formulations.
Eastern regions, including Poland, Romania, Russia, and Ukraine, collectively offer double-digit growth potential as large acreage transitions to soil mapping and balanced nutrition. National modernization programs provide subsidies for spreaders and sensors, amplifying future demand across the Europe micronutrient fertilizer market.
Competitive Landscape
The Europe micronutrient fertilizers market remains highly fragmented, with the top five suppliers controlling a significant share. Yara International ASA leads at a prominent share, supported by its Atfarm digital ecosystem and recent USD 49 million expansion of chelated capacity in Rostock, Germany. Compo Expert GmbH (Grupa Azoty S.A.) holds a major share, leveraging its Central European footprint and mobile soil-testing services to deepen customer intimacy. BASF SE, ICL Group, and Haifa Chemicals Ltd. (Haifa Group) round out the leading tier with specialized water-soluble and controlled-release offerings.
Strategic moves favor digital agronomy, controlled-release coatings, and low-impurity supply chains. Patent filings for polymer-encapsulated micronutrients grew 40% from 2023 to 2025, signaling a race to prolong nutrient availability while lowering labor costs. Large players also use vertical integration and multi-year mining contracts to shield against raw-material volatility, whereas smaller firms increasingly partner with biological-inoculant developers to expand portfolios.
Regulation 2019/1009 acts as both a gatekeeper and a consolidation driver, granting scale players an advantage in testing laboratories and documentation capabilities. The Europe micronutrient fertilizers market, therefore, offers ample room for mergers that combine formulation know-how with digital agronomy reach.
Europe Micronutrient Fertilizers Industry Leaders
-
Grupa Azoty S.A. (Compo Expert)
-
Kingenta Ecological Engineering Group Co., Ltd.
-
Sociedad Quimica y Minera de Chile SA
-
Trade Corporation International
-
Yara International ASA
- *Disclaimer: Major Players sorted in no particular order
Need More Details on Market Players and Competitors?
Download PDF
Recent Industry Developments
- January 2025: Yara International ASA invested EUR 45 million (USD 49 million) to enlarge its chelated micronutrient plant in Rostock, Germany, adding 25,000 metric tons of annual capacity. The expansion enhances regional supply security, enabling growers to access low-contaminant chelated products during peak demand periods.
- December 2024: BASF SE acquired Compass Minerals’ Wolf Trax assets for USD 180 million, securing controlled-release coating technology. The deal accelerates the rollout of longer-lasting formulations in Europe, giving farmers more flexible application windows and reducing labor costs.
- November 2024: ICL Group launched a Polysulfate-Based blend containing chelated iron and zinc for broad-acre field crops worldwide, including those in Europe. The new product broadens nutrient packages for cereals and oilseeds, supporting balanced fertilization goals under the Common Agricultural Policy.
Europe Micronutrient Fertilizers Market Report Scope
Micronutrient fertilizers are fertilizers that provide essential nutrients in very small amounts to prevent deficiencies and improve plant growth, yield, and quality. The Europe micronutrient fertilizers market report is segmented by product type, including Boron, Copper, Iron, Manganese, Molybdenum, Zinc, and other micronutrients; by application mode, including fertigation, foliar, and soil; by crop type, including field crops, horticultural crops, and turf and ornamental; and by geography, covering France, Germany, Italy, Netherlands, Russia, Spain, Ukraine, the United Kingdom, and the rest of Europe. The market forecasts are provided in terms of value in USD and volume in metric tons.
Product
| Boron |
| Copper |
| Iron |
| Manganese |
| Molybdenum |
| Zinc |
| Others |
Application Mode
| Fertigation |
| Foliar |
| Soil |
Crop Type
| Field Crops |
| Horticultural Crops |
| Turf and Ornamental |
By Geography
| France |
| Germany |
| Italy |
| Netherlands |
| Russia |
| Spain |
| Ukraine |
| United Kingdom |
| Rest of Europe |
| Product | Boron |
| Copper | |
| Iron | |
| Manganese | |
| Molybdenum | |
| Zinc | |
| Others | |
| Application Mode | Fertigation |
| Foliar | |
| Soil | |
| Crop Type | Field Crops |
| Horticultural Crops | |
| Turf and Ornamental | |
| By Geography | France |
| Germany | |
| Italy | |
| Netherlands | |
| Russia | |
| Spain | |
| Ukraine | |
| United Kingdom | |
| Rest of Europe |
Need A Different Region or Segment?
Customize Now
Market Definition
- MARKET ESTIMATION LEVEL - Market Estimations for various types of fertilizers has been done at the product-level and not at the nutrient-level.
- NUTRIENT TYPES COVERED - Micronutients: Zn, Mn, Cu, Fe, Mo, B, and Others
- AVERAGE NUTRIENT APPLICATION RATE - This refers to the average volume of nutrient consumed per hectare of farmland in each country.
- CROP TYPES COVERED - Field Crops: Cereals, Pulses, Oilseeds, and Fiber Crops Horticulture: Fruits, Vegetables, Plantation Crops and Spices, Turf Grass and Ornamentals
| Keyword | Definition |
|---|---|
| Fertilizer | Chemical substance applied to crops to ensure nutritional requirements, available in various forms such as granules, powders, liquid, water soluble, etc. |
| Specialty Fertilizer | Used for enhanced efficiency and nutrient availability applied through soil, foliar, and fertigation. Includes CRF, SRF, liquid fertilizer, and water soluble fertilizers. |
| Controlled-Release Fertilizers (CRF) | Coated with materials such as polymer, polymer-sulfur, and other materials such as resins to ensure nutrient availability to the crop for its entire life cycle. |
| Slow-Release Fertilizers (SRF) | Coated with materials such as sulfur, neem, etc., to ensure nutrient availability to the crop for a longer period. |
| Foliar Fertilizers | Consist of both liquid and water soluble fertilizers applied through foliar application. |
| Water-Soluble Fertilizers | Available in various forms including liquid, powder, etc., used in foliar and fertigation mode of fertilizer application. |
| Fertigation | Fertilizers applied through different irrigation systems such as drip irrigation, micro irrigation, sprinkler irrigation, etc. |
| Anhydrous Ammonia | Used as fertilizer, directly injected into the soil, available in gaseous liquid form. |
| Single Super Phosphate (SSP) | Phosphorus fertilizer containing only phosphorus which has lesser than or equal to 35%. |
| Triple Super Phosphate (TSP) | Phosphorus fertilizer containing only phosphorus greater than 35%. |
| Enhanced Efficiency Fertilizers | Fertilizers coated or treated with additional layers of various ingredients to make it more efficient compared to other fertilizers. |
| Conventional Fertilizer | Fertilizers applied to crops through traditional methods including broadcasting, row placement, ploughing soil placement, etc. |
| Chelated Micronutrients | Micronutrient fertilizers coated with chelating agents such as EDTA, EDDHA, DTPA, HEDTA, etc. |
| Liquid Fertilizers | Available in liquid form, majorly used for application of fertilizers to crops through foliar and fertigation. |
Need More Details on Market Definition?
Ask a Question
Research Methodology
Mordor Intelligence follows a four-step methodology in all our reports.
- Step-1: IDENTIFY KEY VARIABLES: In order to build a robust forecasting methodology, the variables and factors identified in Step-1 are tested against available historical market numbers. Through an iterative process, the variables required for market forecast are set and the model is built on the basis of these variables.
- Step-2: Build a Market Model: Market-size estimations for the forecast years are in nominal terms. Inflation is not a part of the pricing, and the average selling price (ASP) is kept constant throughout the forecast period for each country.
- Step-3: Validate and Finalize: In this important step, all market numbers, variables and analyst calls are validated through an extensive network of primary research experts from the market studied. The respondents are selected across levels and functions to generate a holistic picture of the market studied.
- Step-4: Research Outputs: Syndicated Reports, Custom Consulting Assignments, Databases & Subscription Platforms

Get More Details On Research Methodology
Download PDF


