| Study Period | 2017 - 2030 |
| Base Year For Estimation | 2024 |
| Forecast Data Period | 2025 - 2030 |
| Market Size (2025) | USD 5.94 Billion |
| Market Size (2030) | USD 8.25 Billion |
| CAGR (2025 - 2030) | 6.79 % |
| Market Concentration | Medium |
Major Players*Disclaimer: Major Players sorted in no particular order |

Micronutrient Fertilizer Market Analysis
The Micronutrient Fertilizer Market size is estimated at 5.94 billion USD in 2025, and is expected to reach 8.25 billion USD by 2030, growing at a CAGR of 6.79% during the forecast period (2025-2030).
The global agricultural landscape is experiencing significant transformation driven by declining soil health and changing nutrient profiles across major farming regions. Intensive farming practices and monoculture cultivation have led to severe micronutrient deficiencies in fertilizers in agricultural soils worldwide, particularly affecting zinc and iron availability. This is evidenced in major agricultural nations like China, where recent studies indicate that over 50% of arable soils are deficient in zinc, significantly impacting agricultural productivity and nutritional outcomes. The situation has prompted agricultural ministries worldwide to revise their fertilizer recommendations, with China's Ministry of Agriculture notably implementing new guidelines recommending 15-30 kg/ha of zinc sulfate application for summer crops like rice and corn.
The industry is witnessing a significant shift toward specialty micronutrient fertilizer formulations and advanced application technologies. Conventional fertilizers, while still dominant, are gradually giving way to specialty variants that offer enhanced nutrient bioavailability and targeted delivery systems. The emergence of chelated micronutrients and innovative coating technologies has revolutionized nutrient delivery efficiency, leading to reduced application rates while maintaining or improving crop yields. These technological advancements are particularly evident in the development of foliar applications and fertigation systems, which are gaining prominence for their precision and effectiveness.
Global trade dynamics and supply chain configurations in the agricultural micronutrients market are undergoing substantial reorganization. The Netherlands has emerged as a pivotal hub for micronutrient trade, demonstrating the importance of strategic distribution networks in meeting global demand. Major manufacturers are increasingly focusing on establishing regional production facilities and strengthening their distribution networks to ensure consistent supply and reduce logistics costs. This trend is particularly evident in Asia-Pacific, where well-established distribution networks have significantly contributed to market growth.
Environmental sustainability and regulatory compliance have become central themes shaping industry development. Agricultural authorities worldwide are implementing stricter regulations regarding fertilizer composition and application methods, emphasizing the need for environmentally responsible nutrient management practices. The industry is responding with innovations in biodegradable coatings and environmentally friendly formulations, while also focusing on improving nutrient use efficiency. This shift is particularly evident in developed markets, where precision farming techniques and smart fertilizer applications are being integrated with traditional farming practices to optimize nutrient delivery while minimizing environmental impact.
Global Micronutrient Fertilizer Market Trends
The rising pressure on the agriculture industry to meet the growing demand for food is expected to increase the area under field crop cultivation
- The global agricultural sector is currently facing many challenges. According to the UN, the world population may exceed 9 billion by 2050. This population growth may overburden the agricultural industry, which is already experiencing an output loss due to a lack of laborers and the shrinkage of agricultural fields caused by rising urbanization. According to the Food and Agriculture Organization, 70% of the global population is expected to live in cities by 2050. Due to the global loss of arable land, farmers now need to utilize more fertilizers to increase crop yields.
- The Asia-Pacific region is the world's largest producer of agricultural products. Agriculture is critical to the region's economy, as it employs about 20% of the total available workforce. Field crop cultivation dominates the region, accounting for about more than 95% of the total crop area in the region. Rice, wheat, and corn are the major field crops produced in the region, together accounting for about 24.3% of the total crop area in 2022.
- North America ranks as the second-largest arable region globally. Its farms cultivate a diverse range of crops, with a focus on field crops. Notably, corn, cotton, rice, soybean, and wheat are the prominent field crops, as highlighted by the USDA. In 2022, the United States commanded 46.2% of North America's crop cultivation area. However, the country witnessed a significant drop in crop acreage between 2017 and 2019, primarily due to adverse environmental conditions, leading to severe flooding in regions like Texas and Houston.

Understand The Key Trends Shaping This Market
Download PDF
The Asia-Pacific region accounted for the highest average micronutrient application rate of 5.20 kg/hectare
- Due to high rates of nutrient loss from high-yielding crops, the demand for micronutrients has risen significantly. Micronutrient deficiency is a problem that affects almost all regions across the world. Globally, the average micronutrient application in field crops was 3.92 kg/hectare in 2022. Accordingly, manganese, zinc, and copper were estimated to be major nutrients with higher application rates in field crops in 2022, accounting for 9.53 kg/ha, 6.63 kg/ha, and 6.34 kg/ha, respectively.
- Rapeseed/canola led the pack with the highest average micronutrient application of 5.20 kg/ha in 2022, followed by rice and sorghum at 4.42 kg/ha and 4.37 kg/ha, respectively. Different crops and regions respond differently to micronutrients. For example, copper and manganese deficiencies are common in wheat, while boron deficiency is observed in wheat, and molybdenum is lacking in the Asia-Pacific region. In rapeseed/canola, zinc, manganese, and copper are the primary deficiencies.
- In 2022, Asia-Pacific had the highest average micronutrient application rate of 5.20 kg/ha, followed by South America with 4.37 kg/ha and North America with 4.21kg/ha. Micronutrient use in crop production has increased significantly in recent years as farmers strive to increase yield per planted hectare. To improve soil health and crop productivity and satisfy a growing population, crop yields must increase to meet food production demands. As a result, the global demand for micronutrient fertilizers and agricultural production is experiencing the most significant rise.

OTHER KEY INDUSTRY TRENDS COVERED IN THE REPORT
- The growing demand for fruits and vegetables drives the expansion of horticulture crop cultivation
- Asia-Pacific occupies the majority of the irrigation area globally, accounting for 66.8% in 2022
- Micronutrient deficiency in vegetable crops can have several detrimental effects.
Segment Analysis: Product
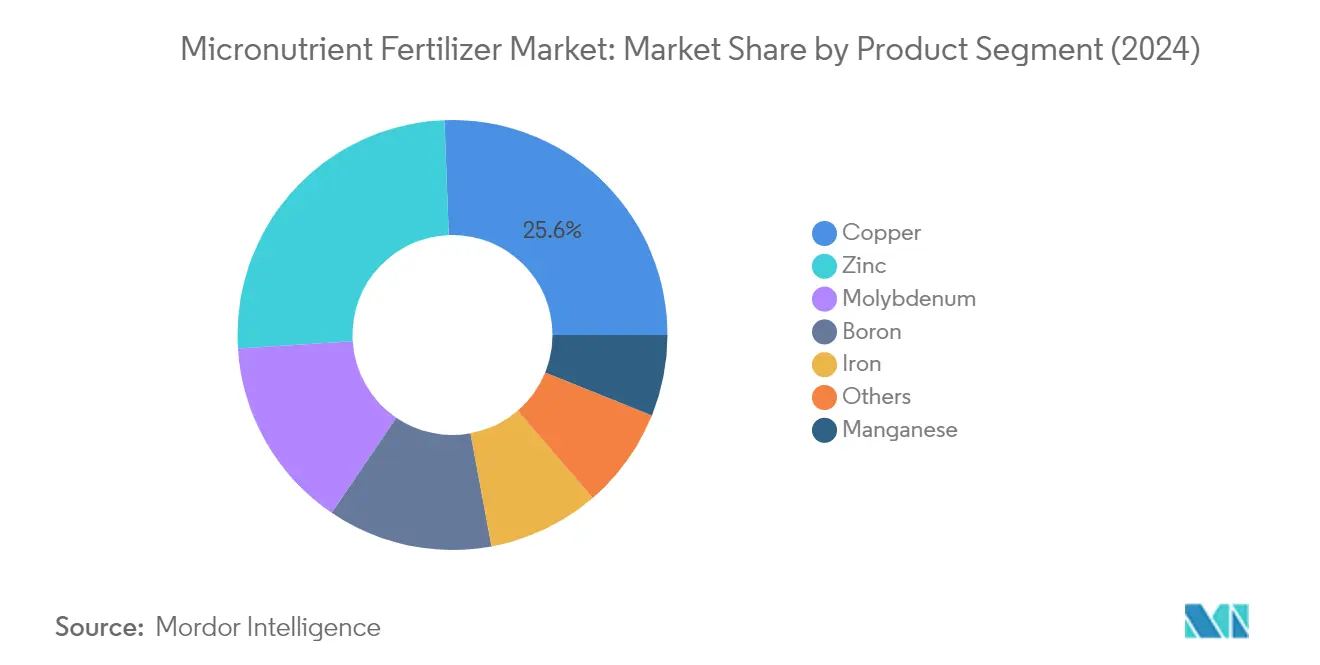
Copper Segment in Micronutrient Fertilizer Market
The copper segment dominates the global micronutrient fertilizer market, accounting for approximately 26% market share in 2024. Copper plays a vital role in various plant processes, including respiration and the metabolism of carbohydrates and proteins. Conventional copper fertilizers account for about 90% of the segment, while specialty copper fertilizers make up the remaining 10%. The dominance of conventional copper fertilizers is attributed to their cost-effectiveness and wider availability compared to chelated copper sources. Field crops represent the largest application area for copper fertilizers, accounting for nearly 84% of copper consumption, demonstrating its crucial role in large-scale agriculture. The segment's strong position is further reinforced by copper's essential role in chlorophyll production and multiple enzyme processes.
Boron Segment in Micronutrient Fertilizer Market
The boron segment is projected to experience the fastest growth in the micronutrient fertilizer market, with an anticipated CAGR of approximately 8% during 2024-2029. This robust growth is driven by boron's critical role in developing plants' root systems during early growth stages and its function in activating enzymes that facilitate the uptake of other major nutrients like potassium. The increasing adoption of boron fertilizers is particularly notable in field crops, where it helps in improving crop quality and addressing deficiency issues. The segment's growth is further supported by the rising awareness among farmers about boron's importance in plant development, particularly in areas with acidic or sandy soils, or soils with pH ranges above 6.5 and below 5, where boron deficiencies are most common.
Remaining Segments in Product Segmentation
The other significant segments in the micronutrient fertilizer market include zinc, molybdenum, iron, manganese, and others, each serving distinct roles in plant nutrition and development. Zinc is crucial for enzyme systems and carbohydrate metabolism, while molybdenum is essential for nitrogen reduction and fixation processes. Iron plays a fundamental role in chlorophyll production and energy transfer, and manganese is vital for photosynthesis and enzyme activation. These segments collectively contribute to the market's diversity, offering solutions for various crop-specific nutritional requirements and soil conditions. The specialized nature of each micronutrient and its specific role in plant growth ensures sustained demand across different agricultural applications.
Segment Analysis: Application Mode
Soil Application Segment in Micronutrient Fertilizer Market
Soil application continues to dominate the global micronutrient fertilizer market, commanding approximately 88% of the total market value in 2024. This traditional method of application remains the most widely adopted approach due to its effectiveness and compatibility with conventional farming practices. The segment's prominence is largely attributed to its ability to improve soil fertility over the long term while allowing for bulk application alongside other macronutrients. Zinc is the most widely applied micronutrient through soil application, accounting for about 26% of soil-applied micronutrients, followed by other essential elements like copper and iron. The method's popularity is further reinforced by its cost-effectiveness and the ease of application for farmers, particularly when integrated with regular fertilization programs.
Fertigation Segment in Micronutrient Fertilizer Market
The fertigation segment is emerging as the most dynamic growth sector in the micronutrient fertilizer market, projected to expand at approximately 7% CAGR from 2024 to 2029. This innovative application method, which combines irrigation with fertilizer application, is gaining traction due to its superior efficiency in nutrient delivery and water conservation benefits. The growing adoption of precision farming techniques and modern irrigation systems is driving the segment's growth, particularly in regions with water scarcity concerns. Fertigation's ability to provide essential nutrients directly to the active root zone while minimizing nutrient losses has made it increasingly attractive to commercial farmers and greenhouse operators seeking to optimize their nutrient management practices.
Remaining Segments in Application Mode
The foliar application method represents another significant segment in the micronutrient fertilizer market, offering unique advantages in addressing immediate nutrient deficiencies. This method involves direct application to plant leaves, allowing for rapid nutrient absorption and quick correction of deficiencies during critical growth stages. Foliar application is particularly valuable in situations where soil conditions might limit nutrient uptake or when immediate intervention is required. The method has gained popularity among high-value crop producers and in intensive farming systems where precise nutrient management is crucial for optimal yield and quality outcomes.
Segment Analysis: Crop Type
Field Crops Segment in Micronutrient Fertilizer Market
Field crops represent the dominant segment in the global micronutrient fertilizer market, accounting for approximately 84% of the total market value in 2024. This substantial market share is primarily attributed to the extensive cultivation area dedicated to field crops worldwide and their higher nutrient requirements. The segment's dominance is particularly evident in major agricultural regions like Asia-Pacific and North America, where crops such as wheat, corn, rice, and soybeans require significant micronutrient supplementation. The need for high productivity and higher resistance to biotic and abiotic stresses of these crops has increased the demand for micronutrients in the field crop segment. Additionally, zinc and manganese are the most commonly applied micronutrients in field crops, as these crops show positive growth and quality responses when supplemented with these nutrients.
Horticultural Crops Segment in Micronutrient Fertilizer Market
The horticultural crops segment is emerging as the fastest-growing category in the micronutrient fertilizer market, projected to expand at approximately 7% CAGR from 2024 to 2029. This robust growth is driven by the increasing adoption of precision farming techniques and the rising demand for high-value horticultural products globally. Horticultural crops demonstrate higher responsiveness to micronutrient applications compared to field crops, making them ideal candidates for specialized micronutrient solutions. The segment's growth is further supported by the expanding greenhouse cultivation practices and the increasing focus on fruit and vegetable quality enhancement. Manganese, copper, and zinc are the primary micronutrients applied to horticultural crops, with liquid fertilizers dominating the specialty fertilizer market share due to their quick absorption and efficient nutrient delivery systems.
Remaining Segments in Crop Type
The turf and ornamental segment completes the market segmentation, serving specialized applications in golf courses, public lawns, and ornamental plant cultivation. This segment is characterized by its unique requirements for micronutrient applications, particularly in maintaining aesthetic appeal and plant health. The segment's growth is closely tied to urbanization trends and the expansion of the tourism sector, which drives demand for well-maintained turf areas and ornamental plantations. The application of micronutrients in this segment is typically more precise and controlled compared to other crop types, with a higher preference for specialty fertilizer formulations that can deliver targeted nutrition while maintaining the visual appeal of turf and ornamental plants.
Micronutrient Fertilizer Market Geography Segment Analysis
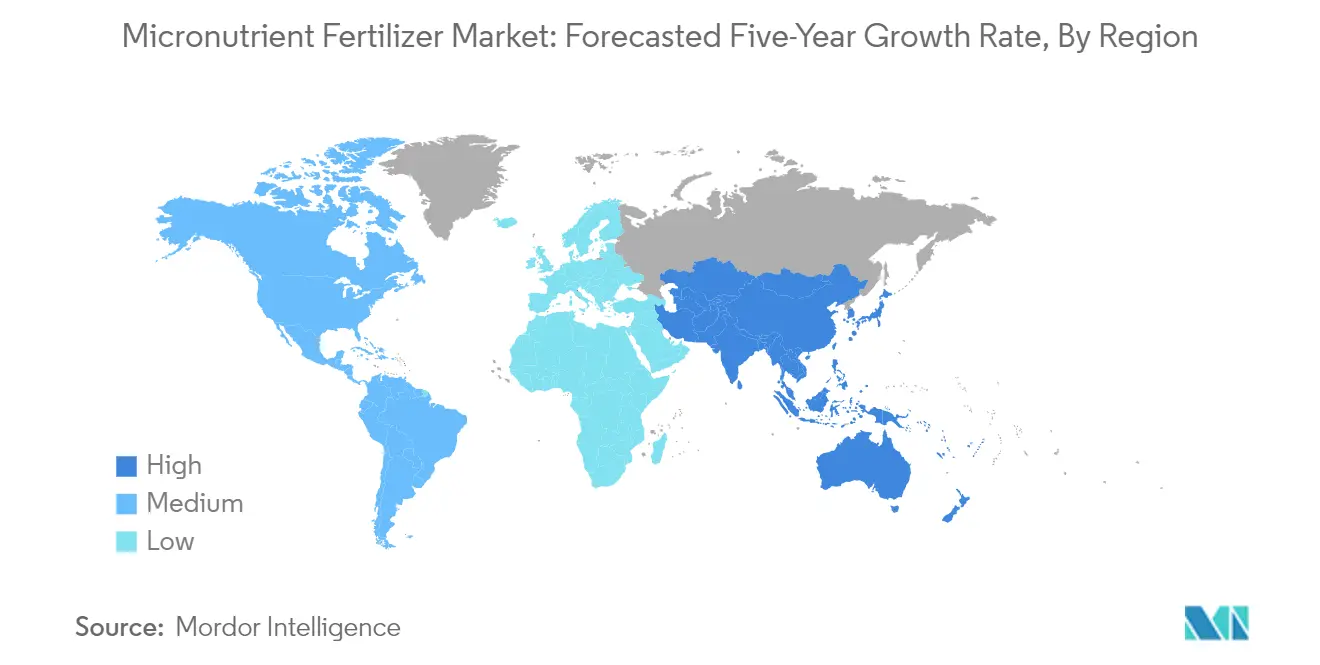
Micronutrient Fertilizer Market in Asia-Pacific
The Asia-Pacific region represents a dominant force in the micronutrient fertilizer market, driven by extensive agricultural activities and increasing awareness about soil nutrient deficiencies. Countries like China, India, Japan, and Australia are leading the adoption of micronutrient fertilizers, particularly in response to widespread zinc and iron deficiencies in agricultural soils. The region's agricultural sector is characterized by diverse farming practices, ranging from traditional to modern precision farming techniques, with a growing emphasis on sustainable agricultural practices and improved crop yields.
Micronutrient Fertilizer Market in China
China stands as the largest market for micronutrient fertilizers in the Asia-Pacific region, commanding approximately 40% of the regional market share in 2024. The country's agricultural sector faces significant challenges with soil nutrient deficiencies, particularly zinc deficiency, which affects nearly half of China's arable soils. The government has implemented various initiatives to address these deficiencies, including adding zinc to national fertilizer recommendations for summer crops like rice and corn. Chinese farmers are increasingly adopting precision farming techniques and sustainable agricultural practices, driving the demand for specialized micronutrient formulations.
Micronutrient Fertilizer Market in India
India emerges as the fastest-growing market in the Asia-Pacific region, with a projected growth rate of approximately 7% during 2024-2029. The country's agricultural sector is undergoing significant transformation with increasing adoption of modern farming practices and growing awareness about micronutrient deficiencies. The Centre for Science and Environment has identified widespread deficiencies in boron, iron, and zinc across Indian agricultural soils. The government's focus on sustainable agriculture and various initiatives to promote balanced crop nutrition are driving market growth, particularly in regions with intensive farming practices.
Micronutrient Fertilizer Market in Europe
Europe's micronutrient fertilizer market is characterized by advanced agricultural practices and a strong emphasis on sustainable farming methods. The region's market is driven by increasing awareness about soil health and the adoption of precision farming techniques. Countries like France, Germany, and the UK are leading the implementation of innovative micronutrient application methods, while Eastern European nations are showing growing interest in these specialized fertilizers to improve crop yields and quality.
Micronutrient Fertilizer Market in France
France dominates the European micronutrient fertilizer market, holding approximately 14% of the regional market share in 2024. The country's leadership position is supported by its advanced agricultural sector and strong focus on sustainable farming practices. French farmers are increasingly adopting precision agriculture techniques and showing growing awareness about the importance of micronutrient supplementation in crop production. The country's diverse agricultural landscape, ranging from extensive field crops to specialized horticultural production, drives the demand for various micronutrient formulations.
Micronutrient Fertilizer Market in Germany
Germany represents the fastest-growing market in Europe, with a projected growth rate of approximately 8% during 2024-2029. The country's agricultural sector is characterized by high technology adoption and a strong emphasis on sustainable farming practices. German farmers are increasingly embracing precision agriculture and specialized nutrient management strategies. The growing awareness about soil health and the importance of balanced crop nutrition continues to drive market expansion in the country.
Micronutrient Fertilizer Market in Middle East & Africa
The Middle East and Africa region presents a diverse landscape for micronutrient fertilizers, with varying agricultural practices and soil conditions across different countries. The market is characterized by growing awareness about soil nutrient deficiencies and increasing adoption of modern farming techniques. Countries across the region are focusing on improving agricultural productivity through better nutrient management practices.
Micronutrient Fertilizer Market in Turkey
Turkey leads the Middle East and Africa region in micronutrient fertilizer consumption, driven by its well-developed agricultural sector and diverse crop production. The country's agricultural landscape encompasses both traditional and modern farming practices, with a growing emphasis on precision agriculture and sustainable farming methods. Turkish farmers are increasingly recognizing the importance of micronutrient supplementation in improving crop yields and quality.
Micronutrient Fertilizer Market in South Africa
South Africa demonstrates the most dynamic growth in the region's micronutrient fertilizer market. The country's agricultural sector is undergoing significant transformation with increasing adoption of modern farming techniques and growing awareness about soil health. South African farmers are showing greater interest in balanced crop nutrition and sustainable agricultural practices, particularly in regions with intensive farming operations.
Micronutrient Fertilizer Market in North America
The North American micronutrient fertilizer market is characterized by advanced agricultural practices and high technology adoption rates. The region demonstrates strong awareness about soil health and nutrient management, with the United States leading the market as the largest consumer of micronutrient fertilizers. Mexico emerges as the fastest-growing market in the region, driven by expanding agricultural activities and increasing adoption of modern farming practices. The region's focus on precision agriculture and sustainable farming practices continues to drive innovation in micronutrient fertilizer applications.
Micronutrient Fertilizer Market in South America
South America's micronutrient fertilizer market is experiencing significant growth, driven by extensive agricultural activities and increasing awareness about soil nutrient deficiencies. Brazil emerges as the largest market in the region, while Argentina shows the fastest growth potential. The region's agricultural sector is characterized by large-scale farming operations and growing adoption of modern agricultural practices. Increasing focus on soil health and sustainable agriculture practices continues to drive the demand for micronutrient fertilizers across South American countries.
Get Analysis on Important Geographic Markets
Download PDF
Micronutrient Fertilizer Industry Overview
Top Companies in Micronutrient Fertilizer Market
Leading companies in the micronutrient fertilizer market are driving innovation through advanced formulation technologies and specialized product development. These organizations are focusing on creating enhanced delivery systems, including chelated compounds and slow-release formulations, to improve nutrient absorption efficiency. Strategic partnerships with agricultural technology firms and research institutions have become increasingly common to develop precision farming solutions and digital platforms for nutrient management. Companies are also expanding their geographical presence through acquisitions and distribution network enhancement, particularly in emerging markets with high agricultural potential. The industry has seen significant investment in production facilities and R&D centers to develop sustainable and environmentally friendly products, while simultaneously working on improving manufacturing processes to ensure consistent product quality and cost optimization. Among the world's top 10 micronutrient companies, several are noted for their innovative approaches and strategic expansions.
Market Structure Shows Balanced Competition Dynamic
The micronutrient fertilizer market exhibits a balanced competitive structure with both global conglomerates and specialized regional players maintaining significant market positions. Global agricultural input companies leverage their extensive distribution networks and comprehensive product portfolios, while regional specialists capitalize on their deep understanding of local soil conditions and crop requirements. The market demonstrates moderate consolidation, with larger players actively pursuing strategic acquisitions to strengthen their position in key agricultural regions and gain access to new technologies and formulation capabilities.
The competitive landscape is characterized by ongoing collaboration between manufacturers and agricultural research institutions to develop crop-specific solutions. Companies are increasingly focusing on vertical integration strategies to secure raw material supply and control quality throughout the value chain. The market has witnessed a trend of partnerships between traditional fertilizer manufacturers and agtech companies to develop innovative delivery mechanisms and application technologies. Regional players are gaining prominence through specialized product offerings and strong relationships with local farming communities, while global players are adapting their products to meet specific regional requirements. Notably, ICL Micronutrients has been a key player in fostering such collaborations.
Innovation and Sustainability Drive Future Success
Success in the micronutrient fertilizer market increasingly depends on companies' ability to develop sustainable and environmentally friendly products while maintaining effectiveness. Market leaders are investing in research to develop bio-based formulations and enhance nutrient use efficiency through advanced delivery systems. Companies are also focusing on building comprehensive solution packages that combine products with advisory services and digital tools for precision agriculture. The development of region-specific products that address local soil conditions and crop requirements has become crucial for market expansion.
Future growth opportunities lie in developing integrated nutrient management solutions and establishing strong partnerships with agricultural service providers. Companies need to focus on building robust distribution networks while investing in farmer education and technical support services. The ability to adapt to changing regulatory environments, particularly regarding environmental protection and product safety, will be crucial for long-term success. Market players must also address the growing demand for organic and sustainable farming solutions while maintaining cost competitiveness. Building strong relationships with key stakeholders across the agricultural value chain and investing in digital capabilities will be essential for maintaining competitive advantage in the evolving market landscape. Companies like Promine Fertilizer are at the forefront of this shift towards sustainability and innovation.
Micronutrient Fertilizer Market Leaders
-
Coromandel International Ltd.
-
ICL Group Ltd
-
K+S Aktiengesellschaft
-
The Mosaic Company
-
Yara International ASA
- *Disclaimer: Major Players sorted in no particular order

Need More Details on Market Players and Competitors?
Download PDF
Micronutrient Fertilizer Market News
- April 2023: K+S acquired a 75% share of the fertilizer business of a South African trading company, Industrial Commodities Holdings (Pty) Ltd (ICH). In addition to expanding the core business, K+S is strengthening its operations in southern and eastern Africa as a result of this acquisition. The newly acquired fertilizer business in the future is to be operated in a joint venture under the name of FertivPty Ltd.
- April 2023: ADOB, a major provider of chelating micronutrients, foliar, and other specialty farming solutions based in Poland, was acquired by Nouryon. Through the acquisition, the company broadened its innovative crop nutrition portfolio.
- May 2022: ICL launched three new NPK formulations of Solinure, a product with increased trace elements to optimize yields.
Free With This Report
Along with the report, We also offer a comprehensive and exhaustive data pack with 25+ graphs on area under cultivation and average application rate per hectare. The data pack includes Globe, North America, Europe, Asia-Pacific, South America, and Africa.


Micronutrient Fertilizer Market Report - Table of Contents
1. EXECUTIVE SUMMARY & KEY FINDINGS
2. REPORT OFFERS
3. INTRODUCTION
- 3.1 Study Assumptions & Market Definition
- 3.2 Scope of the Study
- 3.3 Research Methodology
4. KEY INDUSTRY TRENDS
-
4.1 Acreage Of Major Crop Types
- 4.1.1 Field Crops
- 4.1.2 Horticultural Crops
-
4.2 Average Nutrient Application Rates
- 4.2.1 Micronutrients
- 4.2.1.1 Field Crops
- 4.2.1.2 Horticultural Crops
- 4.3 Agricultural Land Equipped For Irrigation
- 4.4 Regulatory Framework
- 4.5 Value Chain & Distribution Channel Analysis
5. MARKET SEGMENTATION (includes market size in Value in USD and Volume, Forecasts up to 2030 and analysis of growth prospects)
-
5.1 Product
- 5.1.1 Boron
- 5.1.2 Copper
- 5.1.3 Iron
- 5.1.4 Manganese
- 5.1.5 Molybdenum
- 5.1.6 Zinc
- 5.1.7 Others
-
5.2 Application Mode
- 5.2.1 Fertigation
- 5.2.2 Foliar
- 5.2.3 Soil
-
5.3 Crop Type
- 5.3.1 Field Crops
- 5.3.2 Horticultural Crops
- 5.3.3 Turf & Ornamental
-
5.4 Region
- 5.4.1 Asia-Pacific
- 5.4.1.1 Australia
- 5.4.1.2 Bangladesh
- 5.4.1.3 China
- 5.4.1.4 India
- 5.4.1.5 Indonesia
- 5.4.1.6 Japan
- 5.4.1.7 Pakistan
- 5.4.1.8 Philippines
- 5.4.1.9 Thailand
- 5.4.1.10 Vietnam
- 5.4.1.11 Rest of Asia-Pacific
- 5.4.2 Europe
- 5.4.2.1 France
- 5.4.2.2 Germany
- 5.4.2.3 Italy
- 5.4.2.4 Netherlands
- 5.4.2.5 Russia
- 5.4.2.6 Spain
- 5.4.2.7 Ukraine
- 5.4.2.8 United Kingdom
- 5.4.2.9 Rest of Europe
- 5.4.3 Middle East & Africa
- 5.4.3.1 Nigeria
- 5.4.3.2 Saudi Arabia
- 5.4.3.3 South Africa
- 5.4.3.4 Turkey
- 5.4.3.5 Rest of Middle East & Africa
- 5.4.4 North America
- 5.4.4.1 Canada
- 5.4.4.2 Mexico
- 5.4.4.3 United States
- 5.4.4.4 Rest of North America
- 5.4.5 South America
- 5.4.5.1 Argentina
- 5.4.5.2 Brazil
- 5.4.5.3 Rest of South America
6. COMPETITIVE LANDSCAPE
- 6.1 Key Strategic Moves
- 6.2 Market Share Analysis
- 6.3 Company Landscape
-
6.4 Company Profiles
- 6.4.1 BMS Micro-Nutrients NV
- 6.4.2 Coromandel International Ltd.
- 6.4.3 Haifa Group
- 6.4.4 ICL Group Ltd
- 6.4.5 K+S Aktiengesellschaft
- 6.4.6 Koch Industries Inc.
- 6.4.7 Nouryon
- 6.4.8 The Mosaic Company
- 6.4.9 Yara International ASA
- *List Not Exhaustive
7. KEY STRATEGIC QUESTIONS FOR FERTILIZER CEOS
8. APPENDIX
-
8.1 Global Overview
- 8.1.1 Overview
- 8.1.2 Porter’s Five Forces Framework
- 8.1.3 Global Value Chain Analysis
- 8.1.4 Market Dynamics (DROs)
- 8.2 Sources & References
- 8.3 List of Tables & Figures
- 8.4 Primary Insights
- 8.5 Data Pack
- 8.6 Glossary of Terms
You Can Purchase Parts Of This Report. Check Out Prices For Specific Sections
Get Price Break-up Now
List of Tables & Figures
- Figure 1:
- CULTIVATION OF FIELD CROPS IN HECTARE, GLOBAL, 2017 - 2022
- Figure 2:
- CULTIVATION OF HORTICULTURAL CROPS IN HECTARE, GLOBAL, 2017 - 2022
- Figure 3:
- CONSUMPTION OF MICRONUTRIENTS BY FIELD CROPS IN KG/HECTARE, GLOBAL, 2022
- Figure 4:
- CONSUMPTION OF MICRONUTRIENTS BY HORTICULTURAL CROPS IN KG/HECTARE, GLOBAL, 2022
- Figure 5:
- AGRICULTURAL LAND EQUIPPED FOR IRRIGATION IN HECTARE, GLOBAL, 2022
- Figure 6:
- MICRONUTRIENTS FERTILIZER CONSUMPTION IN METRIC TON, GLOBAL, 2017 - 2030
- Figure 7:
- MICRONUTRIENTS FERTILIZER CONSUMPTION IN USD, GLOBAL, 2017 - 2030
- Figure 8:
- MICRONUTRIENTS FERTILIZER CONSUMPTION BY PRODUCT IN METRIC TON, GLOBAL, 2017 - 2030
- Figure 9:
- MICRONUTRIENTS FERTILIZER CONSUMPTION BY PRODUCT IN USD, GLOBAL, 2017 - 2030
- Figure 10:
- MICRONUTRIENTS FERTILIZER CONSUMPTION VOLUME BY PRODUCT IN %, GLOBAL, 2017 VS 2023 VS 2030
- Figure 11:
- MICRONUTRIENTS FERTILIZER CONSUMPTION VALUE BY PRODUCT IN %, GLOBAL, 2017 VS 2023 VS 2030
- Figure 12:
- BORON FERTILIZER CONSUMPTION IN METRIC TON, GLOBAL, 2017 - 2030
- Figure 13:
- BORON FERTILIZER CONSUMPTION IN USD, GLOBAL, 2017 - 2030
- Figure 14:
- BORON FERTILIZER CONSUMPTION VALUE BY CROP TYPE IN %, GLOBAL, 2023 VS 2030
- Figure 15:
- COPPER FERTILIZER CONSUMPTION IN METRIC TON, GLOBAL, 2017 - 2030
- Figure 16:
- COPPER FERTILIZER CONSUMPTION IN USD, GLOBAL, 2017 - 2030
- Figure 17:
- COPPER FERTILIZER CONSUMPTION VALUE BY CROP TYPE IN %, GLOBAL, 2023 VS 2030
- Figure 18:
- IRON FERTILIZER CONSUMPTION IN METRIC TON, GLOBAL, 2017 - 2030
- Figure 19:
- IRON FERTILIZER CONSUMPTION IN USD, GLOBAL, 2017 - 2030
- Figure 20:
- IRON FERTILIZER CONSUMPTION VALUE BY CROP TYPE IN %, GLOBAL, 2023 VS 2030
- Figure 21:
- MANGANESE FERTILIZER CONSUMPTION IN METRIC TON, GLOBAL, 2017 - 2030
- Figure 22:
- MANGANESE FERTILIZER CONSUMPTION IN USD, GLOBAL, 2017 - 2030
- Figure 23:
- MANGANESE FERTILIZER CONSUMPTION VALUE BY CROP TYPE IN %, GLOBAL, 2023 VS 2030
- Figure 24:
- MOLYBDENUM FERTILIZER CONSUMPTION IN METRIC TON, GLOBAL, 2017 - 2030
- Figure 25:
- MOLYBDENUM FERTILIZER CONSUMPTION IN USD, GLOBAL, 2017 - 2030
- Figure 26:
- MOLYBDENUM FERTILIZER CONSUMPTION VALUE BY CROP TYPE IN %, GLOBAL, 2023 VS 2030
- Figure 27:
- ZINC FERTILIZER CONSUMPTION IN METRIC TON, GLOBAL, 2017 - 2030
- Figure 28:
- ZINC FERTILIZER CONSUMPTION IN USD, GLOBAL, 2017 - 2030
- Figure 29:
- ZINC FERTILIZER CONSUMPTION VALUE BY CROP TYPE IN %, GLOBAL, 2023 VS 2030
- Figure 30:
- OTHERS FERTILIZER CONSUMPTION IN METRIC TON, GLOBAL, 2017 - 2030
- Figure 31:
- OTHERS FERTILIZER CONSUMPTION IN USD, GLOBAL, 2017 - 2030
- Figure 32:
- OTHERS FERTILIZER CONSUMPTION VALUE BY CROP TYPE IN %, GLOBAL, 2023 VS 2030
- Figure 33:
- MICRONUTRIENTS MICRONUTRIENTS FERTILIZER CONSUMPTION BY APPLICATION MODE IN METRIC TON, GLOBAL, 2017 - 2030
- Figure 34:
- MICRONUTRIENTS MICRONUTRIENTS FERTILIZER CONSUMPTION BY APPLICATION MODE IN USD, GLOBAL, 2017 - 2030
- Figure 35:
- MICRONUTRIENTS MICRONUTRIENTS FERTILIZER CONSUMPTION VOLUME BY APPLICATION MODE IN %, GLOBAL, 2017 VS 2023 VS 2030
- Figure 36:
- MICRONUTRIENTS MICRONUTRIENTS FERTILIZER CONSUMPTION VALUE BY APPLICATION MODE IN %, GLOBAL, 2017 VS 2023 VS 2030
- Figure 37:
- FERTIGATION APPLICATION OF MICRONUTRIENTS FERTILIZER IN METRIC TON, GLOBAL, 2017 - 2030
- Figure 38:
- FERTIGATION APPLICATION OF MICRONUTRIENTS FERTILIZER IN USD, GLOBAL, 2017 - 2030
- Figure 39:
- FERTIGATION APPLICATION OF MICRONUTRIENTS FERTILIZER IN VALUE BY CROP TYPE IN %, GLOBAL, 2023 VS 2030
- Figure 40:
- FOLIAR APPLICATION OF MICRONUTRIENTS FERTILIZER IN METRIC TON, GLOBAL, 2017 - 2030
- Figure 41:
- FOLIAR APPLICATION OF MICRONUTRIENTS FERTILIZER IN USD, GLOBAL, 2017 - 2030
- Figure 42:
- FOLIAR APPLICATION OF MICRONUTRIENTS FERTILIZER IN VALUE BY CROP TYPE IN %, GLOBAL, 2023 VS 2030
- Figure 43:
- SOIL APPLICATION OF MICRONUTRIENTS FERTILIZER IN METRIC TON, GLOBAL, 2017 - 2030
- Figure 44:
- SOIL APPLICATION OF MICRONUTRIENTS FERTILIZER IN USD, GLOBAL, 2017 - 2030
- Figure 45:
- SOIL APPLICATION OF MICRONUTRIENTS FERTILIZER IN VALUE BY CROP TYPE IN %, GLOBAL, 2023 VS 2030
- Figure 46:
- MICRONUTRIENTS MICRONUTRIENTS FERTILIZER CONSUMPTION BY CROP TYPE IN METRIC TON, GLOBAL, 2017 - 2030
- Figure 47:
- MICRONUTRIENTS MICRONUTRIENTS FERTILIZER CONSUMPTION BY CROP TYPE IN USD, GLOBAL, 2017 - 2030
- Figure 48:
- MICRONUTRIENTS MICRONUTRIENTS FERTILIZER CONSUMPTION VOLUME BY CROP TYPE IN %, GLOBAL, 2017 VS 2023 VS 2030
- Figure 49:
- MICRONUTRIENTS MICRONUTRIENTS FERTILIZER CONSUMPTION VALUE BY CROP TYPE IN %, GLOBAL, 2017 VS 2023 VS 2030
- Figure 50:
- MICRONUTRIENTS FERTILIZER CONSUMPTION BY FIELD CROPS IN METRIC TON, GLOBAL, 2017 - 2030
- Figure 51:
- MICRONUTRIENTS FERTILIZER CONSUMPTION BY FIELD CROPS IN USD, GLOBAL, 2017 - 2030
- Figure 52:
- MICRONUTRIENTS FERTILIZER CONSUMPTION VALUE BY PRODUCT IN %, GLOBAL, 2023 VS 2030
- Figure 53:
- MICRONUTRIENTS FERTILIZER CONSUMPTION BY HORTICULTURAL CROPS IN METRIC TON, GLOBAL, 2017 - 2030
- Figure 54:
- MICRONUTRIENTS FERTILIZER CONSUMPTION BY HORTICULTURAL CROPS IN USD, GLOBAL, 2017 - 2030
- Figure 55:
- MICRONUTRIENTS FERTILIZER CONSUMPTION VALUE BY PRODUCT IN %, GLOBAL, 2023 VS 2030
- Figure 56:
- MICRONUTRIENTS FERTILIZER CONSUMPTION BY TURF & ORNAMENTAL IN METRIC TON, GLOBAL, 2017 - 2030
- Figure 57:
- MICRONUTRIENTS FERTILIZER CONSUMPTION BY TURF & ORNAMENTAL IN USD, GLOBAL, 2017 - 2030
- Figure 58:
- MICRONUTRIENTS FERTILIZER CONSUMPTION VALUE BY PRODUCT IN %, GLOBAL, 2023 VS 2030
- Figure 59:
- MICRONUTRIENTS MICRONUTRIENTS FERTILIZER CONSUMPTION BY REGION IN METRIC TON, GLOBAL, 2017 - 2030
- Figure 60:
- MICRONUTRIENTS MICRONUTRIENTS FERTILIZER CONSUMPTION BY REGION IN USD, GLOBAL, 2017 - 2030
- Figure 61:
- MICRONUTRIENTS MICRONUTRIENTS FERTILIZER CONSUMPTION VOLUME BY REGION IN %, GLOBAL, 2017 VS 2023 VS 2030
- Figure 62:
- MICRONUTRIENTS MICRONUTRIENTS FERTILIZER CONSUMPTION VALUE BY REGION IN %, GLOBAL, 2017 VS 2023 VS 2030
- Figure 63:
- MICRONUTRIENTS MICRONUTRIENTS FERTILIZER CONSUMPTION BY COUNTRY IN METRIC TON, ASIA-PACIFIC, 2017 - 2030
- Figure 64:
- MICRONUTRIENTS MICRONUTRIENTS FERTILIZER CONSUMPTION BY COUNTRY IN USD, ASIA-PACIFIC, 2017 - 2030
- Figure 65:
- MICRONUTRIENTS MICRONUTRIENTS FERTILIZER CONSUMPTION VOLUME BY COUNTRY IN %, ASIA-PACIFIC, 2017 VS 2023 VS 2030
- Figure 66:
- MICRONUTRIENTS MICRONUTRIENTS FERTILIZER CONSUMPTION VALUE BY COUNTRY IN %, ASIA-PACIFIC, 2017 VS 2023 VS 2030
- Figure 67:
- MICRONUTRIENTS FERTILIZER CONSUMPTION IN METRIC TON, AUSTRALIA, 2017 - 2030
- Figure 68:
- MICRONUTRIENTS FERTILIZER CONSUMPTION IN USD, AUSTRALIA, 2017 - 2030
- Figure 69:
- MICRONUTRIENTS FERTILIZER CONSUMPTION VALUE BY CROP TYPE IN %, AUSTRALIA, 2023 VS 2030
- Figure 70:
- MICRONUTRIENTS FERTILIZER CONSUMPTION IN METRIC TON, BANGLADESH, 2017 - 2030
- Figure 71:
- MICRONUTRIENTS FERTILIZER CONSUMPTION IN USD, BANGLADESH, 2017 - 2030
- Figure 72:
- MICRONUTRIENTS FERTILIZER CONSUMPTION VALUE BY CROP TYPE IN %, BANGLADESH, 2023 VS 2030
- Figure 73:
- MICRONUTRIENTS FERTILIZER CONSUMPTION IN METRIC TON, CHINA, 2017 - 2030
- Figure 74:
- MICRONUTRIENTS FERTILIZER CONSUMPTION IN USD, CHINA, 2017 - 2030
- Figure 75:
- MICRONUTRIENTS FERTILIZER CONSUMPTION VALUE BY CROP TYPE IN %, CHINA, 2023 VS 2030
- Figure 76:
- MICRONUTRIENTS FERTILIZER CONSUMPTION IN METRIC TON, INDIA, 2017 - 2030
- Figure 77:
- MICRONUTRIENTS FERTILIZER CONSUMPTION IN USD, INDIA, 2017 - 2030
- Figure 78:
- MICRONUTRIENTS FERTILIZER CONSUMPTION VALUE BY CROP TYPE IN %, INDIA, 2023 VS 2030
- Figure 79:
- MICRONUTRIENTS FERTILIZER CONSUMPTION IN METRIC TON, INDONESIA, 2017 - 2030
- Figure 80:
- MICRONUTRIENTS FERTILIZER CONSUMPTION IN USD, INDONESIA, 2017 - 2030
- Figure 81:
- MICRONUTRIENTS FERTILIZER CONSUMPTION VALUE BY CROP TYPE IN %, INDONESIA, 2023 VS 2030
- Figure 82:
- MICRONUTRIENTS FERTILIZER CONSUMPTION IN METRIC TON, JAPAN, 2017 - 2030
- Figure 83:
- MICRONUTRIENTS FERTILIZER CONSUMPTION IN USD, JAPAN, 2017 - 2030
- Figure 84:
- MICRONUTRIENTS FERTILIZER CONSUMPTION VALUE BY CROP TYPE IN %, JAPAN, 2023 VS 2030
- Figure 85:
- MICRONUTRIENTS FERTILIZER CONSUMPTION IN METRIC TON, PAKISTAN, 2017 - 2030
- Figure 86:
- MICRONUTRIENTS FERTILIZER CONSUMPTION IN USD, PAKISTAN, 2017 - 2030
- Figure 87:
- MICRONUTRIENTS FERTILIZER CONSUMPTION VALUE BY CROP TYPE IN %, PAKISTAN, 2023 VS 2030
- Figure 88:
- MICRONUTRIENTS FERTILIZER CONSUMPTION IN METRIC TON, PHILIPPINES, 2017 - 2030
- Figure 89:
- MICRONUTRIENTS FERTILIZER CONSUMPTION IN USD, PHILIPPINES, 2017 - 2030
- Figure 90:
- MICRONUTRIENTS FERTILIZER CONSUMPTION VALUE BY CROP TYPE IN %, PHILIPPINES, 2023 VS 2030
- Figure 91:
- MICRONUTRIENTS FERTILIZER CONSUMPTION IN METRIC TON, THAILAND, 2017 - 2030
- Figure 92:
- MICRONUTRIENTS FERTILIZER CONSUMPTION IN USD, THAILAND, 2017 - 2030
- Figure 93:
- MICRONUTRIENTS FERTILIZER CONSUMPTION VALUE BY CROP TYPE IN %, THAILAND, 2023 VS 2030
- Figure 94:
- MICRONUTRIENTS FERTILIZER CONSUMPTION IN METRIC TON, VIETNAM, 2017 - 2030
- Figure 95:
- MICRONUTRIENTS FERTILIZER CONSUMPTION IN USD, VIETNAM, 2017 - 2030
- Figure 96:
- MICRONUTRIENTS FERTILIZER CONSUMPTION VALUE BY CROP TYPE IN %, VIETNAM, 2023 VS 2030
- Figure 97:
- MICRONUTRIENTS FERTILIZER CONSUMPTION IN METRIC TON, REST OF ASIA-PACIFIC, 2017 - 2030
- Figure 98:
- MICRONUTRIENTS FERTILIZER CONSUMPTION IN USD, REST OF ASIA-PACIFIC, 2017 - 2030
- Figure 99:
- MICRONUTRIENTS FERTILIZER CONSUMPTION VALUE BY CROP TYPE IN %, REST OF ASIA-PACIFIC, 2023 VS 2030
- Figure 100:
- MICRONUTRIENTS MICRONUTRIENTS FERTILIZER CONSUMPTION BY COUNTRY IN METRIC TON, EUROPE, 2017 - 2030
- Figure 101:
- MICRONUTRIENTS MICRONUTRIENTS FERTILIZER CONSUMPTION BY COUNTRY IN USD, EUROPE, 2017 - 2030
- Figure 102:
- MICRONUTRIENTS MICRONUTRIENTS FERTILIZER CONSUMPTION VOLUME BY COUNTRY IN %, EUROPE, 2017 VS 2023 VS 2030
- Figure 103:
- MICRONUTRIENTS MICRONUTRIENTS FERTILIZER CONSUMPTION VALUE BY COUNTRY IN %, EUROPE, 2017 VS 2023 VS 2030
- Figure 104:
- MICRONUTRIENTS FERTILIZER CONSUMPTION IN METRIC TON, FRANCE, 2017 - 2030
- Figure 105:
- MICRONUTRIENTS FERTILIZER CONSUMPTION IN USD, FRANCE, 2017 - 2030
- Figure 106:
- MICRONUTRIENTS FERTILIZER CONSUMPTION VALUE BY CROP TYPE IN %, FRANCE, 2023 VS 2030
- Figure 107:
- MICRONUTRIENTS FERTILIZER CONSUMPTION IN METRIC TON, GERMANY, 2017 - 2030
- Figure 108:
- MICRONUTRIENTS FERTILIZER CONSUMPTION IN USD, GERMANY, 2017 - 2030
- Figure 109:
- MICRONUTRIENTS FERTILIZER CONSUMPTION VALUE BY CROP TYPE IN %, GERMANY, 2023 VS 2030
- Figure 110:
- MICRONUTRIENTS FERTILIZER CONSUMPTION IN METRIC TON, ITALY, 2017 - 2030
- Figure 111:
- MICRONUTRIENTS FERTILIZER CONSUMPTION IN USD, ITALY, 2017 - 2030
- Figure 112:
- MICRONUTRIENTS FERTILIZER CONSUMPTION VALUE BY CROP TYPE IN %, ITALY, 2023 VS 2030
- Figure 113:
- MICRONUTRIENTS FERTILIZER CONSUMPTION IN METRIC TON, NETHERLANDS, 2017 - 2030
- Figure 114:
- MICRONUTRIENTS FERTILIZER CONSUMPTION IN USD, NETHERLANDS, 2017 - 2030
- Figure 115:
- MICRONUTRIENTS FERTILIZER CONSUMPTION VALUE BY CROP TYPE IN %, NETHERLANDS, 2023 VS 2030
- Figure 116:
- MICRONUTRIENTS FERTILIZER CONSUMPTION IN METRIC TON, RUSSIA, 2017 - 2030
- Figure 117:
- MICRONUTRIENTS FERTILIZER CONSUMPTION IN USD, RUSSIA, 2017 - 2030
- Figure 118:
- MICRONUTRIENTS FERTILIZER CONSUMPTION VALUE BY CROP TYPE IN %, RUSSIA, 2023 VS 2030
- Figure 119:
- MICRONUTRIENTS FERTILIZER CONSUMPTION IN METRIC TON, SPAIN, 2017 - 2030
- Figure 120:
- MICRONUTRIENTS FERTILIZER CONSUMPTION IN USD, SPAIN, 2017 - 2030
- Figure 121:
- MICRONUTRIENTS FERTILIZER CONSUMPTION VALUE BY CROP TYPE IN %, SPAIN, 2023 VS 2030
- Figure 122:
- MICRONUTRIENTS FERTILIZER CONSUMPTION IN METRIC TON, UKRAINE, 2017 - 2030
- Figure 123:
- MICRONUTRIENTS FERTILIZER CONSUMPTION IN USD, UKRAINE, 2017 - 2030
- Figure 124:
- MICRONUTRIENTS FERTILIZER CONSUMPTION VALUE BY CROP TYPE IN %, UKRAINE, 2023 VS 2030
- Figure 125:
- MICRONUTRIENTS FERTILIZER CONSUMPTION IN METRIC TON, UNITED KINGDOM, 2017 - 2030
- Figure 126:
- MICRONUTRIENTS FERTILIZER CONSUMPTION IN USD, UNITED KINGDOM, 2017 - 2030
- Figure 127:
- MICRONUTRIENTS FERTILIZER CONSUMPTION VALUE BY CROP TYPE IN %, UNITED KINGDOM, 2023 VS 2030
- Figure 128:
- MICRONUTRIENTS FERTILIZER CONSUMPTION IN METRIC TON, REST OF EUROPE, 2017 - 2030
- Figure 129:
- MICRONUTRIENTS FERTILIZER CONSUMPTION IN USD, REST OF EUROPE, 2017 - 2030
- Figure 130:
- MICRONUTRIENTS FERTILIZER CONSUMPTION VALUE BY CROP TYPE IN %, REST OF EUROPE, 2023 VS 2030
- Figure 131:
- MICRONUTRIENTS MICRONUTRIENTS FERTILIZER CONSUMPTION BY COUNTRY IN METRIC TON, MIDDLE EAST & AFRICA, 2017 - 2030
- Figure 132:
- MICRONUTRIENTS MICRONUTRIENTS FERTILIZER CONSUMPTION BY COUNTRY IN USD, MIDDLE EAST & AFRICA, 2017 - 2030
- Figure 133:
- MICRONUTRIENTS MICRONUTRIENTS FERTILIZER CONSUMPTION VOLUME BY COUNTRY IN %, MIDDLE EAST & AFRICA, 2017 VS 2023 VS 2030
- Figure 134:
- MICRONUTRIENTS MICRONUTRIENTS FERTILIZER CONSUMPTION VALUE BY COUNTRY IN %, MIDDLE EAST & AFRICA, 2017 VS 2023 VS 2030
- Figure 135:
- MICRONUTRIENTS FERTILIZER CONSUMPTION IN METRIC TON, NIGERIA, 2017 - 2030
- Figure 136:
- MICRONUTRIENTS FERTILIZER CONSUMPTION IN USD, NIGERIA, 2017 - 2030
- Figure 137:
- MICRONUTRIENTS FERTILIZER CONSUMPTION VALUE BY CROP TYPE IN %, NIGERIA, 2023 VS 2030
- Figure 138:
- MICRONUTRIENTS FERTILIZER CONSUMPTION IN METRIC TON, SAUDI ARABIA, 2017 - 2030
- Figure 139:
- MICRONUTRIENTS FERTILIZER CONSUMPTION IN USD, SAUDI ARABIA, 2017 - 2030
- Figure 140:
- MICRONUTRIENTS FERTILIZER CONSUMPTION VALUE BY CROP TYPE IN %, SAUDI ARABIA, 2023 VS 2030
- Figure 141:
- MICRONUTRIENTS FERTILIZER CONSUMPTION IN METRIC TON, SOUTH AFRICA, 2017 - 2030
- Figure 142:
- MICRONUTRIENTS FERTILIZER CONSUMPTION IN USD, SOUTH AFRICA, 2017 - 2030
- Figure 143:
- MICRONUTRIENTS FERTILIZER CONSUMPTION VALUE BY CROP TYPE IN %, SOUTH AFRICA, 2023 VS 2030
- Figure 144:
- MICRONUTRIENTS FERTILIZER CONSUMPTION IN METRIC TON, TURKEY, 2017 - 2030
- Figure 145:
- MICRONUTRIENTS FERTILIZER CONSUMPTION IN USD, TURKEY, 2017 - 2030
- Figure 146:
- MICRONUTRIENTS FERTILIZER CONSUMPTION VALUE BY CROP TYPE IN %, TURKEY, 2023 VS 2030
- Figure 147:
- MICRONUTRIENTS FERTILIZER CONSUMPTION IN METRIC TON, REST OF MIDDLE EAST & AFRICA, 2017 - 2030
- Figure 148:
- MICRONUTRIENTS FERTILIZER CONSUMPTION IN USD, REST OF MIDDLE EAST & AFRICA, 2017 - 2030
- Figure 149:
- MICRONUTRIENTS FERTILIZER CONSUMPTION VALUE BY CROP TYPE IN %, REST OF MIDDLE EAST & AFRICA, 2023 VS 2030
- Figure 150:
- MICRONUTRIENTS MICRONUTRIENTS FERTILIZER CONSUMPTION BY COUNTRY IN METRIC TON, NORTH AMERICA, 2017 - 2030
- Figure 151:
- MICRONUTRIENTS MICRONUTRIENTS FERTILIZER CONSUMPTION BY COUNTRY IN USD, NORTH AMERICA, 2017 - 2030
- Figure 152:
- MICRONUTRIENTS MICRONUTRIENTS FERTILIZER CONSUMPTION VOLUME BY COUNTRY IN %, NORTH AMERICA, 2017 VS 2023 VS 2030
- Figure 153:
- MICRONUTRIENTS MICRONUTRIENTS FERTILIZER CONSUMPTION VALUE BY COUNTRY IN %, NORTH AMERICA, 2017 VS 2023 VS 2030
- Figure 154:
- MICRONUTRIENTS FERTILIZER CONSUMPTION IN METRIC TON, CANADA, 2017 - 2030
- Figure 155:
- MICRONUTRIENTS FERTILIZER CONSUMPTION IN USD, CANADA, 2017 - 2030
- Figure 156:
- MICRONUTRIENTS FERTILIZER CONSUMPTION VALUE BY CROP TYPE IN %, CANADA, 2023 VS 2030
- Figure 157:
- MICRONUTRIENTS FERTILIZER CONSUMPTION IN METRIC TON, MEXICO, 2017 - 2030
- Figure 158:
- MICRONUTRIENTS FERTILIZER CONSUMPTION IN USD, MEXICO, 2017 - 2030
- Figure 159:
- MICRONUTRIENTS FERTILIZER CONSUMPTION VALUE BY CROP TYPE IN %, MEXICO, 2023 VS 2030
- Figure 160:
- MICRONUTRIENTS FERTILIZER CONSUMPTION IN METRIC TON, UNITED STATES, 2017 - 2030
- Figure 161:
- MICRONUTRIENTS FERTILIZER CONSUMPTION IN USD, UNITED STATES, 2017 - 2030
- Figure 162:
- MICRONUTRIENTS FERTILIZER CONSUMPTION VALUE BY CROP TYPE IN %, UNITED STATES, 2023 VS 2030
- Figure 163:
- MICRONUTRIENTS FERTILIZER CONSUMPTION IN METRIC TON, REST OF NORTH AMERICA, 2017 - 2030
- Figure 164:
- MICRONUTRIENTS FERTILIZER CONSUMPTION IN USD, REST OF NORTH AMERICA, 2017 - 2030
- Figure 165:
- MICRONUTRIENTS FERTILIZER CONSUMPTION VALUE BY CROP TYPE IN %, REST OF NORTH AMERICA, 2023 VS 2030
- Figure 166:
- MICRONUTRIENTS MICRONUTRIENTS FERTILIZER CONSUMPTION BY COUNTRY IN METRIC TON, SOUTH AMERICA, 2017 - 2030
- Figure 167:
- MICRONUTRIENTS MICRONUTRIENTS FERTILIZER CONSUMPTION BY COUNTRY IN USD, SOUTH AMERICA, 2017 - 2030
- Figure 168:
- MICRONUTRIENTS MICRONUTRIENTS FERTILIZER CONSUMPTION VOLUME BY COUNTRY IN %, SOUTH AMERICA, 2017 VS 2023 VS 2030
- Figure 169:
- MICRONUTRIENTS MICRONUTRIENTS FERTILIZER CONSUMPTION VALUE BY COUNTRY IN %, SOUTH AMERICA, 2017 VS 2023 VS 2030
- Figure 170:
- MICRONUTRIENTS FERTILIZER CONSUMPTION IN METRIC TON, ARGENTINA, 2017 - 2030
- Figure 171:
- MICRONUTRIENTS FERTILIZER CONSUMPTION IN USD, ARGENTINA, 2017 - 2030
- Figure 172:
- MICRONUTRIENTS FERTILIZER CONSUMPTION VALUE BY CROP TYPE IN %, ARGENTINA, 2023 VS 2030
- Figure 173:
- MICRONUTRIENTS FERTILIZER CONSUMPTION IN METRIC TON, BRAZIL, 2017 - 2030
- Figure 174:
- MICRONUTRIENTS FERTILIZER CONSUMPTION IN USD, BRAZIL, 2017 - 2030
- Figure 175:
- MICRONUTRIENTS FERTILIZER CONSUMPTION VALUE BY CROP TYPE IN %, BRAZIL, 2023 VS 2030
- Figure 176:
- MICRONUTRIENTS FERTILIZER CONSUMPTION IN METRIC TON, REST OF SOUTH AMERICA, 2017 - 2030
- Figure 177:
- MICRONUTRIENTS FERTILIZER CONSUMPTION IN USD, REST OF SOUTH AMERICA, 2017 - 2030
- Figure 178:
- MICRONUTRIENTS FERTILIZER CONSUMPTION VALUE BY CROP TYPE IN %, REST OF SOUTH AMERICA, 2023 VS 2030
- Figure 179:
- MOST ACTIVE COMPANIES BY NUMBER OF STRATEGIC MOVES, GLOBAL, 2017 - 2030
- Figure 180:
- GLOBAL MICRONUTRIENT FERTILIZER MARKET, MOST ADOPTED STRATEGIES, 2018 - 2021
- Figure 181:
- MARKET SHARE OF MAJOR PLAYERS IN %, GLOBAL
Micronutrient Fertilizer Industry Segmentation
Boron, Copper, Iron, Manganese, Molybdenum, Zinc, Others are covered as segments by Product. Fertigation, Foliar, Soil are covered as segments by Application Mode. Field Crops, Horticultural Crops, Turf & Ornamental are covered as segments by Crop Type. Asia-Pacific, Europe, Middle East & Africa, North America, South America are covered as segments by Region.| Product | Boron | ||
| Copper | |||
| Iron | |||
| Manganese | |||
| Molybdenum | |||
| Zinc | |||
| Others | |||
| Application Mode | Fertigation | ||
| Foliar | |||
| Soil | |||
| Crop Type | Field Crops | ||
| Horticultural Crops | |||
| Turf & Ornamental | |||
| Region | Asia-Pacific | Australia | |
| Bangladesh | |||
| China | |||
| India | |||
| Indonesia | |||
| Japan | |||
| Pakistan | |||
| Philippines | |||
| Thailand | |||
| Vietnam | |||
| Rest of Asia-Pacific | |||
| Europe | France | ||
| Germany | |||
| Italy | |||
| Netherlands | |||
| Russia | |||
| Spain | |||
| Ukraine | |||
| United Kingdom | |||
| Rest of Europe | |||
| Middle East & Africa | Nigeria | ||
| Saudi Arabia | |||
| South Africa | |||
| Turkey | |||
| Rest of Middle East & Africa | |||
| North America | Canada | ||
| Mexico | |||
| United States | |||
| Rest of North America | |||
| South America | Argentina | ||
| Brazil | |||
| Rest of South America | |||
Need A Different Region or Segment?
Customize Now
Market Definition
- MARKET ESTIMATION LEVEL - Market Estimations for various types of fertilizers has been done at the product-level and not at the nutrient-level.
- NUTRIENT TYPES COVERED - Micronutients: Zn, Mn, Cu, Fe, Mo, B, and Others
- AVERAGE NUTRIENT APPLICATION RATE - This refers to the average volume of nutrient consumed per hectare of farmland in each country.
- CROP TYPES COVERED - Field Crops: Cereals, Pulses, Oilseeds, and Fiber Crops Horticulture: Fruits, Vegetables, Plantation Crops and Spices, Turf Grass and Ornamentals
| Keyword | Definition |
|---|---|
| Fertilizer | Chemical substance applied to crops to ensure nutritional requirements, available in various forms such as granules, powders, liquid, water soluble, etc. |
| Specialty Fertilizer | Used for enhanced efficiency and nutrient availability applied through soil, foliar, and fertigation. Includes CRF, SRF, liquid fertilizer, and water soluble fertilizers. |
| Controlled-Release Fertilizers (CRF) | Coated with materials such as polymer, polymer-sulfur, and other materials such as resins to ensure nutrient availability to the crop for its entire life cycle. |
| Slow-Release Fertilizers (SRF) | Coated with materials such as sulfur, neem, etc., to ensure nutrient availability to the crop for a longer period. |
| Foliar Fertilizers | Consist of both liquid and water soluble fertilizers applied through foliar application. |
| Water-Soluble Fertilizers | Available in various forms including liquid, powder, etc., used in foliar and fertigation mode of fertilizer application. |
| Fertigation | Fertilizers applied through different irrigation systems such as drip irrigation, micro irrigation, sprinkler irrigation, etc. |
| Anhydrous Ammonia | Used as fertilizer, directly injected into the soil, available in gaseous liquid form. |
| Single Super Phosphate (SSP) | Phosphorus fertilizer containing only phosphorus which has lesser than or equal to 35%. |
| Triple Super Phosphate (TSP) | Phosphorus fertilizer containing only phosphorus greater than 35%. |
| Enhanced Efficiency Fertilizers | Fertilizers coated or treated with additional layers of various ingredients to make it more efficient compared to other fertilizers. |
| Conventional Fertilizer | Fertilizers applied to crops through traditional methods including broadcasting, row placement, ploughing soil placement, etc. |
| Chelated Micronutrients | Micronutrient fertilizers coated with chelating agents such as EDTA, EDDHA, DTPA, HEDTA, etc. |
| Liquid Fertilizers | Available in liquid form, majorly used for application of fertilizers to crops through foliar and fertigation. |
Need More Details on Market Definition?
Ask a Question
Research Methodology
Mordor Intelligence follows a four-step methodology in all our reports.
- Step-1: IDENTIFY KEY VARIABLES: In order to build a robust forecasting methodology, the variables and factors identified in Step-1 are tested against available historical market numbers. Through an iterative process, the variables required for market forecast are set and the model is built on the basis of these variables.
- Step-2: Build a Market Model: Market-size estimations for the forecast years are in nominal terms. Inflation is not a part of the pricing, and the average selling price (ASP) is kept constant throughout the forecast period for each country.
- Step-3: Validate and Finalize: In this important step, all market numbers, variables and analyst calls are validated through an extensive network of primary research experts from the market studied. The respondents are selected across levels and functions to generate a holistic picture of the market studied.
- Step-4: Research Outputs: Syndicated Reports, Custom Consulting Assignments, Databases & Subscription Platforms

Get More Details On Research Methodology
Download PDF


