Market Overview
| Study Period | 2017 - 2030 |
|---|---|
| Base Year For Estimation | 2024 |
| Forecast Data Period | 2025 - 2030 |
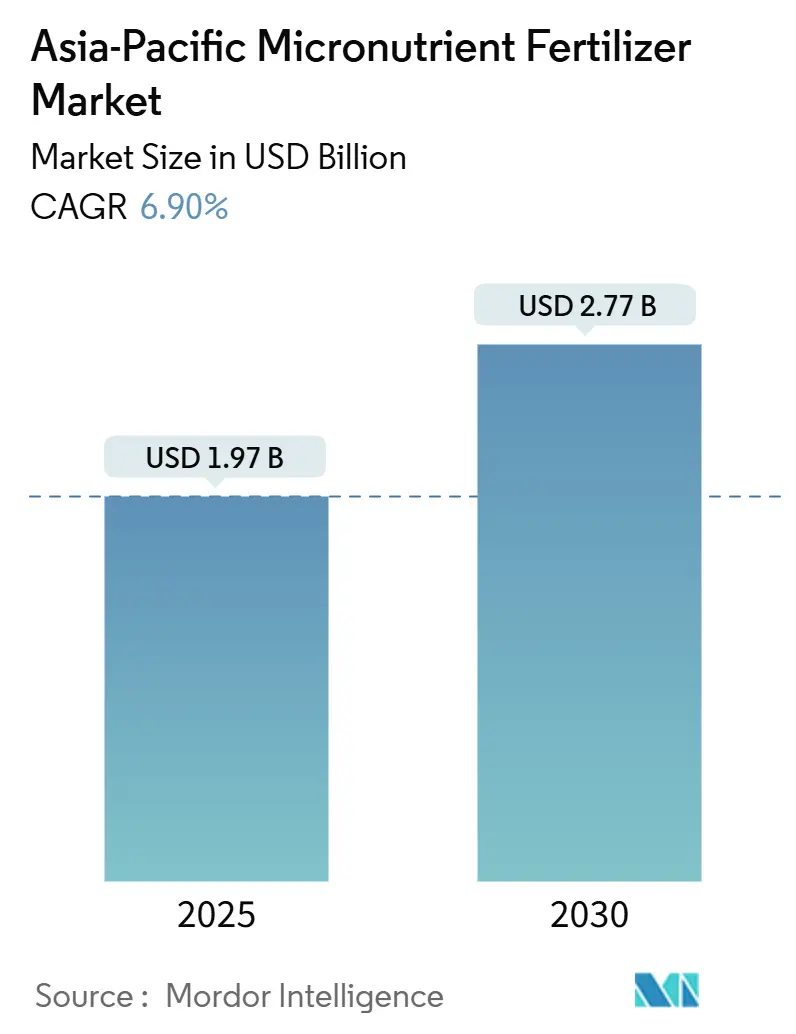
| Market Size (2025) | USD 1.97 Billion |
| Market Size (2030) | USD 2.77 Billion |
| Growth Rate (2025 - 2030) | 6.90% CAGR |
| Market Concentration | Low |
Major Players*Disclaimer: Major Players sorted in no particular order Image © Mordor Intelligence. Reuse requires attribution under CC BY 4.0. | |
Asia-Pacific Micronutrient Fertilizer Market Analysis by Mordor Intelligence
The Asia-Pacific micronutrient fertilizer market size is valued at USD 1.97 billion in 2025 and is forecast to reach USD 2.77 billion in 2030, advancing at a 6.9% CAGR during 2025-2030. The upward trajectory reflects expanding precision-farming practices, widespread micronutrient deficiencies, and supportive fiscal incentives that lower input costs for smallholders. Province-level zinc subsidies in China also buoy the Asia-Pacific micronutrient fertilizer market, GST reductions in India, and fertigation uptake in Australia, all of which widen product access, spur demand for specialized formulations, and create white-space opportunities for regional innovators. Heightened digital-platform penetration, led by BASF’s xarvio and India’s Geoagro-iKrishi, accelerates advisory reach, while supply-side advances in nano and chelated technologies improve nutrient-use efficiency. However, raw-material price volatility for zinc sulfate ores, limited rural credit in parts of South Asia, and an influx of counterfeit inputs in Indonesia and the Philippines introduce short-term headwinds that temper but do not derail overall expansion of the Asia-Pacific micronutrient fertilizer market.
Key Report Takeaways
- By product category, copper held 32.1% of the Asia-Pacific micronutrient fertilizer market share in 2024, while boron is projected to expand at an 8.1% CAGR through 2030.
- By application mode, soil application accounted for a 96.3% share of the Asia-Pacific micronutrient fertilizer market size in 2024 and fertigation is advancing at a 7.4% CAGR to 2030.
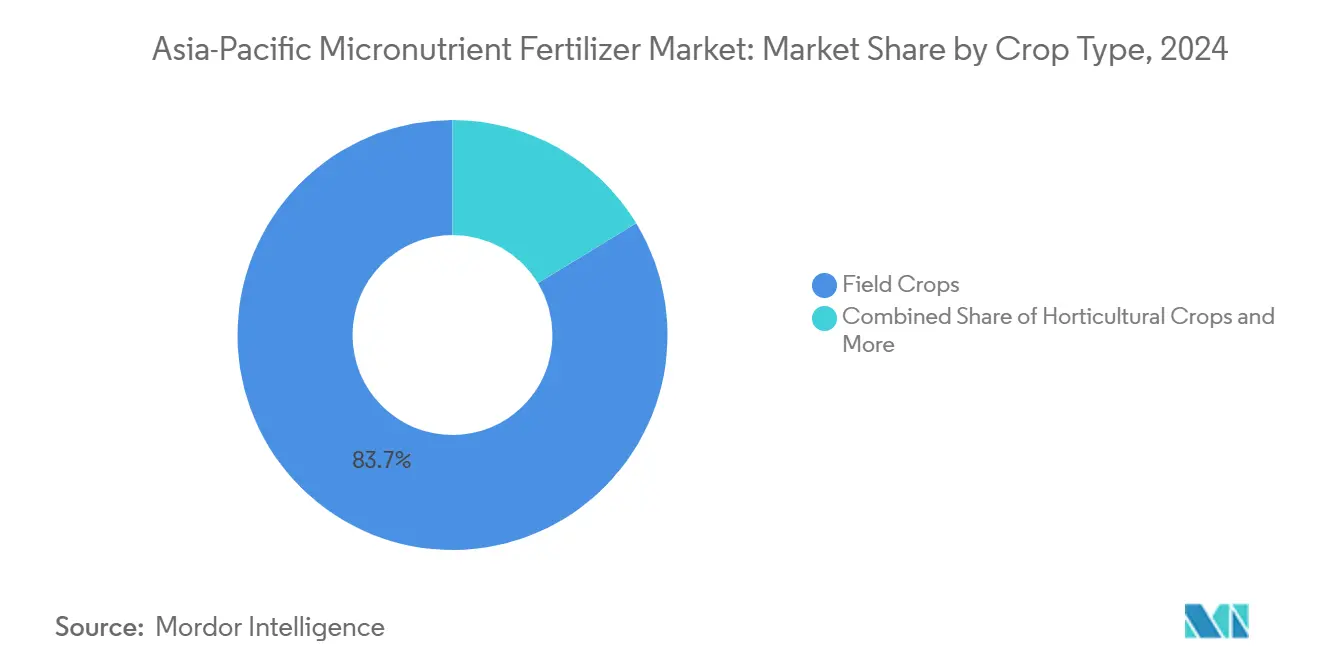
- By crop type, field crops commanded 83.7% of the Asia-Pacific micronutrient fertilizer market size in 2024, turf and ornamental crops are forecast to grow at a 9.0% CAGR through 2030.
- By geography, India led with a 41.4% Asia-Pacific micronutrient fertilizer market share in 2024, whereas Australia records the highest projected CAGR at 8.7% to 2030.
Asia-Pacific Micronutrient Fertilizer Market Trends and Insights
Drivers Impact Analysis
| Driver | (~) % Impact on CAGR Forecast | Geographic Relevance | Impact Timeline |
|---|---|---|---|
| China's Zinc Subsidies Target Hidden Hunger Crisis | +1.2% | China core, spillover to wider Asia-Pacific | Medium term (2-4 years) |
| Australia's Fertigation Revolution in Protected Horticulture | +0.8% | Australia, New Zealand, spreading to Southeast Asia | Short term (≤ 2 years) |
| India's Soil Health Cards Drive Systematic Micronutrient Testing | +1.5% | India core, replication in Bangladesh and Pakistan | Long term (≥ 4 years) |
| Digital Platforms Accelerate Precision Micronutrient Applications | +0.7% | Vietnam, Thailand, widening to the Philippines | Medium term (2-4 years) |
| Specialty-Crop Expansion Drives Customized Demand | +0.9% | Region-wide, strongest in India and China | Short term (≤ 2 years) |
| Consumer Demand for Fortified Foods Spurs Farm-Level Biofortification | +0.6% | Major rice-growing areas of Asia-Pacific | Long term (≥ 4 years) |
| Source: Mordor Intelligence | |||
Understand The Key Trends Shaping This Market
Download PDF
China's Zinc Subsidies Target Hidden Hunger Crisis
China’s nutrition-centric subsidy scheme reallocates provincial funds toward zinc-enriched fertilizers that lift grain micronutrient density instead of merely boosting yields. The initiative reframes product success metrics around grain zinc content and aligns public health goals with farm-level practices, pushing the Asia-Pacific micronutrient fertilizer market toward value-added formulations. Field evidence shows foliar zinc delivers 55.2% higher biofortification efficacy than soil application, spurring R&D into next-generation foliar sprays. Multiplier effects arise as neighboring countries monitor China’s program to replicate its public health gains, unlocking additional addressable demand for specialized suppliers.
Australia's Fertigation Revolution in Protected Horticulture
Water-scarce Australia prioritizes fertigation to minimize waste and fine-tune nutrient timing for high-density blueberries and other greenhouse fruit crops[1]Source: Australian Government Department of Agriculture, “Protected Horticulture Industry Analysis,” agriculture.gov.au. This shift favors fully water-soluble chelated micronutrients that command premium pricing yet deliver measurable yield-and-quality gains. Early adopters report reductions in iron chlorosis episodes and improved firmness in export berries, catalyzing copy-cat investments in New Zealand and Southeast Asian greenhouses. Rising fertigation acreage, therefore, underwrites the fastest-growing application segment of the Asia-Pacific micronutrient fertilizer market.
Digital Platforms Accelerate Precision Micronutrient Applications
Platforms such as BASF’s xarvio and IRRI’s Rice Crop Manager blend satellite imagery, local weather, and soil analytics to dispense field-specific dosage alerts. These channels bypass legacy distribution layers, curbing counterfeit infiltration and enabling vendors to bundle premium chelated or nano products with agronomic support. Larger datasets continuously refine algorithms, improving recommendation accuracy and farmer trust, which in turn elevates adoption rates in the Asia-Pacific micronutrient fertilizer market.
Specialty-Crop Expansion Drives Customized Demand
Vietnam’s avocado plantings and Thailand’s blueberry acreage draw attention to boron-mediated fruit set and copper-dependent disease management, respectively. Because export buyers enforce strict nutrient specifications, growers willingly pay for crop-specific blends, encouraging manufacturers to differentiate SKUs by phenological stage and soil pH. Such diversification grows the value pool even if total micronutrient metric tons remain modest, reinforcing boron’s status as the fastest-growing product.
Restraints Impact Analysis
| Restraint | (~) % Impact on CAGR Forecast | Geographic Relevance | Impact Timeline |
|---|---|---|---|
| Raw-Material Price Volatility Constrains Market Accessibility | -1.1% | China, Australia, wider Asia-Pacific | Short term (≤ 2 years) |
| Credit Constraints Limit Premium Product Adoption | -0.8% | Bangladesh, Pakistan, rural India | Medium term (2-4 years) |
| Counterfeit Products Erode Farmer Confidence | -0.6% | Indonesia, Philippines, Vietnam | Medium term (2-4 years) |
| Port Bottlenecks Delay Chelated Micronutrient Exports | -0.4% | China export-dependent markets | Short term (≤ 2 years) |
| Source: Mordor Intelligence | |||
Raw-Material Price Volatility Constrains Market Accessibility
China’s mine closures under stringent environmental mandates curtail the supply of high-grade zinc sulfate ores, lifting feedstock costs and cascading into micronutrient price swings. Distributors struggle to hedge inventories, forcing periodic price hikes that strain smallholders’ cash flow and hinder uptake. Chelated and nano formulations, which rely on purer inputs, bear disproportionate cost pressure, narrowing the adoption of these high-efficacy options within the Asia-Pacific micronutrient fertilizer market.
Credit Constraints Limit Premium Product Adoption
In Bangladesh, where 80% of fertilizers are imported, currency volatility inflates landed costs and stretches subsidy budgets. Commercial banks in Pakistan apply conservative lending norms, preferring to finance low-risk NPK purchases. Without affordable seasonal credit, smallholders postpone or skip micronutrient applications despite proven yield benefits, muting the Asia-Pacific micronutrient fertilizer market’s value potential in lower-income segments.
Segment Analysis
By Product: Copper Resilience Meets Boron Upswing
Copper dominated the Asia-Pacific micronutrient fertilizer market with a 32.1% share in 2024, driven by its longstanding use in rice systems and dual agronomic-fungicidal role. The segment’s entrenched distributor networks and field-trial familiarity underpin stable volume even as chelated alternatives emerge. Boron, however, is on track to post an 8.1% CAGR to 2030 as fruit-crop acreage expands in Southeast Asia, foliar boron applications have lifted citrus fruit set by up to 25%. Producers leverage differentiated packaging and crop-stage labeling to convert grower awareness into repeat purchases, reinforcing the Asia-Pacific micronutrient fertilizer market size outlook. Product portfolios now feature soluble boron for fertigation and controlled-release boron for sandy soils, ensuring relevance across diverse agro-ecologies.
Continued R&D in nano copper seeks to curtail phytotoxicity and enhance uptake, a move anticipated to preserve copper’s revenue base even as regulatory scrutiny over heavy-metal accumulation tightens. Zinc remains buoyed by policy support, while iron sees heightened closed-system demand in hydroponics. Emerging nutrients such as selenium appear in specialty blends targeting niche deficiencies. Collectively, such diversification ensures that the Asia-Pacific micronutrient fertilizer market retains a balanced mix of high-volume staples and high-value innovations.

Note: Segment shares of all individual segments available upon report purchase
Get Detailed Market Forecasts at the Most Granular Levels
Download PDF
By Application Mode: Soil Dominance but Fertigation Momentum
Soil broadcasting held 96.3% of the Asia-Pacific micronutrient fertilizer market size in 2024 because broad-acre rice, wheat, and corn rely on inexpensive granular formulations applied with existing spreaders. Yet fertigation is slated to deliver a 7.4% CAGR through 2030 as water-efficient protected cultivation gains ground. Growers deploying drip lines in Australian berry tunnels report tighter pH control and higher iron uptake, validating fertigation’s agronomic edge. Suppliers thus prioritize fully soluble chelates packaged in 1-kilogram foil sachets that dissolve instantly in irrigation tanks.
Foliar spraying remains a tactical option for in-season correction and biofortification programs, particularly during reproductive stages when nutrient translocation into grain is critical. While labor-intensive, foliar usage commands premium prices and embeds services such as tissue testing. Integration of sensors and sectional control nozzles further optimizes droplet placement, boosting return on investment and sustaining the Asia-Pacific micronutrient fertilizer market’s technological narrative.
By Crop Type: Field-Crop Stability Set Against Ornamental Upside
Field crops anchored 83.7% of Asia-Pacific micronutrient fertilizer market share in 2024, reflecting the vast 60 million-hectare rice footprint plus wheat and maize acreage concentrated in India and China. State procurement programs and staple-food security imperatives preserve this volume base. Nonetheless, turf and ornamental demand is expanding at a 9.0% CAGR, propelled by municipal landscaping and golf-course builds across urbanizing Association of Southeast Asian Nations (ASEAN) economies. These end-users favor homogenous micro-granules and slow-release coatings that deliver aesthetic benefits and reduce scorch risk.
Horticultural crops sit between the two extremes, registering steady uptake as middle-class diets shift toward fruit and vegetables. Export-oriented growers in Vietnam adhere to stringent residue limits, incentivizing micronutrient use to meet cosmetic standards without boosting synthetic pesticide applications. This balanced demand profile supports resilient revenue expansion for the Asia-Pacific micronutrient fertilizer market.
Note: Segment shares of all individual segments available upon report purchase
Get Detailed Market Forecasts at the Most Granular Levels
Download PDF
Geography Analysis
India anchors the Asia-Pacific micronutrient fertilizer market with a 41.4% share, propelled by 247.4 million Soil Health Cards that spotlight zinc and iron gaps across varied agro-climatic zones[2]Source: Ministry of Agriculture and Farmers Welfare, “Soil Health Card Portal,” soilhealth.dac.gov.in. Lower GST and domestic nano-fertilizer output by IFFCO enhance affordability, while the Geoagro-iKrishi app pushes real-time recommendations to 2 million growers. As a result, micronutrient adoption among smallholders has risen markedly since 2024, reinforcing India’s leadership position.
China contributes a sizable volume through nutrition-focused subsidies that reposition zinc as a public-health input rather than a yield enhancer, aligning agricultural and health ministries toward common goals[3]Source: Nature Publishing Group, “Global Zinc Deficiency Prevalence Study,” nature.com. However, environmental curbs on mining and stricter port checks inject periodic volatility into export flows, compelling downstream players to diversify sourcing. The internal push toward digital farming platforms further refines demand forecasting, benefiting data-integrated suppliers.
Australia delivers the region’s fastest growth, accounting for 8.7% CAGR as protected horticulture acreage widens. Drip-fed blueberry tunnels and high-value greenhouse tomatoes adopt chelated blends that minimize precipitation at alkaline pH, supporting premium price realization. Elsewhere, Bangladesh and Pakistan work to alleviate credit bottlenecks, whereas Indonesia and the Philippines invest in anti-counterfeit enforcement. Combined, these markets provide incremental upside that helps the Asia-Pacific micronutrient fertilizer market achieve its forecast CAGR.
Get Analysis on Important Geographic Markets
Download PDF
Competitive Landscape
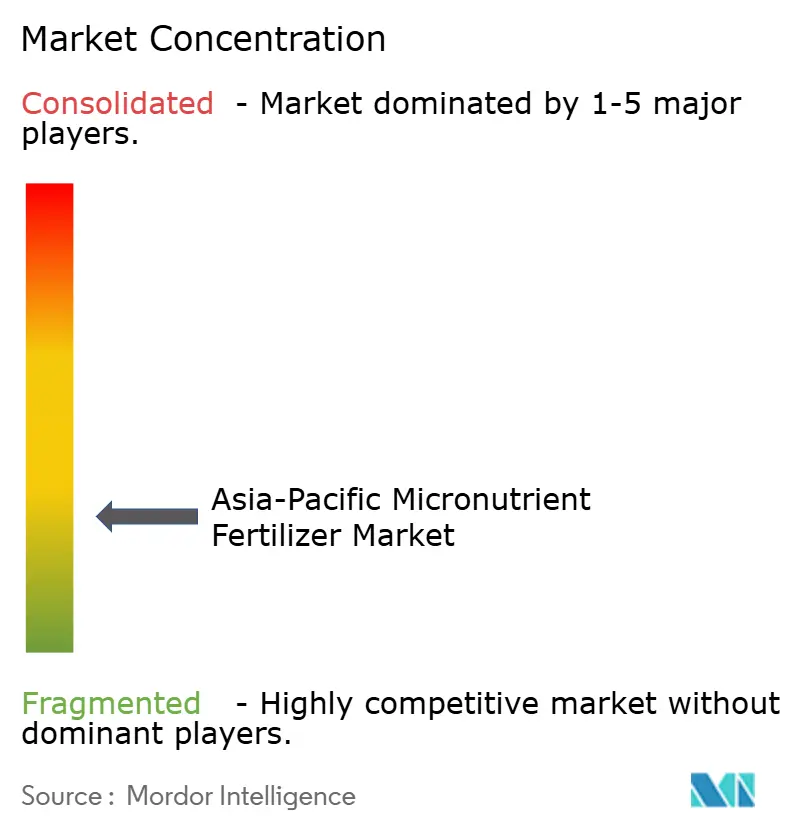
The Asia-Pacific micronutrient fertilizer market exhibits fragmented competition, with the top 5 players controlling a significant market share, creating substantial opportunities for regional specialists and technology innovators to capture market segments through differentiated product offerings and localized distribution strategies. This fragmentation reflects diverse agricultural systems, varying regulatory frameworks, and distinct crop requirements across the region that prevent any single player from achieving dominant market control.
Competition intensity centers on product innovation, particularly in nano-formulations and chelated micronutrients that offer superior bioavailability and application convenience compared to traditional sulfate-based products. Strategic patterns emphasize vertical integration and technology partnerships, with companies like IFFCO developing nano urea plus production capacity of 17 crore bottles annually, while maintaining extensive cooperative distribution networks that reach smallholder farmers directly.
Digital agriculture integration represents a key competitive differentiator, as companies partner with platform providers to deliver precision recommendations that optimize micronutrient applications based on soil testing data and crop monitoring insights. White-space opportunities exist in specialty crop segments, biofortification applications, and emerging markets where agricultural modernization creates demand for advanced micronutrient solutions. The competitive landscape benefits from regulatory frameworks established by bodies like Japan's FAMIC (Food and Agricultural Materials Inspection Center), which ensures product quality standards that support market development and farmer confidence in micronutrient investments.
Asia-Pacific Micronutrient Fertilizer Industry Leaders
Chambal Fertilizers & Chemicals Ltd
Coromandel International Ltd.
Indian Farmers Fertiliser Cooperative Limited
Yara International ASA
Zuari Agro Chemicals Ltd
- *Disclaimer: Major Players sorted in no particular order
Need More Details on Market Players and Competitors?
Download PDF
Recent Industry Developments
- November 2024: Nutrien Ag Solutions has initiated construction on a new USD 70 million distribution center. This larger facility will boost the company's storage capacity for bulk granular fertilizers, including micronutrient fertilizers, by 20%, bringing the total to 130,000 Metric tons.
- May 2024: iffco revealed that the central government greenlit the launch of its two new offerings including nano liquid zinc and nano liquid copper. These innovations aim to address zinc and copper deficiencies in agricultural crops, thereby enhancing productivity.
- May 2023: Yara International announced plans for a new production facility in Yorkshire, UK, focused on specialty crop nutrition products and biostimulants to boost yields and quality. Expected to be operational by late 2025, the plant will double YaraVita production capacity, with potential for further expansion. Nearly all output will be exported to markets around the world, strengthening Yara's micronutrient fertilizer production.
Asia-Pacific Micronutrient Fertilizer Market Report Scope
Boron, Copper, Iron, Manganese, Molybdenum, Zinc, Others are covered as segments by Product. Fertigation, Foliar, Soil are covered as segments by Application Mode. Field Crops, Horticultural Crops, Turf & Ornamental are covered as segments by Crop Type. Australia, Bangladesh, China, India, Indonesia, Japan, Pakistan, Philippines, Thailand, Vietnam are covered as segments by Country.Product
| Boron |
| Copper |
| Iron |
| Manganese |
| Molybdenum |
| Zinc |
| Others |
Application Mode
| Fertigation |
| Foliar |
| Soil |
Crop Type
| Field Crops |
| Horticultural Crops |
| Turf & Ornamental |
Geography
| Australia |
| Bangladesh |
| China |
| India |
| Indonesia |
| Japan |
| Pakistan |
| Philippines |
| Thailand |
| Vietnam |
| Rest of Asia-Pacific |
| Product | Boron |
| Copper | |
| Iron | |
| Manganese | |
| Molybdenum | |
| Zinc | |
| Others | |
| Application Mode | Fertigation |
| Foliar | |
| Soil | |
| Crop Type | Field Crops |
| Horticultural Crops | |
| Turf & Ornamental | |
| Geography | Australia |
| Bangladesh | |
| China | |
| India | |
| Indonesia | |
| Japan | |
| Pakistan | |
| Philippines | |
| Thailand | |
| Vietnam | |
| Rest of Asia-Pacific |
Need A Different Region or Segment?
Customize Now
Market Definition
- MARKET ESTIMATION LEVEL - Market Estimations for various types of fertilizers has been done at the product-level and not at the nutrient-level.
- NUTRIENT TYPES COVERED - Micronutients: Zn, Mn, Cu, Fe, Mo, B, and Others
- AVERAGE NUTRIENT APPLICATION RATE - This refers to the average volume of nutrient consumed per hectare of farmland in each country.
- CROP TYPES COVERED - Field Crops: Cereals, Pulses, Oilseeds, and Fiber Crops Horticulture: Fruits, Vegetables, Plantation Crops and Spices, Turf Grass and Ornamentals
| Keyword | Definition |
|---|---|
| Fertilizer | Chemical substance applied to crops to ensure nutritional requirements, available in various forms such as granules, powders, liquid, water soluble, etc. |
| Specialty Fertilizer | Used for enhanced efficiency and nutrient availability applied through soil, foliar, and fertigation. Includes CRF, SRF, liquid fertilizer, and water soluble fertilizers. |
| Controlled-Release Fertilizers (CRF) | Coated with materials such as polymer, polymer-sulfur, and other materials such as resins to ensure nutrient availability to the crop for its entire life cycle. |
| Slow-Release Fertilizers (SRF) | Coated with materials such as sulfur, neem, etc., to ensure nutrient availability to the crop for a longer period. |
| Foliar Fertilizers | Consist of both liquid and water soluble fertilizers applied through foliar application. |
| Water-Soluble Fertilizers | Available in various forms including liquid, powder, etc., used in foliar and fertigation mode of fertilizer application. |
| Fertigation | Fertilizers applied through different irrigation systems such as drip irrigation, micro irrigation, sprinkler irrigation, etc. |
| Anhydrous Ammonia | Used as fertilizer, directly injected into the soil, available in gaseous liquid form. |
| Single Super Phosphate (SSP) | Phosphorus fertilizer containing only phosphorus which has lesser than or equal to 35%. |
| Triple Super Phosphate (TSP) | Phosphorus fertilizer containing only phosphorus greater than 35%. |
| Enhanced Efficiency Fertilizers | Fertilizers coated or treated with additional layers of various ingredients to make it more efficient compared to other fertilizers. |
| Conventional Fertilizer | Fertilizers applied to crops through traditional methods including broadcasting, row placement, ploughing soil placement, etc. |
| Chelated Micronutrients | Micronutrient fertilizers coated with chelating agents such as EDTA, EDDHA, DTPA, HEDTA, etc. |
| Liquid Fertilizers | Available in liquid form, majorly used for application of fertilizers to crops through foliar and fertigation. |
Need More Details on Market Definition?
Ask a Question
Research Methodology
Mordor Intelligence follows a four-step methodology in all our reports.
- Step-1: IDENTIFY KEY VARIABLES: In order to build a robust forecasting methodology, the variables and factors identified in Step-1 are tested against available historical market numbers. Through an iterative process, the variables required for market forecast are set and the model is built on the basis of these variables.
- Step-2: Build a Market Model: Market-size estimations for the forecast years are in nominal terms. Inflation is not a part of the pricing, and the average selling price (ASP) is kept constant throughout the forecast period for each country.
- Step-3: Validate and Finalize: In this important step, all market numbers, variables and analyst calls are validated through an extensive network of primary research experts from the market studied. The respondents are selected across levels and functions to generate a holistic picture of the market studied.
- Step-4: Research Outputs: Syndicated Reports, Custom Consulting Assignments, Databases & Subscription Platforms

Get More Details On Research Methodology
Download PDF


