
Micro Lending Market Size and Share
Market Overview
| Study Period | 2020 - 2031 |
|---|---|
| Market Size (2026) | USD 260.8 Billion |
| Market Size (2031) | USD 428.3 Billion |
| Growth Rate (2026 - 2031) | 10.42 % |
| Fastest Growing Market | Asia Pacific |
| Largest Market | Asia Pacific |
| Market Concentration | Medium |
Major Players *Disclaimer: Major Players sorted in no particular order Image © Mordor Intelligence. Reuse requires attribution under CC BY 4.0. | |
Micro Lending Market Analysis by Mordor Intelligence
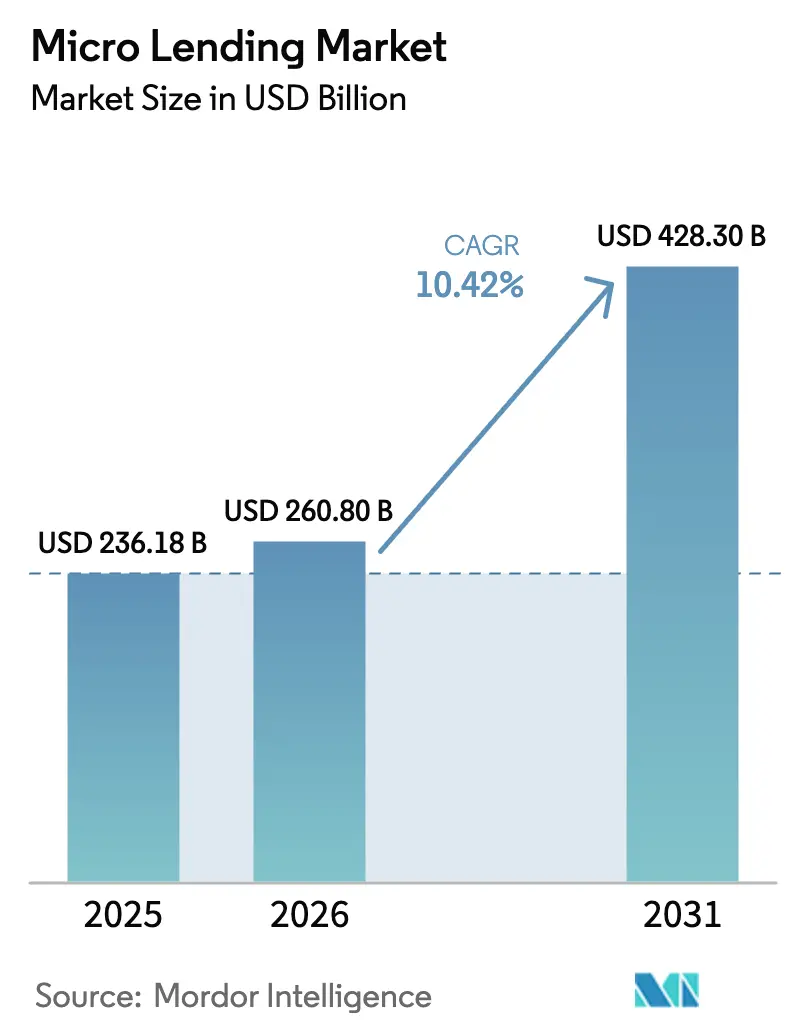
The micro lending market size was valued at USD 236.18 billion in 2025 and estimated to grow from USD 260.8 billion in 2026 to reach USD 428.3 billion by 2031, at a CAGR of 10.42% during the forecast period (2026-2031). Expansion is anchored in digital onboarding, alternative-data credit scoring, and government inclusion mandates that collectively unlock new borrower cohorts. The micro lending market benefits from fintech cost advantages that compress acquisition costs by 60-70%, allowing rapid scale in geographies where branch infrastructure remains thin. Growing participation from impact-driven and ESG-linked funds is broadening the capital base, while embedded-finance partnerships move loans closer to real-time checkout experiences. At the same time, the micro lending market faces tempering forces such as post-pandemic portfolio stress and capital adequacy rules that raise funding hurdles for tier-2 institutions, yet well-capitalized providers with credible risk models continue to capture share.
Key Report Takeaways
- By institution, microfinance institutions and other non-bank lenders held 61.45% of the micro lending market share in 2025, while the cohort is projected to post a 12.28% CAGR to 2031.
- By end-user, business lending accounted for 65.10% share of the micro lending market size in 2025, and the segment is expected to advance at an 11.08% CAGR through 2031.
- By channel, the offline segment captured 61.30% share of the micro lending market in 2025; the online channel is forecasted to expand at a 14.19% CAGR to 2031.
- By region, Asia-Pacific led with 43.20% of micro lending market share in 2025, and the segment is set to register the fastest regional CAGR at 12.74% through 2031.
Note: Market size and forecast figures in this report are generated using Mordor Intelligence’s proprietary estimation framework, updated with the latest available data and insights as of 2026.
Market Trends and Insights
Drivers Impact Analysis of Micro Lending Market*
| Driver | (~) % Impact on CAGR Forecast | Geographic Relevance | Impact Timeline |
|---|---|---|---|
| Fintech & mobile-first customer acquisition boom | +2.8% | Global, with Asia-Pacific and Latin America leading adoption | Medium term (2–4 years) |
| Government financial-inclusion mandates & subsidies | +2.1% | Emerging markets, particularly India, Bangladesh, and Sub-Saharan Africa | Long term (≥4 years) |
| Surge in impact/ESG-linked micro-credit funds | +1.4% | Global, with concentrated activity in North America and Europe | Medium term (2–4 years) |
| Expansion of P2P / marketplace platforms into MSE lending | +1.2% | Developed markets expanding to emerging economies | Short term (≤2 years) |
| Embedded-finance loans at e-commerce & POS check-out | +0.9% | North America, Europe, and urban centers in Asia-Pacific | Short term (≤2 years) |
| AI-based alternative-data scoring unlocking “thin-file” borrowers | +1.8% | Global, with fastest adoption in Asia-Pacific and Latin America | Medium term (2–4 years) |
| Source: Mordor Intelligence | |||
Fintech & Mobile-first Customer Acquisition Boom
Mobile-centric lenders deploy AI to analyze more than 70,000 data points from devices, thereby scoring thin-file borrowers at scale. Customer acquisition costs are 60-70% lower than branch models, permitting profitable ticket sizes as small as USD 40 while maintaining default rates near 5% [1]Harvard Business School, “Fintech Lending in Emerging Markets,” hbs.edu. Success in Kenya and Mexico illustrates how rapid disbursement deepens client income and loyalty, reinforcing a virtuous cycle of repeat borrowing. Fintech scalability continues to pull capital into the micro lending market, especially as platforms prove that digital repayment footprints create predictive risk signals. The result is a rising share of micro lending market originations occurring entirely on smartphones, with lenders in markets such as the Philippines onboarding 1 million customers in 10 months.
Government Financial Inclusion Mandates & Subsidies
Policies such as India’s Open Credit Enablement Network or the U.S. National Strategy for Financial Inclusion are lowering onboarding friction, standardizing data sharing, and offering guarantee schemes that derisk lender exposure. Collateral-free guarantee programs already cover 10 million loans, catalyzing business lending demand that dominates the micro lending market. Subsidized interest windows and refinancing facilities blunt pandemic-era stress, ensuring liquidity to smaller MFIs. Over the long term, coordinated frameworks that link identity, payments, and credit are expected to expand the addressable customer pool by tens of millions.
Surge in Impact/ESG-linked Micro-credit Funds
Impact investors channel fresh capital toward inclusive finance, motivated by gender, climate, and poverty metrics that can be measured credibly at the loan-book level. Dedicated green-lending windows reward projects that cut emissions or advance female entrepreneurship, helping borrowers secure lower pricing. Islamic sustainable-finance structures add momentum by mobilizing faith-aligned pools of capital that favor risk-sharing. Institutions able to document social outcomes increasingly access concessional funding at spreads 100-150 bp below commercial lines, enhancing their competitiveness in the micro lending market.
Expansion of P2P / Marketplace Platforms into MSE Lending
Marketplace lenders originally built for consumer credit now pivot to micro-enterprise financing, chasing a USD 4.9 trillion credit gap. Proprietary cash-flow underwriting and API links to e-commerce sites shorten approval cycles from days to minutes, positioning platforms to capture fast-turnover working-capital demand. Regulators in markets such as Singapore and Mexico are crafting proportional capital and disclosure regimes that legitimize these non-bank models, further widening the addressable supply for the micro lending market.
Restraints Impact Analysis of Micro Lending Market*
| Restraint | (~) % Impact on CAGR Forecast | Geographic Relevance | Impact Timeline |
|---|---|---|---|
| Post-pandemic spike in portfolio-at-risk & write-offs | −1.8% | Global, with acute impact in Sub-Saharan Africa and South Asia | Short term (≤2 years) |
| Rate-caps & tightening consumer-protection rules | −1.2% | Developed markets and emerging economies with mature regulatory frameworks | Medium term (2–4 years) |
| Climate-driven agri borrower defaults in rural cohorts | −0.9% | Rural areas in climate-vulnerable regions, particularly South Asia and Sub-Saharan Africa | Long term (≥4 years) |
| Basel-III risk-weight hikes starving tier-2 MFIs of bank credit | −1.4% | Global, with European MFIs experiencing the largest impact | Medium term (2–4 years) |
| Source: Mordor Intelligence | |||
Post-pandemic Spike in Portfolio-at-risk & Write-offs
Lockdowns disrupted cash flows for millions of micro-entrepreneurs, pushing PAR30 ratios to multi-year highs and forcing lenders to restructure sizable portions of their loan books. Africa’s default rate reached 6.7% in 2024, well above the 4.1% global mean[2]International Finance Corporation, “Global Microfinance Portfolio Review,” ifc.org. Although repayments have gradually normalized, risk costs remain elevated for rural and informal borrowers, limiting immediate balance-sheet growth. Providers with diversified funding and granular data tracking have resumed originations faster, but the episode reinforces the sensitivity of the micro lending market to external shocks.
Rate Caps & Tightening Consumer-protection Rules
New usury ceilings in Kenya, Indonesia, and parts of Latin America compress net interest margins for lenders serving the riskiest clients. Simultaneously, operational-resilience and climate-risk regulations derived from Basel III and DORA add compliance overhead. Some tier-2 MFIs face higher funding costs or exit certain provinces altogether, temporarily slowing geographic expansion in the micro lending market. Innovation in cost-light digital delivery partially offsets these pressures, but the regulatory pendulum is expected to restrain aggressive pricing strategies over the medium term.
*Our forecasts treat driver/restraint impacts as directional, not additive. The impact forecasts reflect baseline growth, mix effects, and variable interactions.
Micro Lending Market Segment Analysis
By Institution:
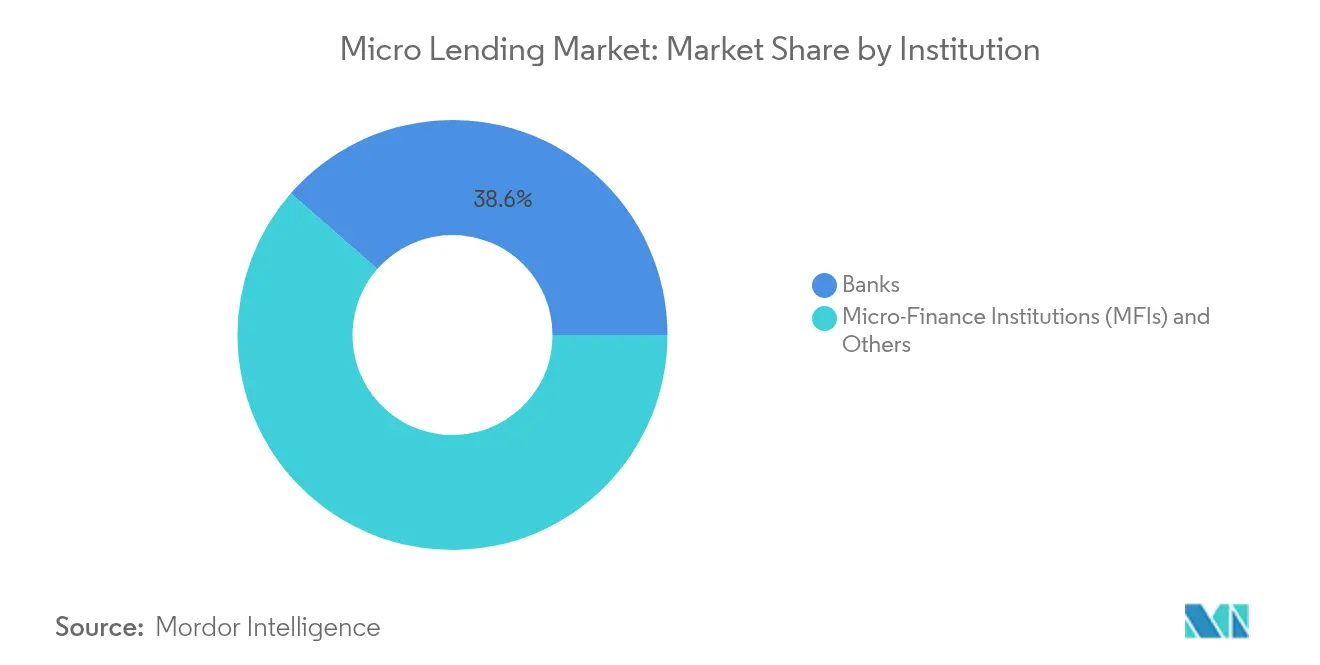
MFIs Extend Specialized LeadershipMFIs and other non-bank lenders commanded 61.45% of the micro lending market share in 2025, and the segment is projected to compound at 12.28% annually through 2031. The segment’s dominance is rooted in low operating costs, mission-aligned funding, and field-agent intimacy that sustain loyalty among thin-file borrowers. Those attributes translate into quick disbursement and flexible repayment options, giving MFIs a cost-to-income advantage of 10-15 percentage points over banks in comparable ticket sizes.
Banks maintain relevance through partnerships, captive subsidiaries, and securitization channels that recycle on-balance-sheet portfolios into capital-market paper. Yet Basel III capital inflation of 4.9% for European Group 1 banks continues to divert scarce lending headroom toward lower-risk asset classes, indirectly steering smaller borrowers toward specialized MFIs. Securitization hubs such as Luxembourg offer a liquidity valve by converting seasoned micro-loan pools into tradable instruments, a model that now represents roughly 8% of the micro lending market size traded in secondary form.


By End-User:
Business Lending Underpins GrowthBusiness lending represented 65.10% of the micro lending market in 2025 and is forecasted to grow at 11.08% CAGR, reflecting acute credit gaps for micro-enterprises that power local employment. Asia-Pacific alone hosts 98.7% of micro, small, and medium enterprises out of total business establishments, translating to persistent working-capital demand unmet by traditional banks. Collateral-free guarantee schemes and invoice-financing APIs now route capital in under 48 hours, propelling business-loan share gains within the micro lending market size.
Retail micro credit remains a vital inclusion gateway, but regulators increasingly encourage transition from consumption toward income-generating loans. Digital payroll links, inventory analytics, and supply-chain data help lenders structure cash-flow-based repayments, lowering default risk by 200–300 bp relative to equal-instalment consumer products. The confluence of policy and technology keeps micro-enterprise financing at the forefront of the micro lending market demand.
By Channel:
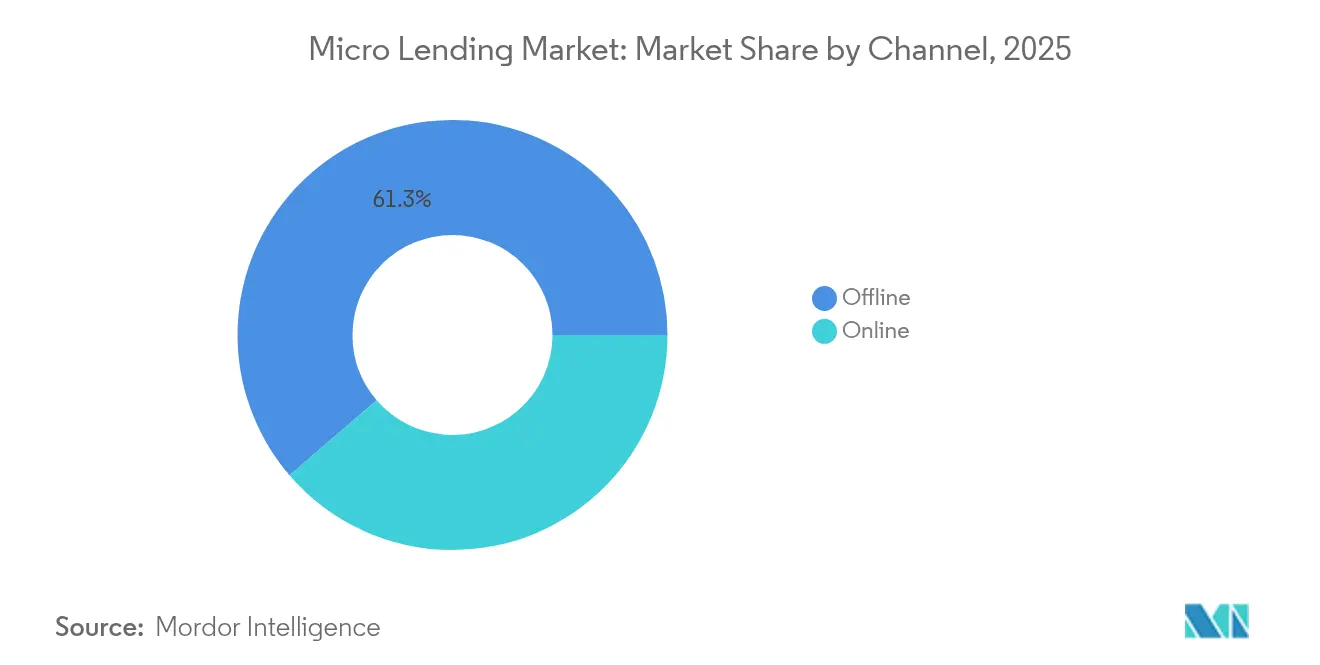
Online Adoption AcceleratesOffline segment accounted for 61.30% of the micro lending market in 2025, but the online channel is on pace for a 14.19% CAGR to the end of the decade as smartphones become de facto branches. Digital adoption directly lifts GDP per capita by 0.10 percentage point and trims informal employment by 0.06 percentage point, reinforcing a structural tilt to online origination. The micro lending market benefits when borrowers repay via wallets because automated reminders and biometric log-ins raise on-time repayments by up to 8 percentage points.
Trust remains a barrier in low-literacy pockets, so leading MFIs blend agent visits with in-app tutorials, guiding first-time users through biometric onboarding. Embedded-finance tools further embed loan offers at e-commerce checkout, compressing decision time to seconds and widening reach to digitally native youth segments. In Tajikistan, Bank Arvand’s digital upgrade pushed self-service transactions to 65%, illustrating how hybrid models can grow share without alienating rural clients.
Geography Analysis
APAC Micro Lending Market
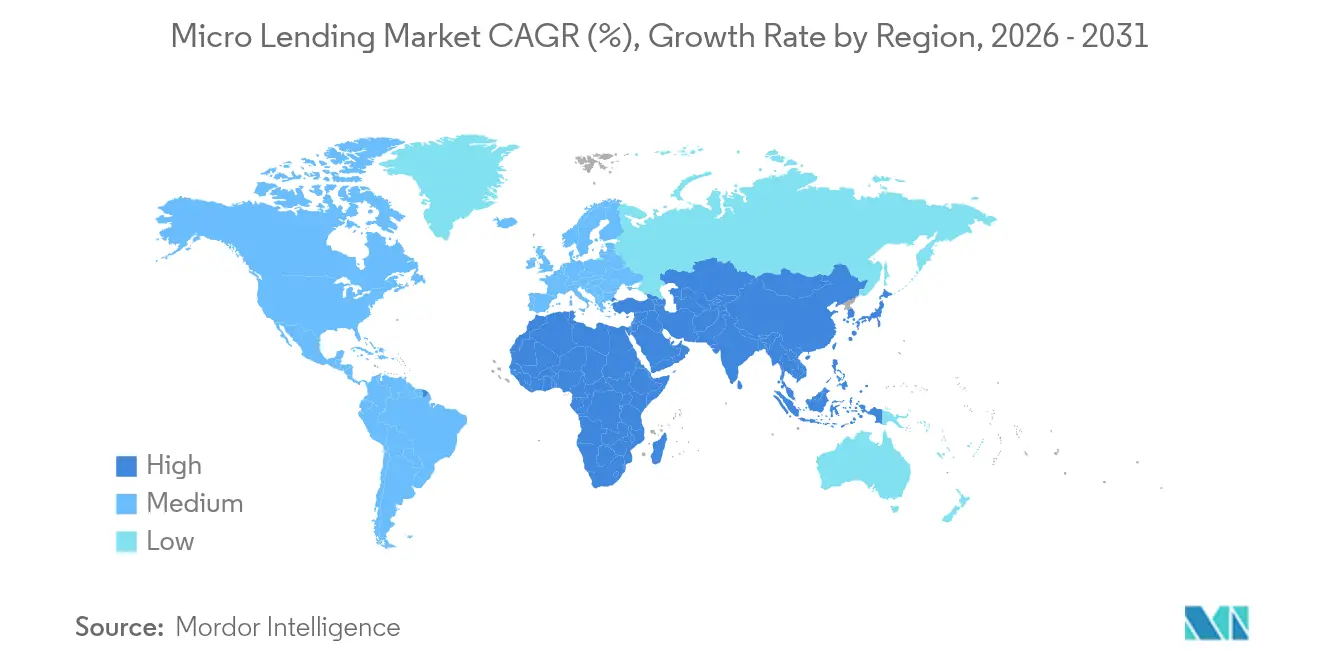
Asia-Pacific held 43.20% share of the micro lending market in 2025 and is projected to compound at 12.74% through 2031. Massive unbanked populations and real-time payment rails like India’s UPI create fertile ground for scale. Government programs anchor demand: Jan Dhan accounts surpass 500 million, offering lenders authenticated identity and transaction histories that compress KYC costs by 80%. Fintech partnerships embed credit within everyday super-apps, making India, Indonesia, and the Philippines hotspots for digital disbursement.
LATAM Micro Lending Market
Latin America and the Caribbean contribute a smaller yet rapidly expanding slice of the micro lending market. IDB-backed investments funnel capital to women-owned businesses, and companies such as Tala leverage alternative data to underwrite 3 million Mexican customers with USD 500 million disbursed in 2024. Institutional trust markedly influences digital adoption; individuals expressing higher trust show a 62% greater likelihood of using mobile payments. That trust dividend underpins robust loan growth as borrowers migrate from payday shops to app-based credit.
Sub-Saharan Africa Micro Lending Market
Sub-Saharan Africa combines opportunity with portfolio risk. Mobile-money rails pioneered in Kenya yield unrivaled distribution reach, yet climate-induced crop failures raise defaults in agri books. Regional default rates stayed elevated at 6.7% in 2024, compared with the micro lending market global average of 4.1%. Innovative hybrids like micro-insurance plus micro-credit aim to hedge weather shocks, and regulators encourage digital sandboxes to test such solutions. Over time, improved risk pooling is expected to narrow loss-given-default and unlock further expansion.

Regulatory Landscape
Micro lending regulation continues to tighten around borrower protection, data reporting, and proportional supervision of non-bank models, with divergent approaches across regions. In the United States, the CFPB issued a final rule on May 1, 2026 amending the small business lending rule under Regulation B (Section 1071), effective June 30, 2026, with compliance dates extending to January 1, 2028. The changes reshape which originations fall under mandatory data collection, including revisions such as higher coverage thresholds and carve-outs cited in the rule updates. At the same time, state-level commercial finance disclosure frameworks have expanded where federal coverage is uneven, with Texas House Bill 700 taking effect in September 2025 and New York's FAIR Business Practices Act effective February 17, 2026, increasing disclosure and compliance requirements for certain small business financing products.
In high-volume emerging markets, microfinance-specific rulebooks remain a core operating constraint for regulated entities and partner banks. The Reserve Bank of India maintains a dedicated framework for microfinance loans, including board-approved pricing policies for regulated entities, while global prudential norms continue to influence bank funding lines to MFIs through Basel Committee on Banking Supervision principles that differentiate supervision expectations between deposit-taking and non-deposit taking providers. Consumer-credit style obligations are also widening into adjacent credit delivery models, with BNPL and embedded-finance lending increasingly pulled toward Truth in Lending Act style disclosures, dispute handling, and oversight expectations. This raises the compliance bar for platforms that distribute credit inside commerce or software interfaces.
Value Chain Analysis
The micro lending value chain begins with borrower acquisition through field agents, branches, and increasingly digital channels, followed by identity and eligibility checks (KYC/CIP), credit assessment, loan origination, servicing, and collections. Digital-first underwriting is shifting the assessment layer toward alternative data inputs, such as transaction footprints, purchase behavior, and merchant signals. This shortens decision cycles and reduces unit costs compared with manual appraisal. Distribution is also broadening through embedded-finance partners such as retailers, marketplaces, and gig platforms that surface loan offers at the point of need, adding a platform layer to the traditional lender-borrower relationship.
Funding and risk-transfer sit upstream of origination and materially shape lender capacity, with capital sourced from deposits (banks), wholesale borrowing, impact/ESG-linked funds, and securitization structures that recycle seasoned portfolios. Standard-setting and capability building increasingly support the chain, as networks and technical partners disseminate risk management, cybersecurity, and governance practices across MFI portfolios. Supervisory expectations informed by bodies such as the Basel Committee on Banking Supervision also affect how banks extend credit lines and manage exposures to micro-lenders. Compliance and disclosure requirements, including TILA-linked obligations for certain embedded credit facilitation, increasingly span distribution, underwriting, and servicing, creating demand for regtech, reporting workflows, and auditability across the value chain.
Competitive Landscape
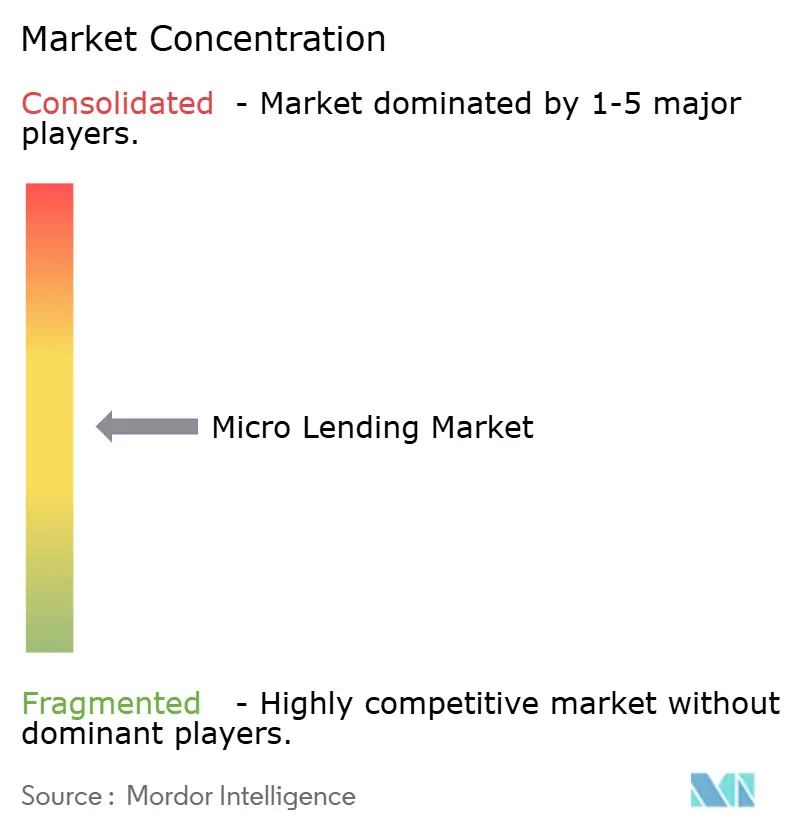
The micro lending market displays moderate concentration but sharp regional contrasts. In Asia-Pacific, incumbents such as Grameen, Bandhan, and BTPN Syariah collectively hold a considerable market share, whereas Latin America remains fragmented across hundreds of cooperatives and fast-scaling fintechs. Digital entrants enjoy acquisition costs up to 70% lower than traditional branches, allowing aggressive pricing while sustaining 10-point net-interest margins. Incumbents respond by launching mobile apps and entering API alliances that keep them visible within embedded-finance ecosystems.
Strategic investments accelerate technology adoption. TJ-based Bank Arvand secured a minority investment from Japan’s Gojo to ramp up cloud migration and AI scoring. Tala raised USD 150 million of debt underwritten by institutional investors, earmarking flexible limits and dynamic pricing for small business borrowers. Apple’s integration of BNPL provider Affirm into Apple Pay shows how global tech can insert lending at checkout, potentially siphoning affluent users from local MFIs in developed markets.
White-space remains vast in rural corridors where smartphone penetration lags or agents still carry paper ledgers. Players leveraging satellite imagery for crop estimates or cooperative data for community-based guarantees increasingly differentiate their credit models. Blockchain pilots for remittance-backed loans and tokenized securitizations inch forward, although regulation and cost keep adoption nascent. Over the next five years, the competitive edge will likely hinge on how well lenders harness alternative data while meeting heightening consumer-protection standards without inflating costs.
Micro Lending Industry Leaders
Accion International
BlueVine Inc.
Funding Circle
Kabbage Inc.
OnDeck
- *Disclaimer: Major Players sorted in no particular order
Micro Lending Market Companies Covered in this Report
- Accion International
- BlueVine Inc.
- Funding Circle
- Kabbage Inc.
- OnDeck
- Fundbox
- LendingClub Bank
- Zopa Bank Ltd.
- Grameen Bank
- Kiva
- Bandhan Bank
- CreditAccess Grameen
- VisionFund International
- Banco Compartamos (Gentera)
- FINCA International
- Ujjivan Small Finance Bank
- Tala
- Jumo
- Karandaaz
- Musoni

Market Opportunities and Future Outlook
Opportunity concentrates where digital onboarding, alternative-data scoring, and policy-led inclusion rails intersect to unlock thin-file borrowers and micro-enterprise working capital demand. Programs that standardize identity, payments, and consented data sharing create operational whitespace for lenders to integrate into everyday transaction flows, with India's inclusion infrastructure, including UPI-linked activity and Jan Dhan scale, illustrating how authenticated identity and payment histories reduce onboarding friction and KYC cost burdens at scale. In the United States, the CFPB's May 2026 amendments to Regulation B Section 1071 and the rise of state commercial finance disclosure regimes, including Texas HB 700 and New York's FAIR Business Practices Act, increase the value of compliant, automated reporting and disclosure toolchains, favoring lenders and platforms that can embed credit while maintaining auditable data governance.
Product-led approaches around micro and small business workflows also offer a practical expansion lane, since lending conversion improves when credit is bundled with invoicing, bookkeeping, and payments. Recent platform moves point in this direction, including Bluevine's partnerships and feature launches that connect banking, invoicing, and onboarding for broader small business owner cohorts, and Funding Circle's integration of digital wallet rails for credit products. Another opportunity area is climate-resilience and sustainability-linked micro-credit, where portfolio stress in climate-vulnerable rural cohorts and rising institutional demands for environmental risk management tools increase the need for underwriting models that incorporate climate and cash-flow variability while keeping costs low. Cross-border micro and small business segments also open up where lenders can combine compliant onboarding with embedded distribution and remittance-linked cash-flow visibility, though execution remains tied to local infrastructure and supervisory acceptance of new data sources.
Recent Industry Developments in Micro Lending Market
- July 2026: Bluevine Inc. expands digital banking platform to include international resident owners of U.S. businesses, enabling digital onboarding via CIP. The expansion broadens cross-border small business banking and onboarding capability. The move widens addressable SMB market and strengthens embedded-finance potential in the micro-lending ecosystem.
- February 2026: Funding Circle integrated Google Pay for its Cashback business credit card and FlexiPay products, expanding digital wallet capabilities following Apple Pay in January 2026. This enhances acceptance, user convenience, and real-time payments for SME credit products. The integration accelerates adoption of cash-back and flexible financing within digital wallet ecosystems and reinforces competitive positioning in SME lending.
- January 2026: Funding Circle finalized an agreement for the sale of its U.S. business to iBusiness Funding for £33 million, involving surrender of its SBLC license. The reconfiguration directly changes Funding Circle's US footprint and regulatory license status. The move refocuses regional strategy toward profitable markets and could reallocate capital and risk in cross-border SME lending.


Micro Lending Market Report Scope and Research Methodology
Market Definition and Coverage
In this methodology, the market covers the total value of micro loans disbursed and outstanding through formal and semi-formal lenders, across consumer and micro business borrowers, measured in nominal USD across the covered regions and channels.
Scope exclusions: Informal borrowing between individuals, non-loan grants, and purely charitable transfers are excluded when they are not structured as repayable credit.
Segments Covered in This Report
- By Institution
- Banks
- Micro-Finance Institutions (MFIs) and Others
- By End-Users
- Businesses
- Retail (Consumers)
- By Channel
- Online
- Offline
- By Region
- North America
- United States
- Canada
- Mexico
- South America
- Brazil
- Argentina
- Chile
- Colombia
- Rest of South America
- Europe
- United Kingdom
- Germany
- France
- Spain
- Italy
- Benelux (Belgium, Netherlands, and Luxembourg)
- Nordics (Sweden, Norway, Denmark, Finland, and Iceland)
- Rest of Europe
- Asia-Pacific
- China
- India
- Japan
- South Korea
- Australia
- South-East Asia (Singapore, Indonesia, Malaysia, Thailand, Vietnam, and Philippines)
- Rest of Asia-Pacific
- Middle East and Africa
- United Arab Emirates
- Saudi Arabia
- South Africa
- Nigeria
- Rest of Middle East and Africa
- North America
Data Sources, Market Sizing, and Validation
Desk Research
Desk research was used to frame the demand and supply context that micro lending depends on, before we put any numbers into the model. We reviewed public financial inclusion and household finance indicators, plus lending rules that shape who can borrow and what can be offered in each market.
Sources were taken from reputable public bodies and industry references such as the World Bank (Global Findex and financial sector data), IMF financial access indicators, BIS and national central bank publications on credit conditions, OECD statistics where relevant, and country regulator releases on non-bank lenders. We also used company annual reports, investor presentations, and audited filings to interpret product mix, portfolio trends, and reported yields. For cross-checks, paid subscriptions for company financials, patent databases, and shipment-level import or export records were referenced when they helped validate device-led onboarding trends and operational scale signals. This desk research list is illustrative only, and many other sources were also used for data collection, validation, and clarification.
Primary Interviews and Surveys
Primary work focused on validating what portion of small-ticket lending should be counted as micro lending in practice, and how quickly digital origination is shifting channel mix. We spoke with lenders, risk and underwriting specialists, field operations leaders, and ecosystem stakeholders across key regions so gaps in desk data could be filled and assumptions could be stress-tested before totals were finalized.
Distribution of primary research fieldwork respondents
| Company type | Respondent position | Region |
|---|---|---|
| Top tier: 35% | CXOs: 15% | APAC: 43% |
| Mid tier: 50% | Functional/Unit leaders: 31% | EMEA: 36% |
| Smaller Players: 15% | Managers: 54% | Americas: 21% |
Market-Sizing & Forecasting
The sizing starts from a top-down build where financial access and credit depth indicators are used to reconstruct an addressable small-loan pool by region, and then filtered through micro loan ticket sizes, borrower mix, and formal channel penetration. We then corroborate the totals using selective bottom-up approximations such as sampled lender portfolio roll-ups, channel checks on online versus offline disbursals, and ASP times volume sanity checks where the data is consistent.
Key inputs used in the model include micro loan average ticket size ranges, active borrower counts and repeat-borrowing behavior, digital onboarding adoption, delinquency and write-off trends that affect sustainable supply, and the split between consumer and micro enterprise use. Because some geographies do not publish clean micro lending series every year, gaps were handled through proxy indicators like financial inclusion changes, mobile and internet access direction, and lender-reported portfolio trends, which are then adjusted during expert calls.
For forecasting, scenario analysis is used first to reflect different credit cycle paths, followed by a lighter ARIMA trend check on historical market movement where time series are available. The final forecast path is set only after our assumptions on channel shift, borrower growth, and portfolio quality are aligned with what primary respondents are seeing on the ground.
Data Validation & Update Cycle
Outputs are checked against independent signals such as reported loan books, borrower growth direction, and region-level credit conditions, and then any outliers are traced back to the specific assumption that caused the jump. A second analyst review is completed so unit logic, currency handling, and growth drivers are consistent across regions and the final narrative.
The report is refreshed annually, and interim updates are triggered when a material change occurs, such as regulation shifts, funding constraints, or a sudden portfolio quality event that changes disbursal behavior. Before delivery, an analyst performs a fresh pass on the latest public releases and primary notes so clients receive the most current view we can support.
Mordor Intelligence's Micro Lending Market Sizing Compared With Other Published Estimates
Published market values for micro lending often differ because the boundary between microfinance, small business lending, and broader digital consumer credit is not drawn the same way by every publisher. Differences also come from how online channels are counted, how currency conversion is timed, and whether estimates rely more on reported loan books or on modeled demand pools.
Reported loan portfolio disclosures and financial access indicators are the checks that keep Mordor Intelligence's estimate tied to formal and semi-formal micro credit activity, instead of drifting into adjacent unsecured lending that exceeds typical micro ticket sizes. Gaps also show up when one estimate uses an aggressive borrower growth path, or when delinquency assumptions are not refreshed after a credit cycle shift, which can inflate sustainable disbursal expectations.
Benchmark comparison
| Source | Market Size | Gaps in Research Methodology |
|---|---|---|
| Mordor Intelligence | USD 236.18 B (2025) | |
| Trade Journal A | USD 50.24 B (2025) | Uses a narrower definition that appears to focus on platform-led micro loans and specific digital models, which can exclude traditional microfinance institutions and bank-led micro credit volumes. |
| Industry Publisher B | USD 16.10 B (2024) | Likely limits the scope to selected geographies or product types and may treat micro lending as a niche fintech category, which reduces the counted loan base compared with a broader formal and semi-formal lending view. |
Taken together, the spread is mostly explained by what gets included as micro lending and how much of the traditional lender base is captured in the math. Our approach keeps the scope rules explicit and then ties the model to observable borrower and portfolio signals, which makes the final number easier to repeat and audit over time.


Key Questions Answered in the Report
What is the current size of the micro lending market?
The micro lending market is valued at USD 260.8 billion in 2026 and is projected to reach USD 428.3 billion by 2031.
Which region holds the largest share of the micro lending market?
Asia-Pacific leads with 43.20% of the micro lending market share in 2025, driven by large unbanked populations and supportive inclusion policies.
Why is business lending the dominant end-user segment?
Business lending captured 65.10% of the micro lending market in 2025 because micro-enterprises represent the majority of employers in emerging economies and seek flexible working-capital solutions that mainstream banks often cannot provide.
Which is the fastest growing region in Micro Lending Market?
Asia-Pacific is estimated to grow at the highest CAGR over the forecast period (2026-2031).
Which region has the biggest share in Micro Lending Market?
In 2025, the Asia Pacific accounts for the largest market share in Micro Lending Market.
How fast is the online channel growing in the micro lending market?
Online micro-loan originations are forecast to grow at a 14.19% CAGR through 2031 as mobile-first platforms broaden reach and embed credit into digital commerce.
What are the key risks facing the micro lending industry?
Portfolio-at-risk spikes post-pandemic, rate caps, and new consumer-protection regulations pose near-term challenges by pressuring margins and raising compliance costs.
How are ESG considerations influencing micro lending?
Impact and ESG-linked funds supply concessional capital to lenders that demonstrate measurable social or environmental outcomes, encouraging growth in gender-focused and green micro-credit products.
Page last updated on:


 Your data is secure and never sold or shared.


