
Market Overview
| Study Period | 2021 - 2031 |
|---|---|
| Forecast Data Period | 2026 - 2031 |
| Base Year Market Size (2025) | 13.94 gigawatt |
| Market Volume (2026) | 15.92 gigawatt |
| Market Volume (2031) | 30.9 gigawatt |
| Growth Rate (2026 - 2031) | 14.18 % |
| Market Concentration | Medium |
Major Players *Disclaimer: Major Players sorted in no particular order Image © Mordor Intelligence. Reuse requires attribution under CC BY 4.0. | |
Mexico Solar Photovoltaic (PV) Market Analysis by Mordor Intelligence
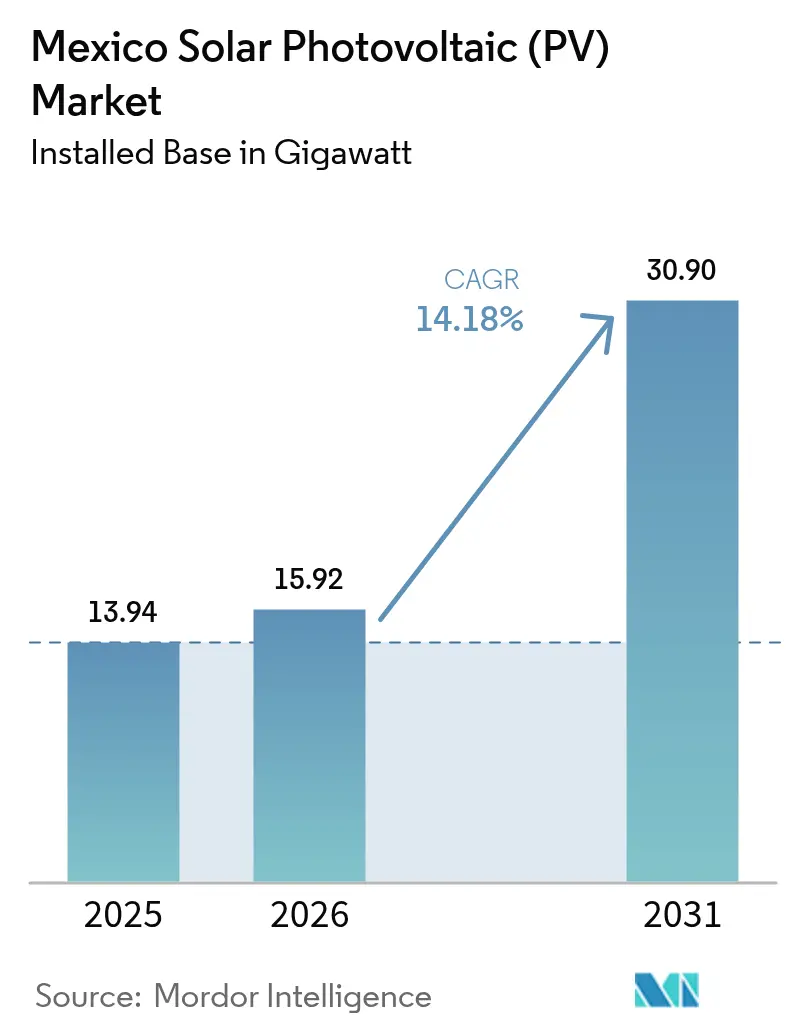
Mexico Solar Photovoltaic Market size in terms of installed base in 2026 is estimated at 15.92 gigawatt, growing from 2025 value of 13.94 gigawatt with 2031 projections showing 30.9 gigawatt, growing at 14.18% CAGR over 2026-2031.
This growth continues despite a stricter regulatory framework that now reserves 54% of national generation for the Federal Electricity Commission (CFE). Strong policy backing for 45% renewable electricity by 2030, falling hardware prices, and manufacturing nearshoring are driving capacity additions. State-led utility parks, such as the 457.211 MW Puerto Peñasco complex, headline new public investments, while private developers pivot toward distributed generation and joint-venture structures. Financing costs in pesos and interconnection delays do temper momentum, yet industrial demand in northern clusters and revived clean-energy auctions keep the expansion path intact.
Key Report Takeaways
- By grid type, on-grid systems accounted for 95.05% of the Mexico solar energy market size in 2025, whereas off-grid solutions are forecast to progress at a 20.7% CAGR through 2031.
- By end-user, the utility-scale segment captured 61.85% of the Mexican solar energy market size in 2025, while the residential sector is set to grow at an 18.4% CAGR through 2031.
- By company concentration, CFE, Enel, and Iberdrola jointly accounted for a major share of installed utility capacity in 2025.
Note: Market size and forecast figures in this report are generated using Mordor Intelligence’s proprietary estimation framework, updated with the latest available data and insights as of 2026.
Mexico Solar Photovoltaic (PV) Market Trends and Insights
Drivers Impact Analysis*
| Driver | (~) % Impact on CAGR Forecast | Geographic Relevance | Impact Timeline |
|---|---|---|---|
| Falling module & BOS prices | +2.1% | Global, with strongest impact in Northern Mexico clusters | Medium term (2-4 years) |
| Surge in C&I net-metering rooftop adoption | +1.8% | National, concentrated in industrial centers like Monterrey, Guadalajara, Mexico City | Short term (≤ 2 years) |
| Puerto Peñasco "gigapark" catalysing northern cluster build-outs | +1.5% | Northern Mexico (Sonora, Chihuahua, Coahuila) | Medium term (2-4 years) |
| Revived clean-energy auctions under Sheinbaum administration | +1.4% | National, with priority regions in high-irradiance states | Long term (≥ 4 years) |
| Corporate PPAs from near-shoring manufacturers | +1.2% | Border states and manufacturing corridors (Nuevo León, Baja California, Tamaulipas) | Medium term (2-4 years) |
| Domestic PV cell fab investments lowering import dependence | +0.8% | National, with manufacturing hubs in central Mexico | Long term (≥ 4 years) |
| Source: Mordor Intelligence | |||
Falling Module & BOS Prices
Global price declines in photovoltaic modules and balance-of-system hardware bolster project economics, especially in northern Mexico, where the resource profile yields high capacity factors. Trina Solar projects 20% growth in Latin American demand, while First Solar’s expanded US capacity lowers logistics costs for Mexican buyers. With 85% of Mexican territory receiving strong irradiation, parity is accelerating for commercial and industrial buyers [1].
Surge in C&I Net-Metering Rooftop Adoption
Distributed generation limits rose from 0.5 MW to 0.7 MW, spurring corporate rooftop rollouts. Residential interconnection contracts climbed to 367,207 in 2024, and Grupo Bachoco installed 26 MW across 19 states, producing 77,000 MWh annually.
Puerto Peñasco "Gigapark" Catalysing Northern Cluster Build-Outs
The 457.211 MW Puerto Peñasco site generates 1.04 TWh yearly and cuts 1.4 million t of CO₂, anchoring a northern solar corridor that now attracts complementary projects like Puerto Libertad’s 317.5 MW array. Tesla’s Monterrey plant plans to source power from these facilities.
Corporate PPAs from Near-Shoring Manufacturers
Nearshoring drove USD 4.69 billion of EV investments in early 2024, with forecast production of 161,000 units; corporates seek long-term PPAs for renewable supply. USMCA content rules magnify this pull.
Restraints Impact Analysis*
| Restraint | (~) % Impact on CAGR Forecast | Geographic Relevance | Impact Timeline |
|---|---|---|---|
| Grid-connection queue bottlenecks at CENACE | -1.6% | National, most acute in high-demand regions (Central Mexico, Northern industrial zones) | Short term (≤ 2 years) |
| 54% CFE dispatch cap curbing private projects | -1.3% | National, affecting all utility-scale private developments | Medium term (2-4 years) |
| Peso-denominated financing costs amid high policy rates | -0.9% | National, with higher impact on domestic developers vs international players | Short term (≤ 2 years) |
| Land-acquisition conflicts in Sonora & Oaxaca | -0.7% | Regional, primarily Sonora and Oaxaca states with indigenous land rights issues | Long term (≥ 4 years) |
| Source: Mordor Intelligence | |||
Grid-Connection Queue Bottlenecks at CENACE
Over 5 GW of wind and solar remain stalled pending permits, with USD 10 billion in delayed outlays; Decree A/023/2025 suspends new applications until secondary rules are issued. Arbitration claims, such as Fotowatio’s 342 MW San Luis Potosí project, illustrate investor pushback.[2]
54% CFE Dispatch Cap Curbing Private Projects
The Electricity Sector Law compels CFE to retain majority dispatch, restricting merchant projects and pushing independents toward joint ventures or rooftop segments. Clean-energy investment dropped 75% in 2023 to USD 302.43 million.
*Our forecasts treat driver/restraint impacts as directional, not additive. The impact forecasts reflect baseline growth, mix effects, and variable interactions.
Segment Analysis
By Grid Type: Off-Grid Surge Challenges On-Grid Hegemony
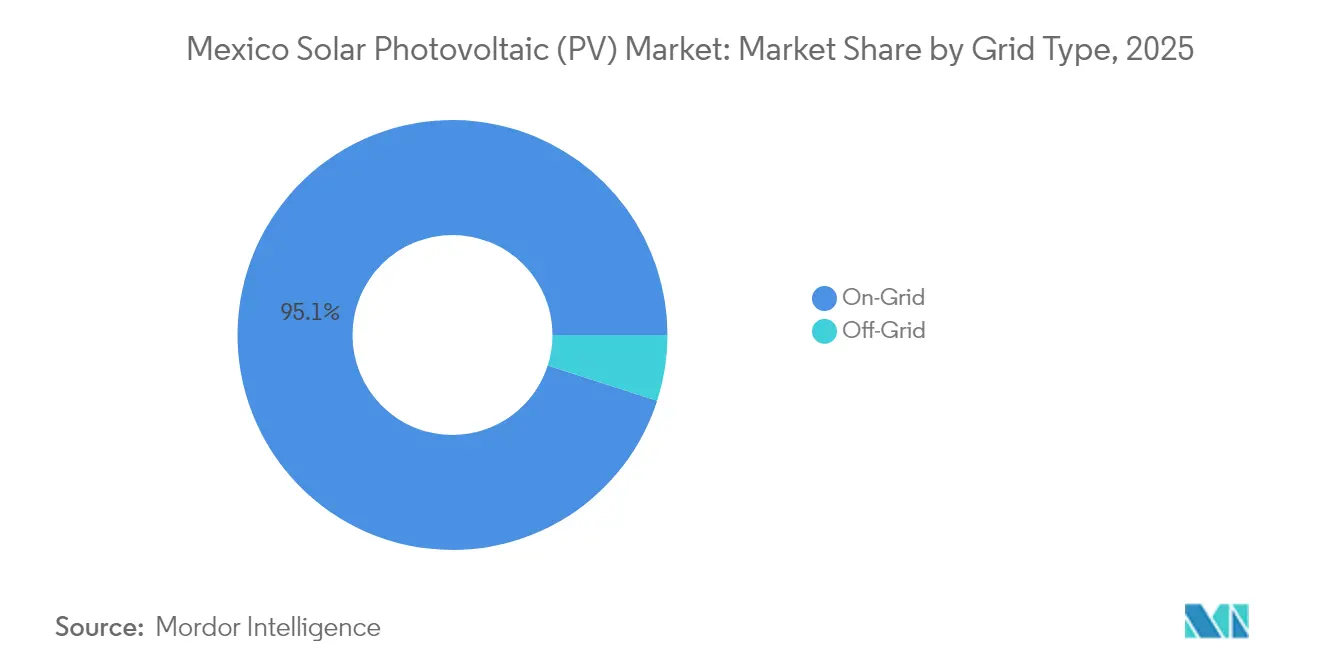
On-grid systems dominate the market with a 95.05% market share in 2025, reflecting Mexico's centralized electricity infrastructure and utility-scale development priorities under CFE's expanded generation mandate. Off-Grid/Hybrid configurations are expected to accelerate at a 20.7% CAGR through 2026-2031, driven by the need for remote area electrification and industrial applications requiring energy independence from grid instabilities. The dramatic growth differential signals Mexico's energy access democratization, where distributed solar-plus-storage systems address rural electrification gaps while providing backup power solutions for commercial and industrial facilities experiencing grid reliability challenges.
Off-Grid/Hybrid momentum reflects Mexico's geographic diversity and infrastructure limitations, with remote mining operations, agricultural facilities, and rural communities increasingly adopting standalone solar systems enhanced by battery storage integration. The National Development Plan's emphasis on ensuring 99% population energy access by 2030 creates policy support for off-grid solutions in underserved regions where grid extension remains economically unfeasible. Hybrid systems that combine solar energy with diesel generators or battery storage offer operational flexibility, appealing to industrial users seeking energy security amid CENACE grid connection bottlenecks. The segment's acceleration also benefits from declining battery costs and improved energy management systems that enhance off-grid system reliability and economic viability for distributed applications.

By End-User: Residential Renaissance Disrupts Utility Monopoly
Utility-scale installations command a 61.85% market share in 2025, reinforced by CFE's mandate to maintain at least 54% of national electricity generation and major projects, such as Puerto Peñasco's 457.211 MW capacity expansion. Residential emerges as the fastest-growing segment, with an 18.4% CAGR through 2026-2031, driven by enhanced distributed generation regulations that increase project thresholds to 0.7 MW and the stability of net-metering policies under Sheinbaum's administration. Commercial and Industrial segments demonstrate steady adoption patterns driven by nearshoring manufacturing investments and corporate sustainability commitments, while Mining applications benefit from energy independence strategies in remote operational locations.
Residential acceleration reflects Mexico's energy democratization trends, with interconnection contracts expanding from 334,984 in 2023 to 367,207 in 2024 as declining system costs and accessible financing enable household adoption. The National Development Plan's solar panel program for homes, particularly in northern Mexico's high-irradiance regions, provides policy support that accelerates residential deployment while reducing household electricity costs. Utility-scale dominance persists through state-led capacity expansion and regulatory frameworks that favor large-scale development, yet the residential surge indicates a market maturation toward distributed generation models. Commercial and Industrial segments benefit from corporate PPA opportunities driven by nearshoring manufacturers requiring renewable energy sourcing to meet USMCA content requirements and sustainability targets, while Mining operations increasingly adopt solar-plus-storage solutions to reduce operational costs and enhance energy security in remote locations.

Geography Analysis
Northern Mexico leads solar deployment, accounting for more than 60% of capacity in 2025. Sonora’s Puerto Peñasco hub and the broader Sonora Plan confirm the state as the anchor of export-oriented renewables, aided by its 2,000 kWh/m² annual irradiation. Chihuahua and Coahuila follow closely due to large industrial loads and available land. Nuevo León benefits from nearshoring demand, with corporate PPAs pushing new utility and rooftop builds.
Central Mexico is experiencing steady growth in distributed generation uptake. Mexico City’s urban solar program added large public-building arrays that highlight the technology’s viability in dense settings. Hidalgo and Puebla leverage manufacturing clusters and the new cell fabrication plants to deepen the local supply chain.
Southern states remain underdeveloped. Oaxaca’s high wind resources contrast with the slow progress of solar development, hindered by land disputes and weak transmission infrastructure. Yucatan and Quintana Roo target the hotel sector's self-generation but need interconnection upgrades. The geographic pattern illustrates that the Mexico solar photovoltaic market continues to coalesce around industrial corridors and border trade routes, while policy incentives seek to spread growth southward.
Regulatory Landscape
Mexico's solar PV market operates under a state-led electricity model where the Electricity Sector Law framework reserves a minimum 54% of national generation for CFE, which shapes how private solar projects are structured and dispatched. Sector governance and compliance span SENER (policy and planning), CNE (administrative provisions and sector rules), and CENACE (system operation and interconnection). The updated operational framework was reinforced by the Regulation of the Law of the Electric Sector published in the DOF in October 2025, tightening performance and operating rules across the electricity value chain.
Recent rulemaking has clarified pathways for self-consumption and storage while adding technical compliance requirements. In December 2025, SENER published administrative provisions for electric self-consumption (autoconsumo). In April 2026, it issued DACG for integrating energy storage into the National Electric System, formalizing technical and compliance standards for storage-coupled renewable projects. In May 2026, SENER published a second call for priority attention to generation permit and interconnection applications, following an earlier October 2025 call that resulted in 18 issued permits. This points to permitting being managed through defined application windows, alongside stricter technical requirements.
Competitive Landscape
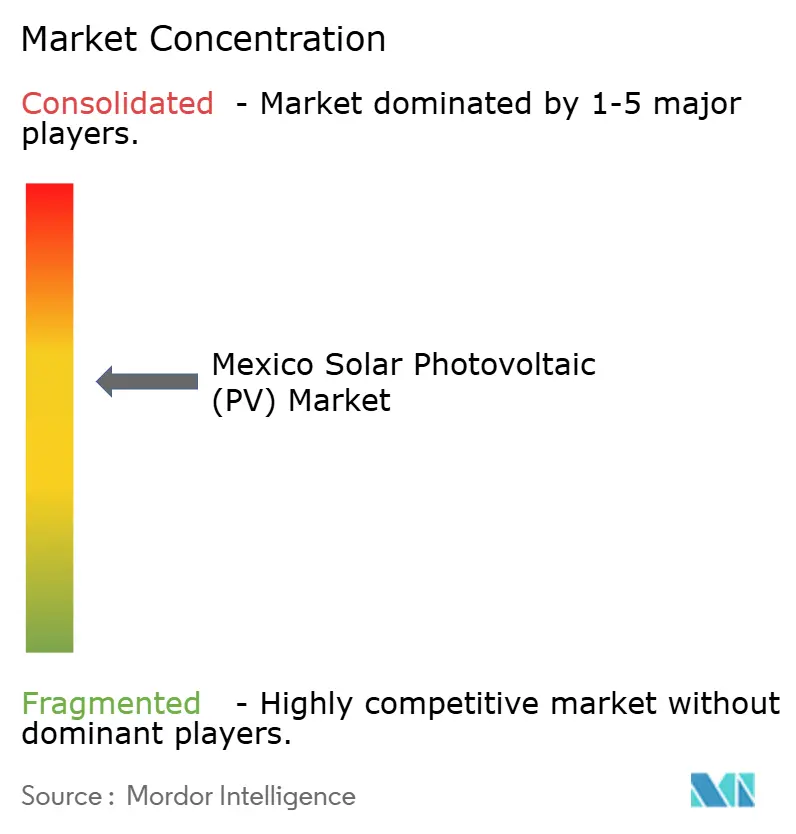
The Mexico solar photovoltaic market features moderate consolidation. CFE’s direct buildout and joint-venture activity position it as the dominant utility, while international developers such as Enel, Iberdrola, EDF Renewables, and Acciona control most private utility assets. Enel’s sale of 1.7 GW of operating plants signals a portfolio rotation toward markets with lighter regulation, whereas Iberdrola’s USD 1 billion pledge underlines confidence in the revised rules.[3]
Module supply is competitive. Canadian Solar shipped 31.1 GW of modules and 6.6 GWh of storage in 2024, maintaining a 500% growth rate in storage.[4] First Solar’s Series 6 Plus bifacial product and Trina’s Vertex series vie for high-efficiency tenders, while JA Solar and Risen expand distribution partnerships. Domestic factories in Puebla and Durango start to close the import gap, aligning with energy sovereignty goals.
Emerging opportunities revolve around hybridization and storage. BayWa r.e.’s 188 MW hybrid project and CFE’s battery pilots show a move to firm renewable output. Energy-as-a-service models are gaining traction for commercial and industrial (C&I) clients who wish to avoid capital expenditures (capex) while locking in low tariffs. Circular-economy entrants such as Rafiqui pioneer panel recycling, adding sustainability credentials that attract ESG-minded financiers.
Mexico Solar Photovoltaic (PV) Industry Leaders
-
Comisión Federal de Electricidad (CFE)
-
Enel Green Power
-
Engie
-
Iberdrola
-
Canadian Solar
- *Disclaimer: Major Players sorted in no particular order
Market Opportunities and Future Outlook
Opportunity is concentrating where policy-backed procurement and state-led build programs create bankable routes to market. CFE's Puerto Penasco complex provides a visible pipeline anchor, including a January 2026 tender for the 280 MW phase four. In June 2026, CFE concluded a renewable tender under mixed development schemes that selected 37 projects totaling 7.4 GW of renewables, including 33 solar PV projects amounting to 6.7 GW. These mixed schemes, together with the March 2025 energy reform package defining participation pathways (including utility-scale projects selling exclusively to CFE), give developers a clearer contracting route to align project design with CFE offtake and grid constraints.
A second opportunity cluster is distributed generation and self-consumption for commercial and industrial loads, supported by the increase of the permit-exemption limit to 0.7 MW and by the December 2025 autoconsumo provisions that define this segment's regulatory perimeter. The market also shows whitespace in storage-coupled PV as compliance requirements and operational needs converge, reinforced by SENER's April 2026 DACG for storage integration and by CFE's project pipeline incorporating batteries at legacy thermal sites. Execution risk remains concentrated in interconnection and permitting cadence, since administrative implementation for DG interconnection and broader grid-connection queues continue to affect project timelines and the preferred route-to-market (onsite self-supply, joint ventures, or CFE-aligned tenders).
Recent Industry Developments
- July 2026: CFE submitted the environmental impact documentation (MIA-R) to Semarnat for the 339 MW Concepcion Mendizabal Mendoza Phase III solar project in Nava, Coahuila, which includes battery storage and is planned at the Carbon II complex. The filing points to CFE pairing large PV blocks with storage at existing power-plant nodes to improve dispatchability and grid integration. It also adds to the near-term project slate tied to northern industrial and grid corridors.
- March 2026: CFE selected a consortium including Electrica Aselco, Grupo Profrezac, Epic Electric, and Enersave Wire and Cable to build the 280 MW fourth phase of the Puerto Penasco solar project for about USD 344 million. This selection advances one of Mexico's flagship public solar investments by moving the tender into an execution-stage EPC program. The award further consolidates Puerto Penasco's role as a reference site for utility-scale PV procurement and supply-chain participation.
- February 2024: Engie commissioned the 100 MW Solar Akin PV plant in Sonora. The new plant added operational utility-scale capacity in a high-irradiance northern state and strengthened Engie's footprint in Mexico's solar generation mix. Commissioning also supported the market shift toward larger plants located near industrial demand centers and export-oriented corridors.
Research Methodology Framework and Report Scope
Market Definition and Coverage
This market covers solar photovoltaic power in Mexico, tracked through installed PV capacity added and in operation across grid-connected and off-grid systems, and across utility scale and distributed installations. We keep the market definition in gigawatts so it stays tied to deployment rather than equipment revenue.
Scope exclusions: The sizing excludes non-PV solar technologies (such as solar thermal or CSP) and does not convert capacity into equipment revenue values.
Segmentation Overview
- By Grid Type
- On-Grid
- Off-Grid
- By End-User
- Residential
- Commercial and Industrial (C&I)
- Utility-scale
- By Component (Qualitative Analysis)
- Solar Modules/Panels
- Inverters (String, Central, Micro)
- Mounting and Tracking Systems
- Balance-of-System and Electricals
- Energy Storage and Hybrid Integration
Data Sources, Market Sizing, and Validation
Desk Research
Desk work starts with public energy statistics that describe Mexico's power system and clean energy pipeline, which helps us set the right demand pool for PV. We focused on references such as SENER planning publications, CENACE system and interconnection information, CRE regulatory documents, and IEA country energy data.
To translate those signals into a usable model, we also reviewed customs and trade statistics for PV related equipment, peer-reviewed papers on Mexico solar resource and performance, and developer and utility press releases that confirm commissioning timing. Company annual reports, investor decks, and reputable news were used to cross-check project status changes, and a paid subscription database for company financials plus a patent database supported background validation. These examples are not exhaustive, and many other public sources were also used to collect, validate, and clarify data points.
Primary Interviews and Surveys
Primary checks were completed through expert conversations and structured surveys with installers, developers, EPC participants, component distributors, and power sector advisors, so the model inputs reflect what is actually being built and connected. We also spoke with demand-side participants that influence distributed PV uptake (commercial and industrial users and rooftop ecosystem stakeholders) to confirm timelines, utilization assumptions, and realistic growth constraints across Mexico.
Distribution of primary research fieldwork respondents
| Company type | Respondent position |
|---|---|
| Top tier: 32% | CXOs: 17% |
| Mid tier: 47% | Functional/Unit leaders: 25% |
| Smaller Players: 21% | Managers: 58% |
Market-Sizing & Forecasting
The core sizing uses a top-down build where national installed capacity and annual additions are reconstructed from project commissioning patterns and grid connection cues, then aligned to the end-use split between utility scale and distributed PV. After that, selective bottom-up checks were run using sampled project pipelines, typical MW sizing for common project types, and channel feedback on shipment timing, which is then used to adjust totals where gaps show up.
Key inputs in the model include PV additions by year (MW), grid type share (on-grid versus off-grid), utility scale versus distributed mix, interconnection and curtailment risk signals, and expected module and inverter availability trends that can delay execution. When data is incomplete for smaller distributed installations, we handle the gap through adoption rate proxies tied to commercial and industrial demand and the observed pace of rooftop installations, and then recheck with installer feedback.
Forecasts were developed using scenario analysis, where the base case is anchored to expected policy direction, project pipeline maturity, and practical grid readiness. Assumptions were stress-tested with interview-led ranges for commissioning slippage, permitting friction, and self-consumption economics, so the growth path stays realistic even when year-to-year additions are volatile.
Data Validation & Update Cycle
Outputs are validated through multiple checks, including consistency between implied additions and publicly visible commissioning events, plus reasonableness against power demand and renewable share targets. When a value looks off, we recheck the assumptions behind it, compare it to at least one independent signal (such as pipeline changes or grid updates), and then re-contact relevant respondents if the variance remains high.
Before sign-off, the model and key assumptions go through a multi-step internal review so calculation errors and scope creep are caught early. Reports are refreshed annually, and interim updates are triggered when material events occur, including major regulatory shifts, unusually large project awards, or visible delays in grid connection activity. Right before delivery, a fresh pass is completed so clients receive the latest updated view.
Mordor Intelligence's Mexico Solar Photovoltaic Market Size Versus Other Published Estimates
Published market size numbers for Mexico solar PV can look far apart, mostly because teams do not measure the same thing and they do not anchor the timeline the same way. Some sources size the market as equipment and services revenue in USD, while others track installed capacity in GW, so the two figures will not line up even if the same projects are being discussed.
The biggest gap drivers here are unit of measure, what gets included around the PV system (only capacity versus full system value), and how pipeline risk is treated in the base case. Another frequent difference comes from mixing broader solar energy categories with PV only, and from currency timing and price assumptions when the output is expressed in USD rather than in GW.
Benchmark comparison
| Source | Market Size | Gaps in Research Methodology |
|---|---|---|
| Mordor Intelligence | USD 15.92 B (2026) | |
| Industry Data Provider A | USD 4.50 B (2024) | This figure is reported as market value in USD for a base year, which can bundle modules, inverters, balance of system, and services, and it is not directly comparable to an installed capacity model expressed in GW. |
| Regional Research House B | USD 7.90 B (2024) | This estimate is framed as a wider solar energy value pool for Mexico with PV as a leading part, which can unintentionally pull in adjacent solar categories and different pricing assumptions that lift or shift the total. |
The spread in the table is mainly explained by mixing capacity-based sizing with revenue-based sizing, and by whether only PV is counted or broader solar categories are blended in. By keeping the output tied to installed PV capacity additions and operational stock, and then using primary checks to filter out uncertain pipeline items, the estimate stays more repeatable and scope clean, which is the modeling choice applied by Mordor Intelligence.
Key Questions Answered in the Report
What is the current size of the Mexico solar photovoltaic market?
The market reaches 15.92 GW in 2026 and is forecast to hit 30.9 GW by 2031.
How fast is the market growing?
Installed capacity is expanding at an 14.18% CAGR between 2026 and 2031.
Which segment is growing the quickest?
Residential installations are advancing at an 18.4% CAGR, outpacing all other end-user categories.
What policy change has most affected private developers?
The Electricity Sector Law reserves 54% of generation for CFE, pushing independents toward joint-ventures and distributed generation.
Where is most new solar capacity being built?
Northern states, especially Sonora, Chihuahua, and Nuevo León, account for more than 60% of recent additions thanks to strong irradiation and industrial demand.
How concentrated is industry leadership?
The top five players control 42% of utility capacity, reflecting moderate consolidation and ongoing competition for market share.