
Market Overview
| Study Period | 2020 - 2031 |
|---|---|
| Forecast Data Period | 2026 - 2031 |
| Base Year Market Size (2025) | USD 3.86 Billion |
| Market Size (2026) | USD 4.17 Billion |
| Market Size (2031) | USD 6.13 Billion |
| Growth Rate (2026 - 2031) | 8.03 % |
| Market Concentration | Medium |
Major Players
*Disclaimer: Major Players sorted in no particular order Image © Mordor Intelligence. Reuse requires attribution under CC BY 4.0. |
|
Mexico Ride-Hailing Market Analysis by Mordor Intelligence
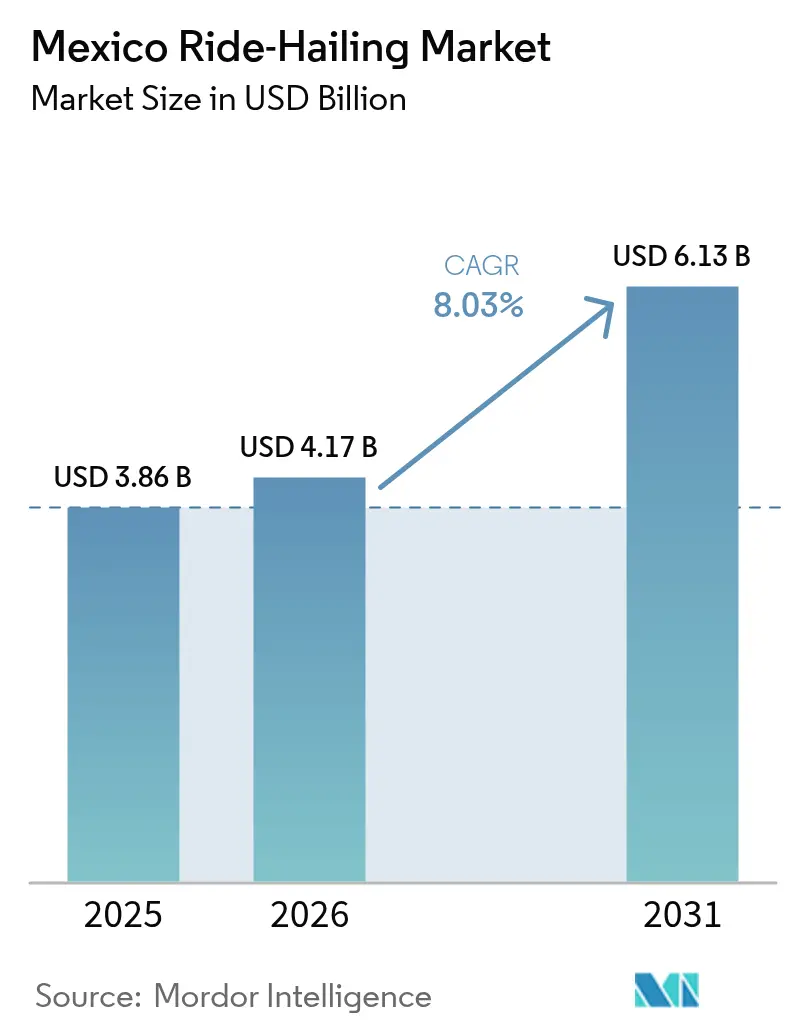
The Mexico ride-hailing market size is expected to grow from USD 3.86 billion in 2025 to USD 4.17 billion in 2026 and is forecast to reach USD 6.13 billion by 2031 at 8.03% CAGR over 2026-2031. Rapid smartphone adoption, which already covers over 95% of internet users, underpins seamless in-app bookings while high urban congestion encourages residents to substitute private cars with platform-based mobility services. Competitive pricing versus taxi ownership, an expanding digital payment ecosystem, and the integration of embedded financial services further reinforce demand. Fuel-price volatility pushes drivers toward platforms offering dynamic pricing and incentive programs, while corporate relocation to major metropolitan areas increases enterprise mobility spending. Regulatory pilots supporting mobility-as-a-service signal long-term governmental alignment with platform integration.[1]“Encuesta Nacional sobre Disponibilidad y Uso de Tecnologías de la Información en los Hogares 2024,” Instituto Nacional de Estadística y Geografía, inegi.org.mx
Key Report Takeaways
- By service type, e-hailing led with 67.62% share of the Mexico ride-hailing market in 2025; shuttle/van-pool is forecasted to expand at a 9.94% CAGR through 2031.
- By rider type, peer-to-peer held 60.84% of the Mexico ride-hailing market share in 2025, while corporate/business is projected to grow at a 8.89% CAGR to 2031.
- By booking channel, in-app/online accounted for 85.30% of the Mexico ride-hailing market size in 2025 and is projected to grow at a 10.52% CAGR.
- By vehicle type, passenger cars captured 71.40% share of the Mexico ride-hailing market in 2025 and are expected to rise at a 12.58% CAGR through 2031.
- By distance, intracity trips represented 66.95% of the Mexico ride-hailing market in 2025; intercity is poised for an 7.89% CAGR between 2026-2031.
- By payment method, cash retained 52.88% share of the Mexico ride-hailing market size in 2025, although digital wallets are set to expand at a 11.61% CAGR through 2031.
Note: Market size and forecast figures in this report are generated using Mordor Intelligence’s proprietary estimation framework, updated with the latest available data and insights as of 2026.
Mexico Ride-Hailing Market Trends and Insights
Drivers Impact Analysis*
| Driver | (~) % Impact on CAGR Forecast | Geographic Relevance | Impact Timeline |
|---|---|---|---|
| Internet and Smartphone Penetration | +2.7% | Mexico City, Guadalajara, Monterrey, Tijuana | Short term (≤ 2 years) |
| Urban Congestion | +2.4% | Mexico City, Estado de México, Jalisco | Medium term (2-4 years) |
| Digital Wallets and Real-Time Payments | +1.4% | Quintana Roo, Baja California, Nuevo León | Medium term (2-4 years) |
| Competitive Pricing | +0.9% | Mexico City, Guadalajara, Monterrey, Puebla | Short term (≤ 2 years) |
| Mobility-as-a-Service Integration | +0.6% | Mexico City, Estado de México, Jalisco | Long term (≥ 4 years) |
| Fintech Micro-Insurance | +0.4% | Mexico City, Nuevo León, Jalisco, Baja California | Medium term (2-4 years) |
| Source: Mordor Intelligence | |||


Rising Internet and Smartphone Penetration
Nationwide internet coverage reached 83.1% in 2024, with urban connectivity at 86.9% and rural at 68.5%. Mobile devices account for over 97% of all connections, making ride-sharing inherently mobile-first. Platforms already convert 32.7% of online purchasers into ride customers, illustrating a sizable untapped audience. State disparities, such as Quintana Roo at 90.7% against Chiapas at 64.9%, create localized expansion priorities. Forthcoming 5G rollouts promise faster matching times and richer in-app experiences, enhancing user retention.[2]Luis David, "Internet access in Mexico: These are the most connected states in the country", Lider Empresarial, liderempresarial.com
Urban Congestion Driving Shift from Car-Ownership
Mexico City residents lose close to 100 hours annually in rush-hour traffic, ranking the capital 13th worldwide. An average 10 km commute takes 26 minutes 30 seconds, nudging commuters toward shared rides that optimize routing and eliminate parking costs. Public transit growth highlights unmet mobility needs. Intracity services therefore dominate the Mexico ride-hailing market as platforms streamline driver supply around peak congestion windows. Municipal investment in bus rapid transit and electrified corridors complements on-demand solutions.
Adoption of Digital Wallets and Real-Time Payments
SPEI processes more than 14 million transactions daily, while DiMo surpassed 11 million registered accounts by mid-2024. Phone-number-linked wallets enable instant driver payouts, accelerating onboarding for Mexico’s 51% unbanked population. Digital wallets are expected to reach 17-20% of point-of-sale volume by 2027, yet cash remains culturally entrenched. Platforms therefore blend SPEI and OXXO cash vouchers to ensure blanket coverage. Regulatory oversight from the National Banking and Securities Commission encourages innovation but increases compliance spend.
Competitive Pricing Versus Taxi Ownership
Regular gasoline prices rose 6.14–8.33% year-to-date in 2024 and around 23.98% since the current administration took office. Platforms mitigate volatility via dynamic pricing and fuel incentives, giving drivers steadier income than independent taxi work. Diesel subsidy removal in July 2024 further squeezed legacy operators. Lease-to-own EV programs boost driver earnings by lowering operating costs, deepening platform loyalty. Registration fees and fines weigh on both sectors, yet large platforms spread costs across wider driver pools.
Restraints Impact Analysis*
| Restraint | (~) % Impact on CAGR Forecast | Geographic Relevance | Impact Timeline |
|---|---|---|---|
| Federal and Municipal Transport Rules | -0.8% | Mexico City, Guadalajara, Monterrey, Tijuana | Short term (≤ 2 years) |
| Protests from Legacy Taxi Unions | -0.7% | Mexico City, Estado de México, Jalisco, Puebla | Medium term (2-4 years) |
| Passenger Security Concerns | -0.3% | Tijuana, Mexico City, Estado de México | Medium term (2-4 years) |
| Fuel-Price Volatility | -0.7% | National coverage with emphasis on border states | Short term (≤ 2 years) |
| Source: Mordor Intelligence | |||
Stringent Federal and Municipal Transport Rules
Fragmented state regulations force platforms to navigate varying license requirements, background checks, and drug testing. Baja California alone imposes a 3,400 MXN (USD 190.06) driver registration fee, yet compliance covered only 4% of active drivers by mid-2024. Non-compliance penalties reach 56,000 MXN (USD 3,127.37) and include vehicle impoundment, raising operating risk. The newly created Agencia de Transformación Digital y Telecomunicaciones may standardize digital oversight, but transportation rules remain locally driven. Large platforms can absorb legal fees, whereas smaller entrants struggle to scale across jurisdictions.
Intense Protests from Legacy Taxi Unions
Taxi organizations deploy blockades and political lobbying to restrict platform access to airports and central zones. Coordinated social-media campaigns highlight safety incidents, affecting user sentiment and acquisition costs. Union influence induces regulatory capture, evident in varying enforcement intensity across cities. Traditional taxi economics deteriorate under fuel inflation, increasing union militancy. Platforms must invest in stakeholder engagement and diversify service portfolios to mitigate protest-related disruptions.
*Our forecasts treat driver/restraint impacts as directional, not additive. The impact forecasts reflect baseline growth, mix effects, and variable interactions.
Segment Analysis
By Service Type: E-hailing Dominance Faces Van-pool Disruption
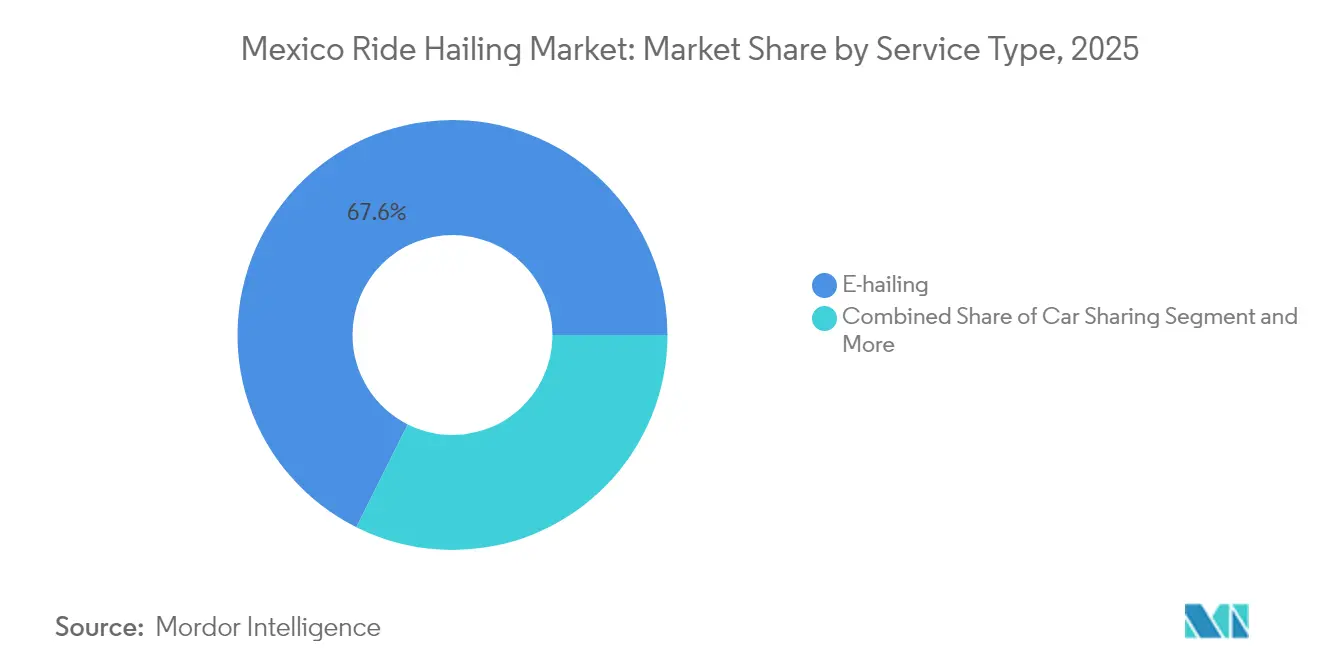
E-hailing controlled 67.62% of 2025 revenue of the Mexico ride-hailing market size in 2025, demonstrating consumers’ preference for on-demand solo rides. Shuttle and van-pool services, though smaller, are set to grow at a 9.94% CAGR, capitalizing on corporate contracts and airport shuttles. Car sharing and car rental occupy niche positions where multi-hour access outweighs per-ride convenience. Platform diversification into electric fleets improves cost efficiency and aligns with sustainability targets.
Shared vans increasingly win municipal tenders for employee transport, reinforcing network effects in dense corridors. Electric vehicle leasing models promise 20% higher driver income, positioning green fleets as profit drivers. Specialized providers leverage route predictability to optimize capacity, while policy incentives favor high-occupancy mobility. As congestion charges become likelier, shuttle models could erode e-hailing’s current Mexico ride-hailing market share.


By Rider Type: Corporate Segment Accelerates Despite P2P Leadership
Peer-to-peer trips captured 60.84% of the Mexico ride-hailing market size in 2025. However, corporate spending is projected to climb 8.89% annually as firms replace fleet ownership with on-demand mobility. Enterprises demand robust reporting, duty-of-care compliance, and safety assurances, features that larger platforms already bundle into premium packages. Higher trip frequency and predictable demand boost driver utilization, lifting platform margins.
Long-term contracts secure recurring revenue, insulating platforms against consumer demand swings. Integrated expense-management APIs further differentiate providers in business travel procurement. Regulatory clarity around employee transport obligations encourages HR departments to formalize ride-sharing partnerships. Consequently, corporate users will gradually dilute peer-to-peer dominance in the Mexico ride-hailing market.
By Booking Channel: Digital Supremacy Masks Payment Evolution
In-app bookings represented 85.30% of the Mexico ride-hailing market size in 2025 and are projected to grow at a 10.52% CAGR, reflecting Mexico’s mobile-centric digital behavior. Offline channels remain important where smartphone adoption is lower, particularly among older riders and in rural zones. Digital supremacy allows platforms to personalize promotions and apply real-time pricing. However, cash continues to account for over 50% of total payments within digital channels, showing cultural persistence.
Wallet adoption will rise as DiMo and SPEI expand instant transfers. Platforms integrate OXXO voucher systems to convert cash-centric users without physical credit cards, ensuring inclusive growth. Real-time payment rails also expedite driver settlements, reducing churn. Payment flexibility will remain pivotal to sustaining Mexico ride-hailing market growth across demographics.
By Vehicle Type: Passenger Cars Lead Electric Transition
Passenger cars captured 71.40% of the Mexico ride-hailing market share in 2025 and are projected to expand at a 12.58% CAGR through 2031, retaining clear primacy in service delivery. Their dominance reflects ample vehicle availability, flexible seating capacity, and rising adoption of electric models that trim operating costs for drivers. Two-wheelers continue to gain relevance in gridlocked downtown cores because their maneuverability shortens trip times and improves driver utilization. Vans and minibuses meet corporate and airport shuttle demand where group travel optimizes seat-kilometer economics. Collectively, these patterns reinforce passenger cars as the cornerstone of fleet composition while allowing complementary vehicle categories to fill specialized niches.
Electric conversion amplifies passenger-car competitiveness by lowering fuel outlays, a critical benefit amid rise in gasoline prices that erodes taxi margins. Lease-to-own EV programs promise drivers up to 20% higher net income, improving retention and platform loyalty. Charging-network expansion across major corridors further reduces range anxiety and elevates uptime, allowing cars to serve more rides per shift. Safety improvements, such as mandatory telematics and camera installations, also strengthen rider confidence, an essential element for winning female passengers deterred by security concerns. These combined factors are expected to lift the segment’s contribution to the Mexico ride-hailing market size through the forecast window.
By Distance: Intracity Dominance Reflects Urban Concentration
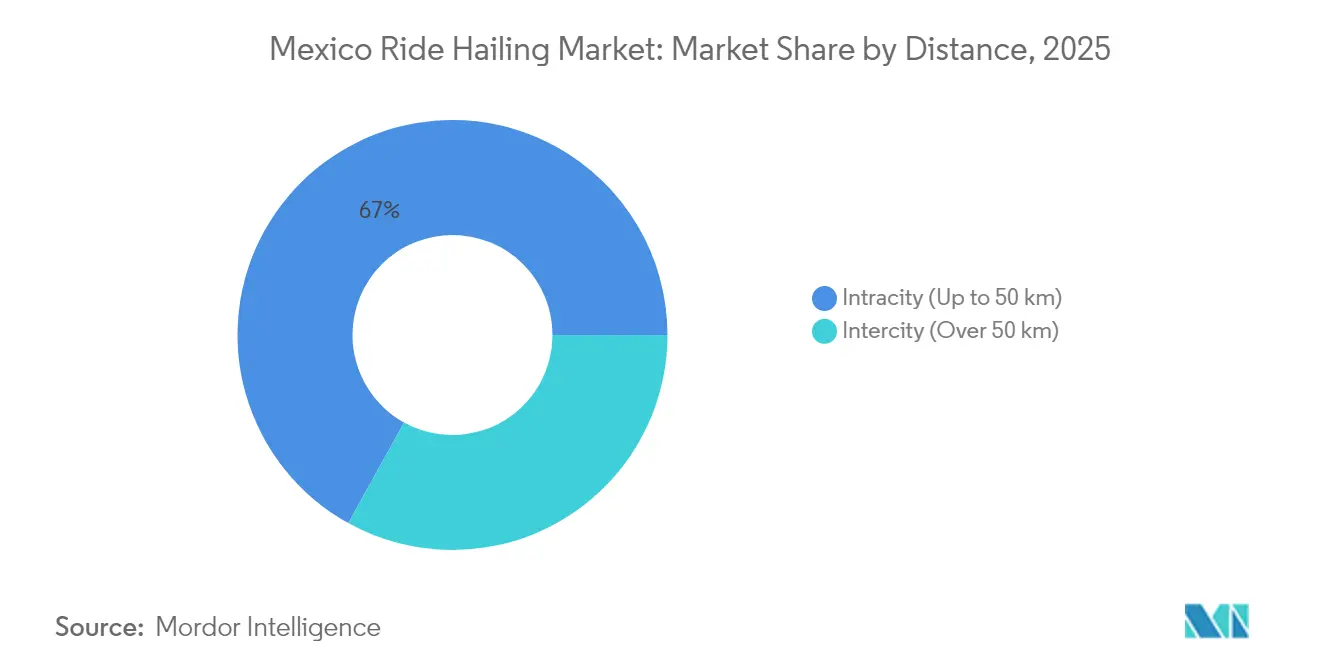
Intracity trips under 50 km represented 66.95% of the Mexico ride-hailing market share in 2025, mirroring Mexico’s urban concentration, where 86.9% of city dwellers enjoy reliable internet coverage. High population density, severe congestion, and scarce parking position on-demand cars as a practical substitute for private vehicles. Dynamic pricing engines align driver supply with rush-hour peaks, keeping wait times low and fares competitive against traditional taxis. Municipal congestion charges under discussion may further motivate commuters to switch from owned cars to ride-hailing, strengthening intracity volume. Consequently, intracity services will anchor the Mexico ride-hailing market share through 2031.
Intercity rides exceeding 50 km are forecasted to expand at an 7.89% CAGR as tourism rebounds and business ties tighten among regional hubs. New toll highways and electrified bus corridors improve road safety and cut travel times, enlarging the catchment area for platform services. Cross-state regulatory harmonization would unlock additional scale, though varying permit fees still slow network expansion into smaller cities. Riders appreciate transparent pricing and app-based security features that long-distance bus operators rarely provide, supporting gradual modal shift. As infrastructure and regulation converge, the intercity slice of the Mexico ride-hailing market size is likely to inch upward, but it will not displace intracity’s structural lead.
By Payment Method: Cash Persistence Challenges Digital Transformation
Cash payments accounted for 52.88% of Mexico's ride-hailing market size in 2025, underscoring a deeply rooted preference that spans income groups. Although smartphone penetration among internet users stands at over 95%, many riders still top up balances at convenience stores or pay drivers directly. This habit obliges platforms to operate cash-collection workflows that raise reconciliation costs and fraud exposure. Card usage benefits from broader point-of-sale acceptance, yet lingering mistrust around online credentials keeps adoption moderate. As a result, cash remains pivotal even within a digitally dominated booking ecosystem.
Digital wallets are projected to grow at a 11.61% CAGR thanks to real-time rails like SPEI and phone-linked DiMo accounts that simplify peer transfers. Instant driver payouts reduce churn by meeting daily liquidity needs, while loyalty rewards coax riders toward electronic settlement. Platform partnerships with voucher networks such as OXXO ensure that cash-centric users can still fund digital accounts, smoothing the transition. Regulatory scrutiny on anti-money-laundering compliance incentivizes larger operators to invest in robust KYC systems, reinforcing their competitive edge over smaller entrants. Over time, these forces will chip away at cash’s dominance, gradually enlarging digital payments’ share of the Mexico ride-hailing market size without alienating legacy users.
Geography Analysis
Mexico City and Estado de México form the core demand cluster, driven by the nation’s highest population density, over 95% smartphone penetration, and entrenched platform familiarity. Guadalajara and Monterrey act as secondary growth poles, surpassing 85% internet coverage and offering supportive regulatory frameworks that balance innovation with safety oversight. Northern states such as Baja California, with 90.4% connectivity, register strong uptake aligned with cross-border commerce, though Tijuana’s security incidents spur stricter background checks under the state’s Sustainable Mobility Institute.
Tourism hubs introduce seasonal peaks that reshape supply planning. Quintana Roo tops connectivity at 90.7%, catering to Cancún’s international visitor influx, which demands reliable airport transfers and resort shuttles. Conversely, southern states like Chiapas, at 64.9% penetration lag due to limited telecom infrastructure and lower per-capita income, delaying large-scale digital mobility rollouts. Federal 5G initiatives could bridge these gaps over the medium term, widening the addressable Mexico ride-hailing market.
Regulatory heterogeneity complicates nationwide scaling. While the new Agencia de Transformación Digital y Telecomunicaciones might harmonize digital policy, transport oversight remains largely municipal. Licensing fees, safety inspections, and data-sharing rules differ by city, creating compliance hurdles for smaller operators. Larger platforms leverage dedicated legal teams to meet divergent requirements, securing early-mover advantages as regulatory convergence gradually unfolds.
Regulatory Landscape
Mexico ride-hailing operates under a fragmented, city-led framework that distinguishes app-based services from concessioned taxi public transport. In Mexico City, platforms are treated as Servicio Privado de Transporte con Chofer and must register with SEMOVI, including obtaining a Constancia de Registro Vehicular per authorized unit; the Mexico City Fiscal Code sets a MXN 2,496 fee for this certificate. Local rules also explicitly prohibit concessioned taxi plates from joining private ride-hailing platforms, reinforcing a strict separation between the two models.
At the federal level, scrutiny is rising in jurisdictionally sensitive zones, especially airports. In February 2026, a legislative initiative was introduced in the Chamber of Deputies to reform the Ley de Caminos, Puentes y Autotransporte Federal and the Ley de Aeropuertos to explicitly regulate passenger transport via digital platforms in airport areas. Competition policy signals remain relevant: COFECE has consistently advocated for competition-friendly regulation that avoids artificial caps on vehicles and avoids direct intervention in dynamic pricing mechanisms, while local authorities continue compliance checks and sanctions (for example, SEMOVI messaging in March 2026 referenced penalties up to 400 UMA, about MXN 46,000, for taxi operators attempting to enroll illegally on platforms).
Value Chain Analysis
The Mexico ride-hailing value chain begins with demand generation and digital distribution through in-app/online channels, then runs through matching and dispatch algorithms, pricing and payments (cash, cards, and rails such as SPEI/CoDi/DiMo), and finally into trip execution and post-trip customer support, safety tooling, and dispute resolution. On the supply side, driver acquisition depends on onboarding, background screening, and local permitting, followed by vehicle access (ownership, leasing, or rental), maintenance networks, fuel/charging access, and insurance coverage. Platform economics are increasingly shaped by payouts, incentives, and compliance costs in a market where municipal rules differ by city.
The chain is becoming more integrated as platforms add partners that reduce bottlenecks in vehicle access and regulatory friction. Examples include Uber announcing a Mexico City pilot alliance with the taxi group MX Taxi (3,000 to 3,500 licensed units) to add compliant supply into the app, and inDrive deepening supply enablement through licensing and fleet-access moves, including renewed operating licenses in the Guadalajara metropolitan area, a permit to operate in Puerto Vallarta, and a partnership with OCN (OneCarNow!) that bundles vehicle rentals with purchase options for drivers. Parallel EV ecosystem development is also visible through collaborations aimed at charging and specialized EV infrastructure, linking ride-hailing demand with vehicle OEMs, energy/charging providers, and fleet operators to lower driver operating costs and support electrification initiatives.
Competitive Landscape
Following Cabify's exit in October 2024 after 12 years in the market, the Mexico ride-hailing scene, already moderately concentrated, now presents ripe opportunities for strategic repositioning. Meanwhile, Uber, the market leader, finds its dominance increasingly challenged by DiDi's expanding share and its bold foray into fintech. Market leaders extend beyond core rides to embedded finance, driver insurance, and EV leasing, raising switching costs for both riders and drivers.
Fintech diversification provides additional revenue and strengthens loyalty by offering loans, wallets, and instant payouts. Electric mobility strategies define competitive differentiation. One platform partnered with EV suppliers to deploy 50,000 electric cars and 20,000 chargers by 2030, promising drivers 20% income uplift through lower operational costs. Another operator secured 100,000 Chinese-made EVs for Mexico, intensifying the electric race. Smaller entrants focus on hyper-local pricing algorithms and cash-friendly services aimed at price-sensitive riders.
White-space opportunities persist in underserved corporate mobility, female-only services, and intercity pooling corridors. Strengthened insurance frameworks and biometric verification aim to quell security concerns that dissuade certain demographics. Ongoing labor reforms granting employee status to gig drivers add cost pressure, prompting fare hikes of up to 7% in 2025. Platforms able to balance regulatory compliance, safety, and pricing will consolidate gains in the Mexico ride-hailing market.
Mexico Ride-Hailing Industry Leaders
-
Uber Technologies Inc.
-
BlaBlaCar
-
Didi Chuxing Technology Co.
-
OneCarNow!
-
Bolt
- *Disclaimer: Major Players sorted in no particular order


Market Opportunities and Future Outlook
Operational and commercial whitespace is centered on compliance-led supply expansion, safety differentiation, and event-driven capacity planning. The March 2026 Uber alliance with MX Taxi in Mexico City demonstrates a hybrid supply model that can add permitted vehicles where traditional ride-hailing faces enforcement pressure, particularly around regulated nodes such as airports. Ahead of the 2026 FIFA World Cup, Uber rolled out tools such as Uber Zones and Personal PIN security protocols across Mexico City, Monterrey, and Guadalajara, showing an active push to improve pickup efficiency and rider security at high-density venues and to standardize safety workflows across key metros.
Payments and driver enablement also present tangible areas for new product layers and partnerships as the market balances inclusion with compliance. Cash still accounts for 52.88% of payments (2025), while real-time rails and wallet programs expand addressability for riders and speed liquidity for drivers; this reinforces opportunities for tighter integration with SPEI/DiMo flows and voucher networks. On the policy side, the June 2025 gig-worker labor reform that extended Social Security (IMSS) access and profit-sharing obligations raises the bar for formalized benefits and reporting, while proposals such as the July 2026 Senate bill to cap platform commissions at 15% underscore ongoing regulatory attention to platform economics. Together, these dynamics reward platforms that combine compliant supply channels, safety features, and cost-to-serve improvements (including electrification partnerships) rather than relying only on price-led growth.
Recent Industry Developments
- July 2026: DiDi announced a USD 57 million investment plan to accelerate EV adoption on its platform, including a target to add 100,000 electric vehicles by 2030 and partnerships with VEMO and OneCarNow! tied to charging infrastructure. The move links fleet electrification with driver economics and infrastructure access, expanding the competitive basis from app features to vehicle supply and charging availability.
- May 2026: Uber launched Uber Mujeres in Mexico, enabling riders to prioritize trips with female drivers. The feature targets safety-driven demand segments and strengthens product differentiation where passenger security concerns can limit usage, particularly among women.
- September 2024: DiDi partnered with multiple Chinese EV manufacturers to introduce more than 100,000 electric vehicles into its Mexican fleet. This accelerated electrification agenda increased competitive pressure on rivals to secure vehicle supply and develop EV-focused leasing and charging partnerships.


Research Methodology Framework and Report Scope
Market Definition and Coverage
We define the Mexico ride-hailing market as paid passenger mobility services that match riders and drivers or vehicles through apps or similar booking tools, and the value is measured as gross revenue generated inside Mexico.
Scope exclusions: This sizing does not count informal cash-only street hailing that is not booked through a ride-hailing or related platform workflow.
Segmentation Overview
-
By Service Type
- E-hailing
- Car Sharing
- Car Rental
- Shuttle / Van-pool
-
By Rider Type
- Peer-to-Peer (P2P)
- Corporate / Business
-
By Booking Channel
- In-App / Online
- Phone-in / Offline
-
By Vehicle Type
- Passenger Cars
- Two-Wheelers
- Vans and Minibuses
-
By Distance
- Intracity (Up to 50 km)
- Intercity (Over 50 km)
-
By Payment Method
- Cash
- Card (Credit/Debit)
- Digital Wallet / SPEI / CoDi
Data Sources, Market Sizing, and Validation
Desk Research
Desk research was used to set the Mexico mobility context and to anchor the model to observable travel and digital adoption signals. We relied on public sources such as INEGI transport statistics, publications from the Ministry of Communications and Transportation, Banco de Mexico macro series, and mobility notes from the International Transport Forum and the World Bank, using them to sanity check demand direction and the city-level activity patterns implied by travel data.
We also reviewed company filings and investor decks where available, plus regulatory and association updates, and reputable press coverage to track policy changes that affect operating economics. For cross-checks on company footprints and service coverage, we used general news and financials datasets, and an import and export shipment-level database when it supported vehicle supply cues. The sources listed above are illustrative, and we also used other public documents and databases for data collection, validation, and clarification.
Primary Interviews and Surveys
Primary work focused on confirming what drives value in Mexico, including fare structure, take rates, and how trip mix shifts between intracity and intercity rides. We spoke with a mix of operators, fleet partners, and other ecosystem participants, then rechecked assumptions with functional leaders who track pricing, promotions, and driver supply behavior across major urban corridors.
Distribution of primary research fieldwork respondents
| Company type | Respondent position |
|---|---|
| Top tier: 33% | CXOs: 15% |
| Mid tier: 52% | Functional/Unit leaders: 27% |
| Smaller Players: 15% | Managers: 58% |
Market-Sizing & Forecasting
The model starts from a demand-pool build up that uses Mexico trip activity and monetization logic, where intracity and intercity ride volumes are reconstructed and then converted into value using observed fare and fee patterns. A top-down approach was used by translating trip frequency, average trip distance bands (up to 50 km for intracity and over 50 km for intercity), and payment mix into gross booking value, which is then adjusted for platform economics.
To keep totals realistic, we corroborated the output with selective bottom-up checks such as sampled fare cards, channel checks on promotions and surge behavior, and approximate rollups using active supply and utilization ranges. Key inputs monitored include smartphone and online booking penetration signals, fuel and operating cost pressure that influences pricing, city congestion and commute trends, cash versus card payment share, and the mix shift between two-wheelers and passenger cars. For forecasting, we applied scenario analysis around price inflation, promo intensity, and driver availability, then used expert views to narrow the range into a single base case. When direct local data was missing for smaller cities, we applied proxy ratios from comparable urban areas and then revalidated through follow-up calls.
Data Validation & Update Cycle
Validation was done through several checks so the final values align with independent market signals. We compared implied trips, average revenue per trip, and modeled growth against observable mobility indicators and macro constraints, then reviewed outliers before sign-off.
Any large variance triggered a deeper review of assumptions, followed by selective re-contact with interviewees to confirm what changed, such as pricing, promotion cycles, or regulatory friction. Reports are refreshed annually, and interim updates are made when material events affect demand or monetization. Before delivery, a final pass is completed to reflect the latest available inputs and keep the market view current.
Mordor Intelligence's Mexico Ride Hailing Market Size Versus Other Published Estimates
Published market sizes for Mexico ride-hailing can look far apart because each publisher sets its own rules on what services count, what year is treated as the base, and how gross bookings are converted into revenue. Differences also show up when pricing is assumed to rise smoothly, even though promotions and demand swings can change the realized fare quite quickly.
The main gap comes from whether adjacent app-based services are folded in, where Mordor Intelligence counts e-hailing, car sharing, car rental, and other ride-hailing services only when they are booked through the defined channels and attributed to Mexico, instead of bundling broader on-demand transport spend. Another driver is trip-mix handling, since intracity versus intercity (50 km cut) changes the average ticket size, and some estimates simplify this into one blended fare. Refresh cadence and currency timing also matter, because fast changes in fares and incentive levels can move annual value even if trip growth stays steady.
Benchmark comparison
| Source | Market Size | Gaps in Research Methodology |
|---|---|---|
| Mordor Intelligence | USD 3.86 B (2025) | |
| Industry Research Publisher A | USD 4.32 B (2025) | Often presented as a Mexico figure pulled from a broader global split, which can over-allocate revenue if local trip mix, cash share, and promo intensity are not modeled explicitly. |
| Industry Analytics Portal B | USD 3.66 B (2025) | Uses a wider on-demand transportation framing and may apply generalized growth and monetization assumptions, which can understate ride-hailing value when higher-fare intercity and app-booked rentals are included. |
The comparison shows that most of the spread is explained by scope and conversion choices, not by disagreement that the category is expanding. By tying the value to booking-defined services, distance mix, and payment behavior, our estimate stays traceable to simple drivers that can be rechecked and updated as market conditions shift.


Key Questions Answered in the Report
What is the projected value of the Mexico ride-hailing market by 2031?
The market is expected to reach USD 6.13 billion by 2031.
Which service type holds the highest share in Mexico’s ride-sharing landscape?
E-hailing commands 67.62% of 2025 revenue.
How fast will corporate ride bookings grow?
Corporate bookings are projected to expand at a 8.89% CAGR through 2031.
Why does cash still dominate payments in Mexican ride sharing?
Cultural preference and the widespread use of cash for daily expenses keep cash at 52.88% of 2025 transactions.
Which region shows the strongest ride-sharing potential outside Mexico City?
Quintana Roo, driven by tourism demand and 90.7% internet penetration, offers significant growth prospects.
How are platforms responding to fuel price volatility?
They deploy dynamic pricing, EV leasing, and fuel incentives to stabilize driver earnings.
Page last updated on:


 Your data is secure and never sold or shared.


