
Market Overview
| Study Period | 2021 - 2031 |
|---|---|
| Forecast Data Period | 2026 - 2031 |
| Base Year Market Size (2025) | 36.57 gigawatt |
| Market Volume (2026) | 40.27 gigawatt |
| Market Volume (2031) | 65.2 gigawatt |
| Growth Rate (2026 - 2031) | 10.12 % |
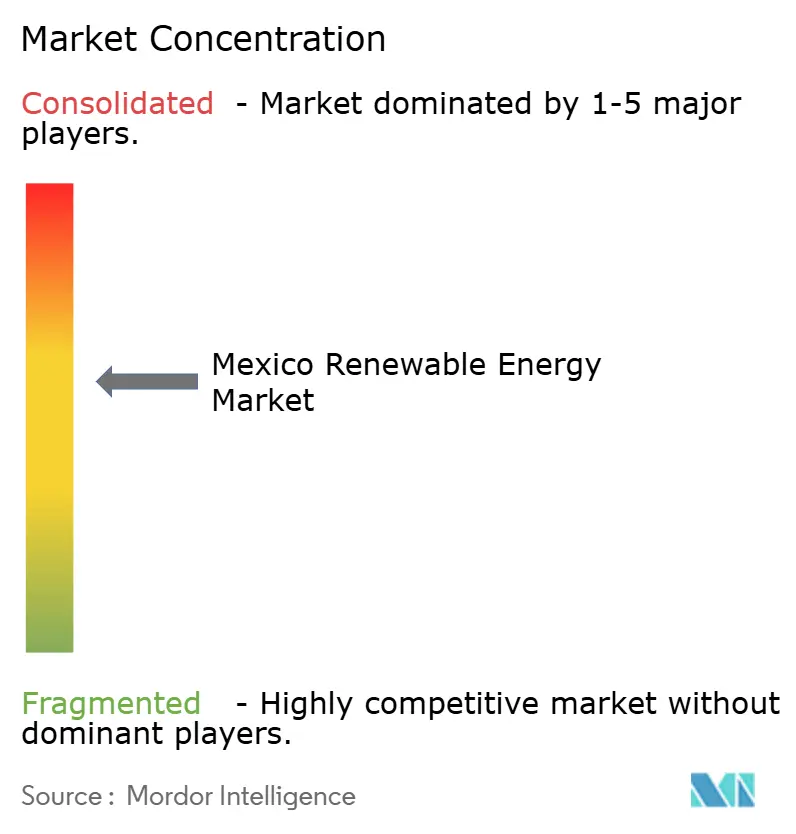
| Market Concentration | Medium |
Major Players *Disclaimer: Major Players sorted in no particular order Image © Mordor Intelligence. Reuse requires attribution under CC BY 4.0. | |
Mexico Renewable Energy Market Analysis by Mordor Intelligence
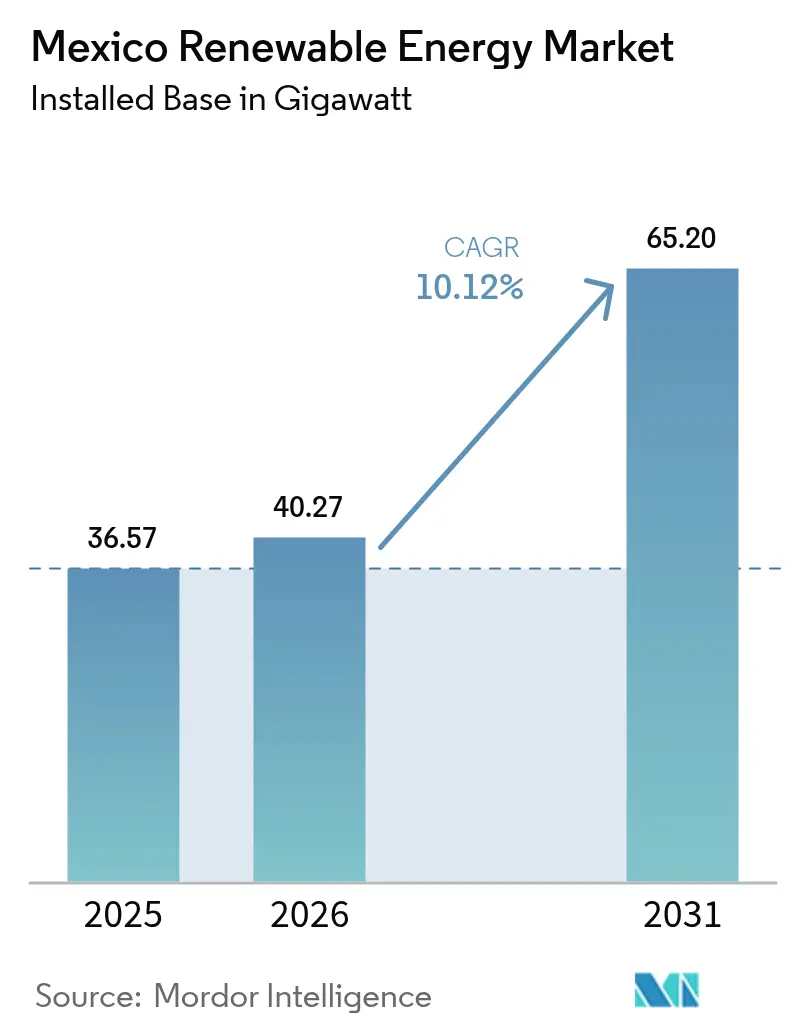
The Mexico Renewable Energy Market size is expected to grow from 36.57 gigawatt in 2025 to 40.27 gigawatt in 2026 and is forecast to reach 65.2 gigawatt by 2031 at 10.12% CAGR over 2026-2031.
Strong federal targets, cost-competitive solar photovoltaics, and fresh development-bank credit lines anchor this expansion while the new Electricity Sector Law preserves state control through the Federal Electricity Commission (CFE). Developers focus on high-irradiance northern states, repowering wind farms along the Gulf coast, and pairing batteries with new plants to clear interconnection queues. Corporate power-purchase agreements (PPAs) are increasingly bypassing utility procurement, funneling demand toward distributed generation systems with capacities below 10 MW. Meanwhile, peso volatility and local-content rules raise financing hurdles, prompting a decisive shift toward peso-denominated lending from NAFIN and Bancomext.
Key Report Takeaways
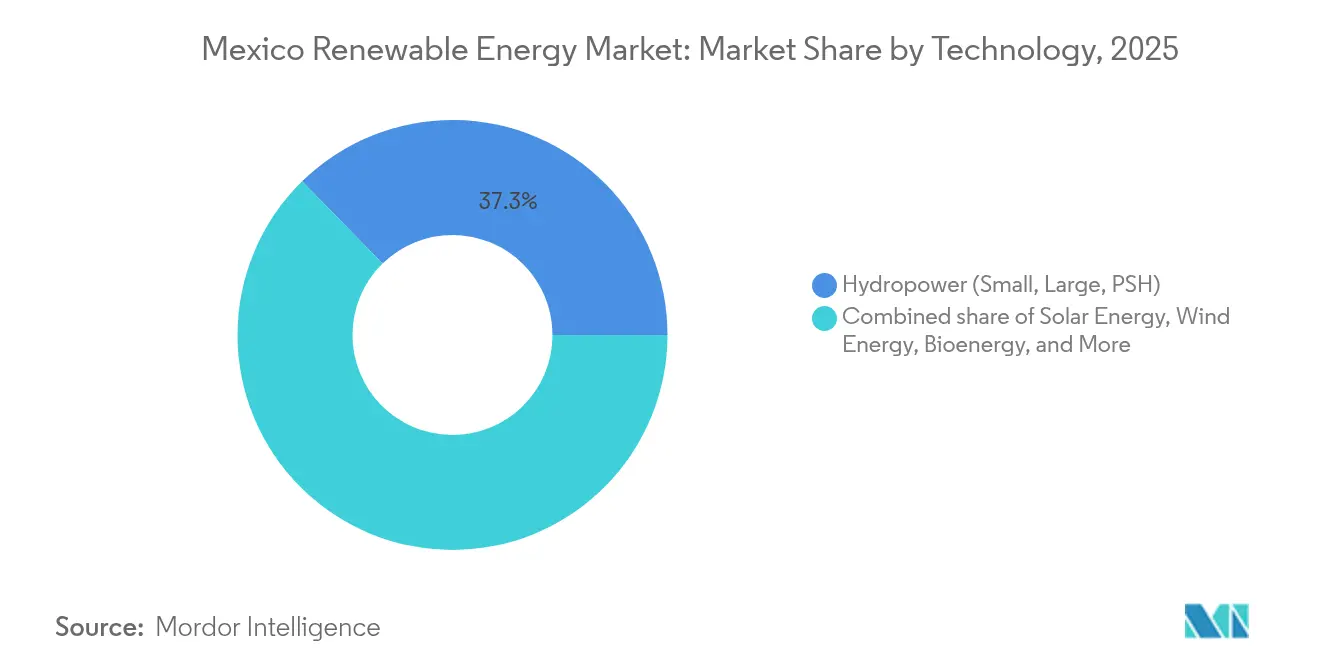
- By technology, hydropower accounted for 37.33% of the Mexican renewable energy market in 2025, while solar energy is advancing at a 14.02% CAGR through 2031.
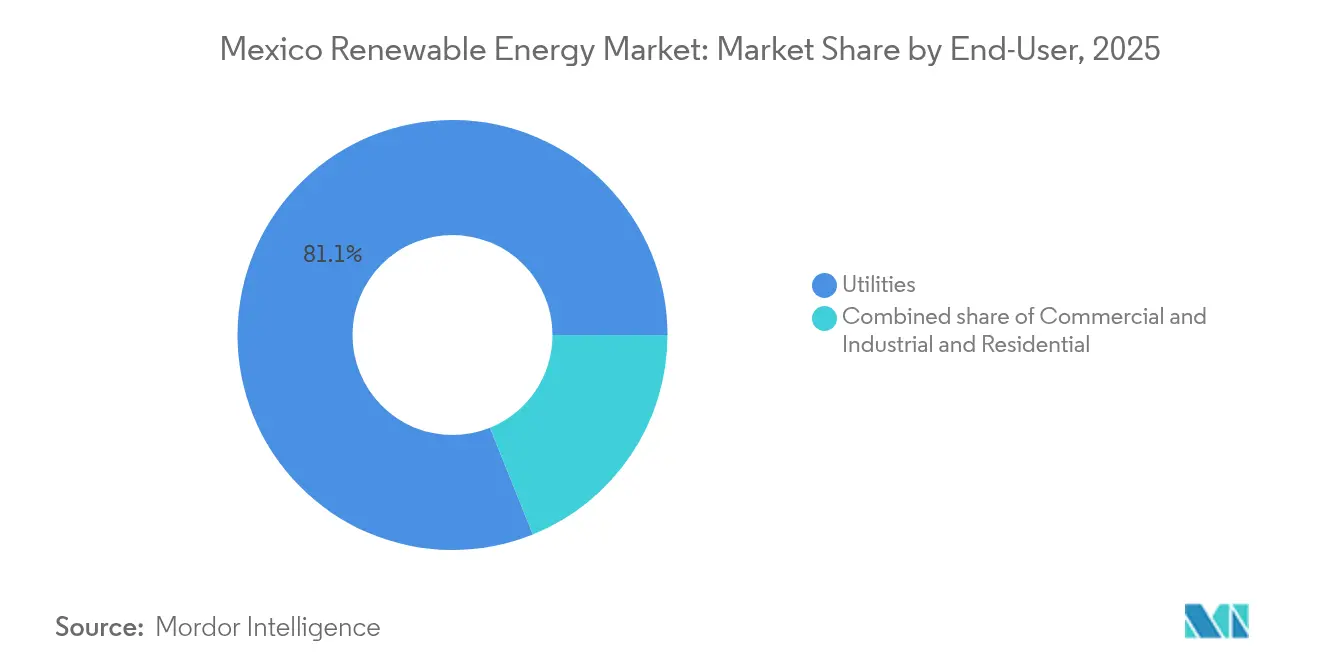
- By end-user, the utilities segment accounted for 81.10% of the Mexico renewable energy market size in 2025, while residential installations drove growth at a 14.25% CAGR.
Note: Market size and forecast figures in this report are generated using Mordor Intelligence’s proprietary estimation framework, updated with the latest available data and insights as of 2026.
Mexico Renewable Energy Market Trends and Insights
Drivers Impact Analysis*
| Driver | (~) % Impact on CAGR Forecast | Geographic Relevance | Impact Timeline |
|---|---|---|---|
| Solar PV LCOE continues to undercut combined-cycle gas | +2.8% | National, with strongest gains in northern states (Sonora, Chihuahua) and Yucatán Peninsula | Medium term (2-4 years) |
| PPAs backed by corporate sustainability targets (C&I demand) | +1.9% | National, concentrated in industrial corridors (Nuevo León, Querétaro, Guanajuato) | Short term (≤ 2 years) |
| Wind repowering potential of ageing northern-coast farms | +1.5% | Oaxaca, Tamaulipas, Nuevo León | Medium term (2-4 years) |
| Grid-connected battery hybrids approved under CEL reform | +1.7% | National, early deployments in Baja California and Sonora | Long term (≥ 4 years) |
| Climate-linked development-bank credit lines (NAFIN, Bancomext) | +1.2% | National, prioritizing small and medium enterprises | Medium term (2-4 years) |
| Source: Mordor Intelligence | |||
Solar PV LCOE Continues to Undercut Combined-Cycle Gas
The average utility-scale solar levelized cost of electricity reached USD 51/MWh in 2024, decisively lower than the gas-fired alternative, which must account for fuel volatility pricing.[1]International Energy Agency, “Renewables 2025 Analysis,” iea.org Mexico’s high solar irradiation, often exceeding 2,000 kWh/m², drives capacity factors that outclass those of its global peers and reshape merit-order dispatch. Gas units now shift toward peaking roles, stranding investments and freeing roughly USD 1.6 billion in annual US gas import costs.[2]Ember Climate, “Mexico Gas Import Savings Through Renewables,” ember-climate.org Solar’s zero marginal cost sharpens midday price troughs, prompting grid operators to heighten voltage and frequency controls. Developers counter curtailment risk by colocating battery storage, extracting peak-shaving and capacity-market revenues that lift project returns.
PPAs Backed by Corporate Sustainability Targets Drive C&I Demand
Multinational manufacturers, including General Motors, lock in fixed-price renewable PPAs to meet global decarbonization mandates, driving a 14.60% CAGR for commercial and industrial installations. Self-supply permits allow firms to skirt traditional utility tendering and transact bilaterally over private lines, while clean-energy certificates confirm compliance. Grupo Bachoco’s 26 MW distributed solar program, spanning 19 states, highlights how aggregated commercial and industrial (C&I) loads can achieve utility-scale economics. PPA tenors of 15-20 years reduce exposure to peso swings when paired with dollar-indexed clauses, anchoring long-term viability.
Wind Repowering Potential of Ageing Northern-Coast Farms
First-generation wind assets on the Tamaulipas coast approach life-cycle maturity. Modern turbines that double their nameplate capacity unlock a 1.4 percentage-point increase in the Mexico renewable energy market's CAGR. The Victoria project already yields 184 GWh per year on 49.5 MW capacity, displacing 72,345 tCO₂. Repowering leverages existing interconnection rights, reduces permitting lead times, and streamlines community consultations on land use. Sempra Infrastructure's 320 MW Cimarron expansion typifies investors banking on proven wind regimes and grid access.
Grid-Connected Battery Hybrids Approved Under CEL Reform
The March 2025 storage mandate confers clean-energy-certificate eligibility to renewable-plus-storage hybrids, raising the addressable revenue stack by 1.2 percentage points. Invenergy’s La Toba plant pairs 35 MW solar with 20 MW batteries to deliver ramping, frequency, and capacity services in fuel-scarce Baja California Sur. Streamlined interconnection protocols reduce approval times, while standardized technical codes ensure compliance with grid codes. Developers leverage merchant battery revenue to hedge intermittency congestion penalties under the new dispatch regime.
Restraints Impact Analysis*
| Restraint | (~) % Impact on CAGR Forecast | Geographic Relevance | Impact Timeline |
|---|---|---|---|
| Intermittency congestion on Sistema Interconectado Nacional | -1.90% | National grid nodes | Short term (≤ 2 years) |
| Policy uncertainty post-2028 plan review | -2.10% | Nationwide | Long term (≥ 4 years) |
| Rising WACC tied to peso depreciation | -1.10% | National financing | Short term (≤ 2 years) |
| OEM supply-chain exposure to USMCA rules | -0.80% | Manufacturing hubs | Long term (≥ 4 years) |
| Source: Mordor Intelligence | |||
Intermittency Congestion on the Sistema Interconectado Nacional
Variable generation has outpaced transmission build-out, slicing 1.9 percentage points off the Mexico renewable energy market CAGR. Only 2,600 km of new lines came online in five years, while 4,038 km remain under construction, forcing curtailments at peak production. Grid operator CENACE relies on thermal units to balance frequency, which escalates ancillary-service costs and erodes solar’s price advantage. Planned ±500 kV corridors aim to relieve congestion by 2027; however, permitting delays threaten to compromise timelines. Developers hedge exposure via hybrid storage or location-based hedging instruments to stabilize revenues.
Policy Uncertainty Post-2028 National Electricity Plan Review
The mandated 2028 policy review is expected to hinder growth as investors weigh potential shifts to CFE dominance.[3]Lourdes Melgar, “Mexico’s Electricity Reform and the State’s Role,” Baker Institute for Public Policy, bakerinstitute.org Prior reversals, such as dissolving autonomous regulators, signal unpredictability in governance. The horizons of clean-energy certificates, which are only two years, clash with 20-year asset lives, complicating revenue modeling. Sponsors are increasingly embedding change-in-law clauses and seeking multilateral wrap-around guarantees to mitigate regulatory risk.
*Our forecasts treat driver/restraint impacts as directional, not additive. The impact forecasts reflect baseline growth, mix effects, and variable interactions.
Segment Analysis
By Technology: Solar Surges as Hydropower Holds Baseload
Hydropower retained 37.33% of Mexico's renewable energy market share in 2025, primarily driven by legacy dams such as Chicoasén and La Angostura, which supply firm power throughout the year. The segment benefits from existing reservoirs, mature operations and maintenance (O&M) routines, and limited environmental opposition compared to new large dams. Pumped-storage retrofits in northern states are under review, which could add peak-shaving flexibility without new impoundments. Solar is advancing at a 14.02% CAGR to 2031, the fastest clip within the Mexico renewable energy market, aided by continued module-cost deflation and a wave of corporate PPAs for distributed rooftops. CFE's plan to build nine utility-scale solar plants totaling 4.673 GW underscores the state utility's pivot toward photovoltaic capacity in inexpensive desert land across Sonora, Chihuahua, and Durango.
Repowering keeps wind competitive; 2.5 GW in the Isthmus of Tehuantepec will replace aging 2 MW turbines with 5 MW-plus machines, boosting production without requiring new land leases. Geothermal remains steady at approximately 950 MW from Los Azufres and Los Humeros, providing a valuable baseload for the Mexican renewable energy industry, despite capital-constrained expansion drilling. Bioenergy projects fueled by bagasse and municipal waste operate near sugar mills in Veracruz and Jalisco, selling surplus electricity into the grid while supplying process heat onsite. Ocean energy is still nascent; regulatory standards for marine technologies are pending, which keeps private investment sidelined.


By End-User: Residential Gains as Utilities Retain Dominance
Utilities captured 81.10% of total demand in 2025, reflecting the statutory priority of CFE and legacy PPAs signed before the 2025 reform. The March 2025 law secures CFE at ≥54% generation share, limiting merchant developers’ runway but also guaranteeing offtake for preferred hybrid projects that bolster grid reliability. Residential demand is expanding at a 14.25% CAGR and has topped 1.2 GW of distributed capacity in 2024, as net-metering now credits surplus power at 90% of the retail tariff, yielding paybacks of 5 to 7 years for typical rooftops. Geographic clustering is observed in higher-income districts of Mexico City, Monterrey, and Guadalajara, where high tariffs and accessible financing drive adoption patterns.
Commercial and industrial buyers are relying on behind-the-meter arrays that cover 30–50% of their daytime electricity needs, shielding them from grid-tariff escalation, which reached an 8% average increase in 2024. Auto-parts suppliers in Nuevo León are increasingly combining rooftop arrays with ground-mount carport systems to maximize on-site generation. The regulatory obligation to report private PPAs to SENER adds paperwork, but it has not slowed contracting volume; price certainty and ESG signaling outweigh the administrative costs. As distributed generation steps in where transmission is saturated, mid-sized developers are carving out profitable niches within the Mexico renewable energy industry.
Geography Analysis
Northern states, Sonora, Chihuahua, and Nuevo León, anchor solar growth, with irradiation surpassing 2,000 kWh/m² annually, delivering capacity factors of nearly 29%. Tamaulipas and Oaxaca continue to be wind stalwarts, hosting repowering campaigns that recycle grid interconnections and expedite commissioning. The Yucatan Peninsula, short on pipelines yet flush with tourism-driven load, demands a USD 30 billion grid overhaul by 2029 that will pair battery hybrids with solar peaker units.
Central Mexico, encompassing Mexico City and Guadalajara, excels at distributed solar for manufacturing clusters. PPAs often bundle renewable energy with voluntary carbon credits, cementing corporate decarbonization strategies. Cross-border opportunities on the Baja California-San Diego corridor hinge on synchronizing regulatory regimes under the USMCA to facilitate clean-power exports once transmission upgrades conclude in 2027.
Southern highlands leverage hydro and geothermal baseload yet wrestle with rugged terrain and slow right-of-way acquisition. Climate resilience planning now factors cyclonic rainfall patterns that threaten dam safety and wind-farm foundations. Emerging tidal prospects in Cozumel mark an early diversification into marine renewables, but the commercial impact will remain marginal through the forecast horizon.
Regulatory Landscape
Mexico's renewable power development is framed by the March 2025 Ley del Sector Eléctrico, anchored by the Federal Electricity Commission (CFE) and establishing a public participation framework in generation. The October 2025 Reglamento operationalized permitting, compliance, and market rules, with planning and interconnection governance carried out under CENACE. In 2026, PLADESE became the central roadmap for infrastructure development, tightening the linkage between capacity approvals, transmission priorities, and grid-operation needs. The June 2026 expansion plan, MX$739 billion to add 32,000 MW by 2030 with 70% from renewable and clean technologies, reinforces the role of state planning and mixed development schemes as the main channel for scaling renewable capacity under the current framework.
Competitive Landscape
Market leadership rests on a moderate concentration of global utilities and domestic conglomerates that are able to ride regulatory shifts while sustaining balance-sheet strength. Iberdrola, Enel, and Acciona each exceed 1.2 GW operational capacity, leveraging digital O&M platforms to shave downtime and earn CENACE ancillary revenue. Sempra Infrastructure diversifies into storage-linked projects such as Cimarron, demonstrating technical synergies across gas, LNG, and renewables.
CFE remains the anchor player, funneling USD 12.3 billion into renewable additions and hydro retrofits while retaining dispatch prerogatives that can curtail private competitors during grid stress events. Domestic IPPs, such as Zuma Energía and Cubico, target solar and wind niches that majors overlook due to their size or land tenure complexity. Financing access increasingly differentiates winners: entities securing blended-finance tranches from the EIB, NADB, or NAFIN close deals faster and at lower interest rates.
Technology differentiation intensifies around hybrid solar-plus-storage designs, LIDAR wind-site validation, and AI-driven curtailment forecasting. Supply-chain localization remains a looming risk; firms investing in domestic blade or module assembly aim to pre-empt USMCA compliance issues and shorten shipping timelines. Competitive parity will likely hinge on holistic solutions, combining generation, demand response, and grid services, rather than lowest-cost kilowatt-hour alone.
Mexico Renewable Energy Industry Leaders
Comisión Federal de Electricidad (CFE)
Iberdrola SA
Acciona Energía
Enel Green Power
Zuma Energía
- *Disclaimer: Major Players sorted in no particular order

Market Opportunities and Future Outlook
Under PLADESE, planning and procurement are anchored by a centralized development path that allows developers and suppliers to participate in CFE-anchored procurement while meeting stricter technical and administrative requirements. The first mixed development scheme award in 2026, awarding 7,411 MW across 37 projects, shows how a central pipeline connects private capital and technology partners to state-led buildouts. The March 2025 storage mandate and CEL eligibility for hybrids encourage designs that mitigate congestion on the Sistema Interconectado Nacional and support grid reliability. Corporate demand continues to expand for distributed and behind-the-meter systems, with large industrial groups using private PPA contracting. Peso-denominated financing channels through NAFIN and Bancomext support localized execution and storage-enabled portfolios aligned with CENACE planning.
Recent Industry Developments
- July 2026: Polaris Renewable Energy signed a mixed investment agreement with CFE covering three solar projects totaling 249 MW. The deal highlights how private developers are participating in utility-scale builds through the new mixed model, while aligning offtake structures with CFE-backed contracting.
- June 2026: CFE concluded its first Mixed Development Schemes tender, awarding 7,411 MW across 37 renewable projects after evaluating more than 80 proposals launched in February 2026. The scale of the award re-establishes a large, centralized route to market for renewables and sets a benchmark for bankable PPAs tied to CFE-led planning.
- November 2024: Mexico published a National Electric Strategy outlining a project-based roadmap and execution-focused programs. The document described phased deployments and grid integration considerations that fed into later reforms in planning and deployment. This development established a formal framework that guided subsequent planning instruments and implementation efforts.


Research Methodology Framework and Report Scope
Market Definition and Coverage
For this market, we size renewable power in Mexico in terms of installed capacity (GW) across solar, wind, hydropower, bioenergy, geothermal, and ocean energy, and we map it to the main end users that take power from these assets.
Scope exclusions: Installed capacity only is counted, so electricity sales value, renewable certificates, transmission and distribution, and stand alone storage capacity are not included.
Segmentation Overview
- By Technology
- Solar Energy (PV and CSP)
- Wind Energy (Onshore and Offshore)
- Hydropower (Small, Large, PSH)
- Bioenergy
- Geothermal
- Ocean Energy (Tidal and Wave)
- By End-User
- Utilities
- Commercial and Industrial
- Residential
Data Sources, Market Sizing, and Validation
Desk Research
Desk work started with public energy statistics to ground the installed base and new additions by technology. We mainly relied on official and open sources such as Mexico energy and electricity regulators and agencies, the International Energy Agency, IRENA, and World Bank indicators to cross-check generation mix and renewables capacity trends.
After that, project and policy context was added using sources such as government auction and permitting updates, grid planning notes, trade association publications, peer reviewed energy journals, and company filings and investor presentations for pipeline color. For triangulation, we also used paid subscriptions for company financials and intelligence, news and financials, and patent databases to verify timelines and technology direction. These desk sources are illustrative only, and many other public references were also used to collect, validate, and clarify specific data points.
Primary Interviews and Surveys
Primary work was used to confirm what is getting built and connected, not just what is announced. We spoke with a mix of developers, EPCs, equipment suppliers, utilities, and large C&I buyers, plus advisors who track permitting and interconnection, covering major demand centers and resource-heavy states across Mexico.
Respondent input helped us validate capacity factors used in sense checks, typical construction timelines, expected delays, and realistic commissioning schedules, then tightened assumptions where secondary data was thin.
Distribution of primary research fieldwork respondents
| Company type | Respondent position |
|---|---|
| Top tier: 37% | CXOs: 15% |
| Mid tier: 45% | Functional/Unit leaders: 34% |
| Smaller Players: 18% | Managers: 51% |
Market-Sizing & Forecasting
Sizing was built using a top-down approach where official installed-capacity series, technology split, and recent additions were used to reconstruct the demand pool, which was then carried forward by technology specific build rates. To keep results realistic, we also ran selective bottom-up checks by rolling up a sample of announced and under-construction projects and comparing implied annual additions versus the model.
Key inputs used in the model included historical capacity additions by technology, policy signals affecting buildout timing, interconnection and permitting friction (as discussed by industry participants), typical commissioning lead times, and the pipeline of utility scale and distributed projects. For sense checks, we compared implied generation contribution using typical capacity factors, which helps flag cases where capacity growth would not match the expected power mix.
Forecasting was done using scenario analysis supported by expert views on permitting speed, financing appetite, and grid constraints. Where project level data was incomplete, gaps were handled by applying conservative probability weights to the pipeline and keeping additions aligned to what has been executed historically in Mexico.
Data Validation & Update Cycle
Outputs were validated through multiple cross-checks, including comparing implied annual additions against public capacity trackers and checking that technology shares move in a plausible way year to year. Any large jumps were reviewed, assumptions were revisited, and follow-up calls were triggered when new policy changes or major project delays were flagged.
Before sign-off, a second analyst reviews calculations and unit consistency, and then a final variance pass is done against independent indicators like tender activity and interconnection discussions. Reports are refreshed annually, with interim updates when material events occur, and a last refresh pass is completed before delivery so the client receives the latest view.
Mordor Intelligence's Mexico Renewable Energy Market Sizing Compared With Other Published Estimates
Published estimates for Mexico renewable energy do not always match because some sources report value while others report installed capacity, and the year ranges and technology buckets can be different. Differences also come from how pipelines are treated, how quickly delays are assumed to clear, and whether currency and inflation are applied at all.
Electricity generation revenue and power prices sit outside Mordor Intelligence's scope here, so the market is expressed in installed capacity (GW), and that alone can create a wide spread versus value-based publications. Another driver is how hydropower and pumped storage are handled, since some sources simplify categories or shift them into a broader clean energy definition, which changes totals even when the underlying assets are similar.
Benchmark comparison
| Source | Market Size | Gaps in Research Methodology |
|---|---|---|
| Mordor Intelligence | USD 40.27 B (2026) | |
| Regional Consultancy A | USD 7.40 B (2024) | Uses revenue valuation for renewable electricity and related spending, which is not directly comparable to installed-capacity sizing, and the base year differs from the capacity build cycle used here. |
| Industry Publisher B | USD 38.70 B (2025) | Reports in GW but uses a different forecast window and technology grouping, with fewer details on how pumped storage and smaller bioenergy assets are counted across end users. |
Taken together, differences in units, base years, and technology-bucket definitions explain most of the gap across sources. By keeping the model tied to observable capacity additions and then pressure-testing it with project roll-ups and expert checks, the final number stays traceable to clear inputs and repeatable steps.


Key Questions Answered in the Report
How large is the Mexico renewable energy market in 2026?
The Mexico renewable energy market size reaches 40.27 GW in 2026 and is projected to hit 65.2 GW by 2031.
Which technology is growing fastest within the market?
Solar power leads growth, advancing at a 14.02% CAGR through 2031 on the back of falling module costs and mandated battery hybrids.
How does the new Electricity Sector Law affect private developers?
The law reserves 54% generation for CFE, yet leaves 46% available to private firms, creating a hybrid public-private model that still enables independent growth.
Why are Clean Energy Certificates important after the 2025 reform?
The restored CEL scheme lets hybrid battery projects earn tradable certificates, adding a new revenue stream and boosting project bankability.
How is policy uncertainty affecting new projects?
Anticipation of the 2028 National Electricity Plan has widened financing spreads and delayed some greenfield investments, particularly for offshore wind and advanced geothermal.
Page last updated on:


 Your data is secure and never sold or shared.


