
Market Overview
| Study Period | 2021 - 2031 |
|---|---|
| Forecast Data Period | 2026 - 2031 |
| Base Year Market Size (2025) | USD 8.38 Billion |
| Market Size (2026) | USD 8.51 Billion |
| Market Size (2031) | USD 9.19 Billion |
| Growth Rate (2026 - 2031) | 1.56 % |
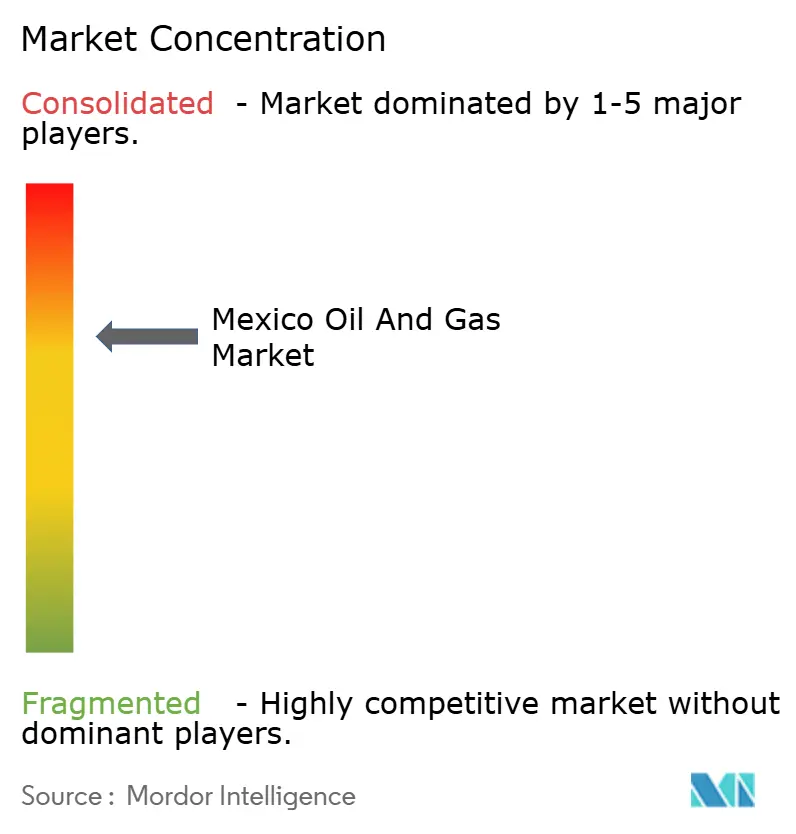
| Market Concentration | Medium |
Major Players *Disclaimer: Major Players sorted in no particular order Image © Mordor Intelligence. Reuse requires attribution under CC BY 4.0. | |
Mexico Oil And Gas Market Analysis by Mordor Intelligence
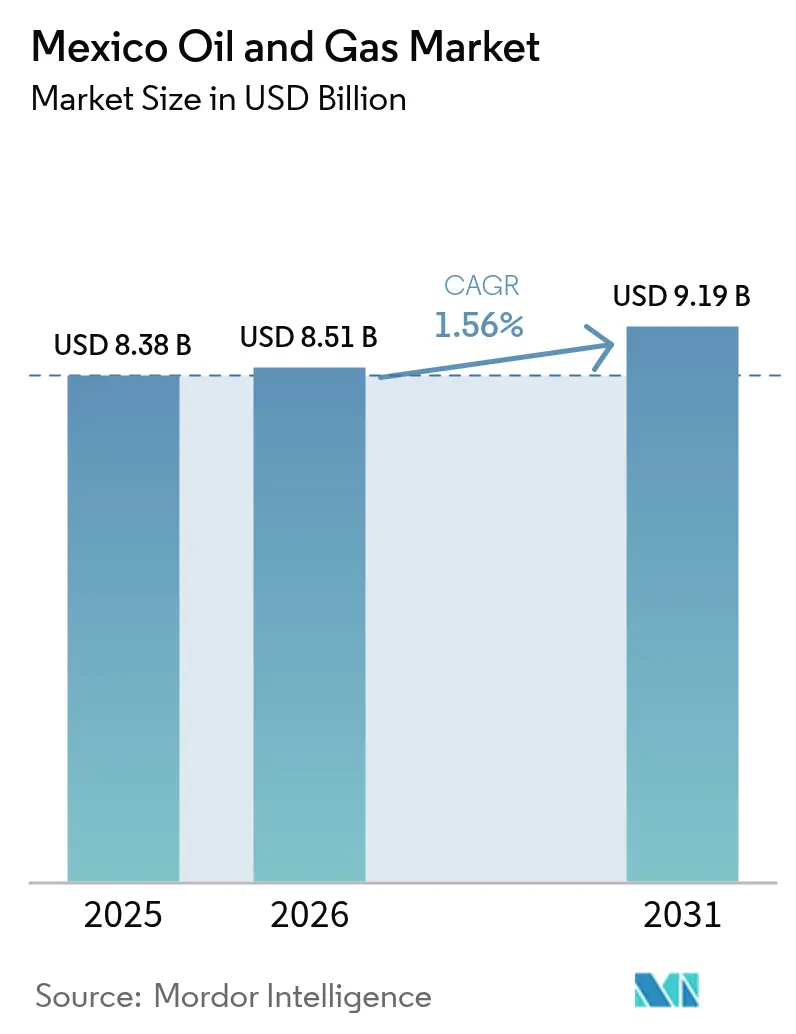
Mexico Oil And Gas Market size in 2026 is estimated at USD 8.51 billion, growing from 2025 value of USD 8.38 billion with 2031 projections showing USD 9.19 billion, growing at 1.56% CAGR over 2026-2031.
The modest pace demonstrates how the Mexican oil and gas market is transitioning from decades of state dominance toward a mixed model, in which Petróleos Mexicanos (Pemex) remains central while collaborating selectively with private partners. Upstream spending still accounts for three-quarters of total investment, but the fastest growth comes from downstream initiatives tied to the USD 16.8 billion Olmeca refinery and a national mandate for fuel self-sufficiency. Cross-border pipeline additions reduce feedstock costs and encourage gas-fired generation, while deepwater projects such as Trion and Zama promise to stem production declines. Nevertheless, the Mexican oil & Gas market faces structural headwinds from Pemex’s USD 101.5 billion debt and policy reversals that favor state control, tempering private-sector enthusiasm.[1]
Key Report Takeaways
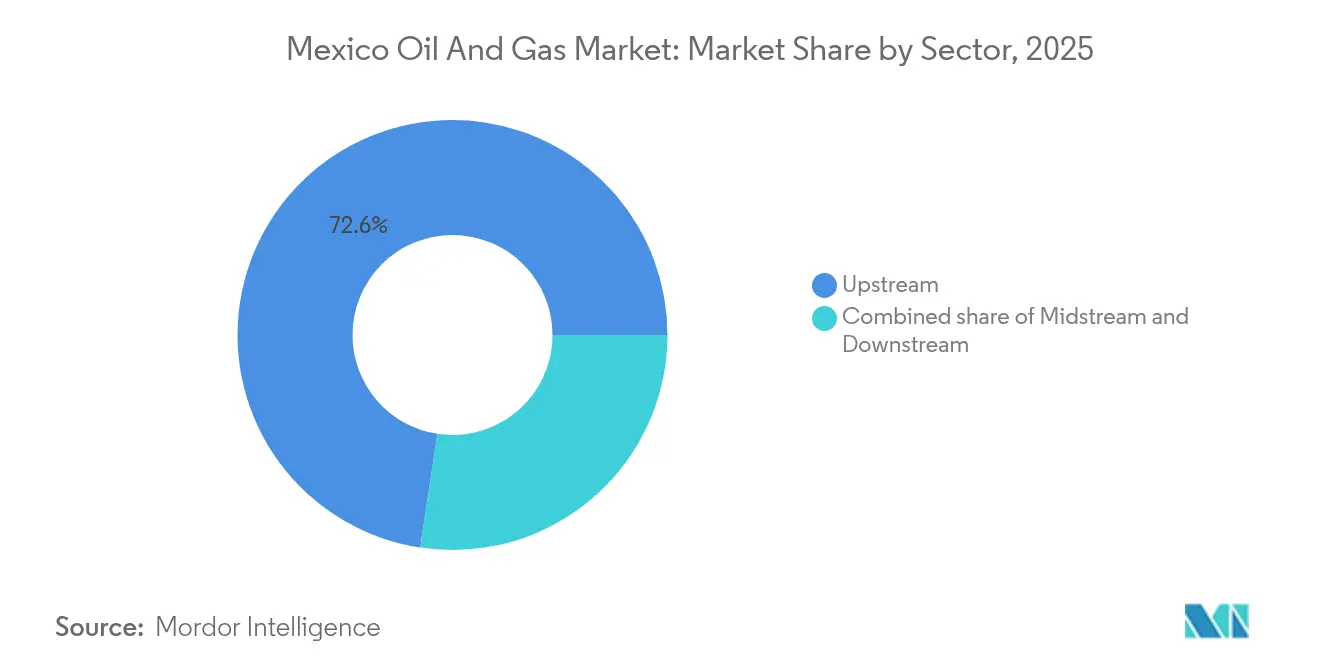
- By sector, upstream operations accounted for 72.60% of the Mexican oil and gas market share in 2025, whereas downstream operations recorded the fastest growth rate of 2.26% toward 2031.
- By location, onshore assets held 65.30% of the Mexico oil and gas market share in 2025; offshore activities are projected to grow at a 2.22% CAGR through 2031, driven by deepwater developments.
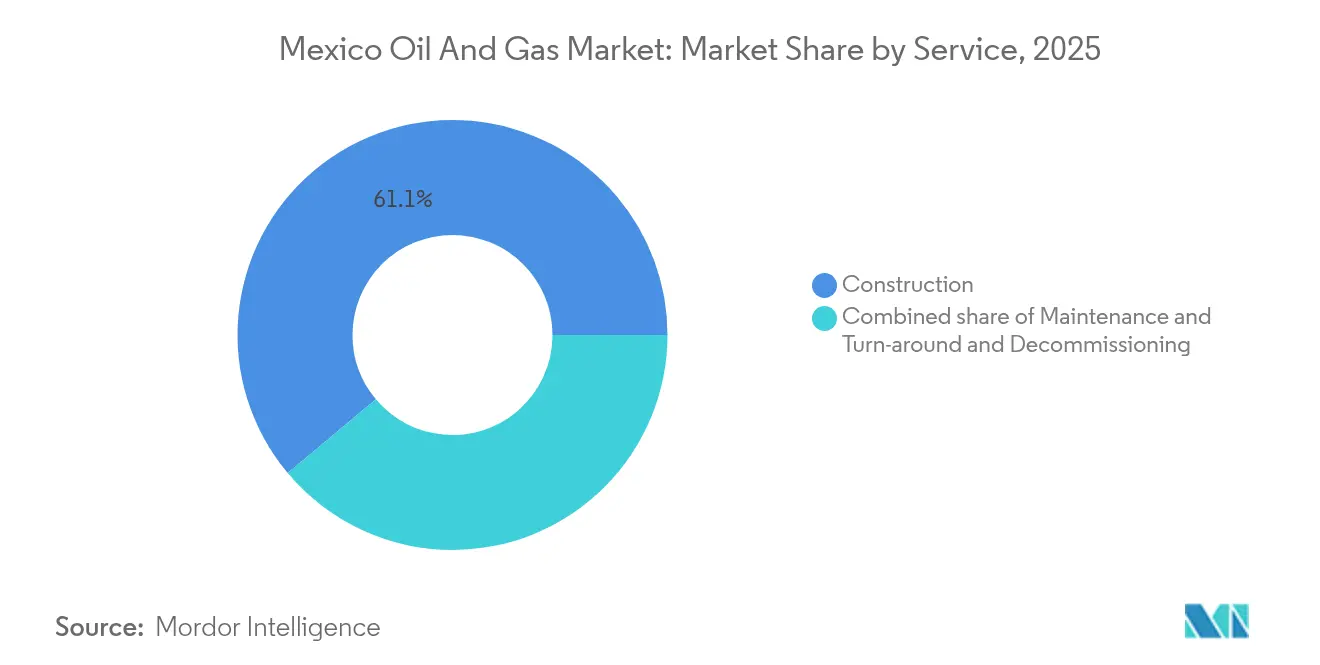
- By service, construction commanded 61.10% of the Mexico oil and gas market size in 2025, while decommissioning is projected to expand at a 4.86% CAGR to 2031
Note: Market size and forecast figures in this report are generated using Mordor Intelligence’s proprietary estimation framework, updated with the latest available data and insights as of 2026.
Market Trends and Insights
Drivers Impact Analysis of Mexico Oil And Gas Market*
| Driver | (~) % Impact on CAGR Forecast | Geographic Relevance | Impact Timeline |
|---|---|---|---|
| Liberalization of upstream bidding rounds attracts IOCs | +0.8% | Gulf of Mexico offshore blocks, Sureste Basin | Medium term (2-4 years) |
| Rising natural-gas‐fired generation boosts domestic gas demand | +0.6% | National, concentrated in industrial corridors | Short term (≤ 2 years) |
| Deep-water discoveries in Gulf of Mexico enter development phase | +0.4% | Offshore Campeche, Tabasco waters | Long term (≥ 4 years) |
| Growth of LNG bunkering hubs opens new offtake channel | +0.3% | Veracruz, Altamira ports | Medium term (2-4 years) |
| Expansion of cross-border US–Mexico gas pipelines lowers feed-stock costs | +0.5% | Northern border states, Southeast region | Short term (≤ 2 years) |
| Pilot CCS-EOR projects enhance recovery factors | +0.2% | Tampico-Misantla basin, mature fields | Long term (≥ 4 years) |
| Source: Mordor Intelligence | |||
Liberalization of upstream bidding rounds attracts IOCs
Mexico reopened competitive hydrocarbon tenders in 2024, and the streamlined process has already drawn USD 2.3 billion in commitments from Shell, Chevron, and TotalEnergies to deepwater prospects in the Sureste Basin. The basin holds an estimated 12 billion barrels of recoverable resources, making it a magnet for international technologies such as high-spec subsea trees that optimize flow assurance. Mixed Development Schemes finalized in April 2025 allow Pemex to retain a majority equity stake while leveraging partner expertise, striking a balance between sovereignty and innovation.[2] Contract transparency remains decisive; fines imposed on Eni and Shell for work-program slippage underscore regulators’ intent to enforce timelines.[3] Over the medium term, steady bid rounds could add 250,000 barrels per day of new output.
Rising natural-gas-fired generation boosts domestic gas demand
Mexico plans to add 10.1 GW of new combined-cycle capacity by 2030, thereby increasing natural gas’s share of the power mix and boosting pipeline imports from the United States to 6.4 billion cubic feet per day (Bcf/d) by December 2024. Industrial corridors have seen a 15% rise in electricity consumption tied to near-shoring ventures, intensifying short-term demand growth. Domestic gas output declined to 4.4 Bcf/d in January 2025, widening the supply gap and prompting projects such as the 287-km Hidalgo-Puebla pipeline, which was announced in January of that year. Gas now fuels 40% of CFE’s installed capacity after the San Luis Potosí plant came online in 2025.
Deep-water discoveries in Gulf of Mexico enter development phase
Woodside Energy’s Trion project, a USD 7 billion venture targeting first oil in 2028, marks Mexico’s inaugural deepwater production and will utilize a 100,000-barrel-per-day FPSO to monetize reserves at a water depth of 2,500 meters.[4] SLB won an 18-well drilling contract in April 2025 that leverages AI well-placement systems to cut non-productive time. Parallel efforts at the 180,000-barrel-per-day Zama field advance under a USD 4.5 billion plan overseen by DORIS Group. Eni’s 2024 Sureste Basin find further builds the deepwater queue.
Growth of LNG bunkering hubs opens new offtake channel
New Fortress Energy shipped Mexico’s first LNG cargo from Altamira in July 2024, inaugurating a 1.4 Mtpa floating facility that anchors Gulf coast exports. On the Pacific side, Sempra’s 3 Mtpa Energia Costa Azul project is expected to enter commercial service in mid-2025, allowing Permian gas to reach Asian buyers without being constrained by the Panama Canal. Pilot LNG and GFI LNG plan a bunkering hub at Salina Cruz to supply trans-Pacific vessels, while Coatzacoalcos secured a land concession in June 2025 for an LNG terminal serving both ocean basins.
Restraints Impact Analysis of Mexico Oil And Gas Market*
| Restraint | (~) % Impact on CAGR Forecast | Geographic Relevance | Impact Timeline |
|---|---|---|---|
| Regulatory reversals under energy-reform rollback create uncertainty | -0.4% | National, affecting all private operators | Short term (≤ 2 years) |
| Chronic under-investment in legacy refineries limits downstream margins | -0.3% | Tabasco, Veracruz, Tamaulipas refinery locations | Medium term (2-4 years) |
| Community opposition delays long-haul onshore pipeline ROW acquisition | -0.2% | Indigenous territories, rural communities | Medium term (2-4 years) |
| Talent gap slows adoption of digital oil-field solutions | -0.1% | Technical centers, offshore operations | Long term (≥ 4 years) |
| Source: Mordor Intelligence | |||
Regulatory reversals under energy-reform rollback create uncertainty
President Sheinbaum consolidated CRE and CNH into a new National Energy Commission in 2025, re-centralizing oversight under SENER and prioritizing 54% public control of power generation. The amended Hydrocarbons Law favors Pemex in upstream allocation, prompting some IOCs to freeze new acreage bids. The pause in future bid rounds narrows the exploration pipeline. Pending court challenges and the prospect of contract renegotiations compound short-term uncertainty.
Chronic under-investment in legacy refineries limits downstream margins
Pemex’s six legacy refineries averaged just 53.7% utilization in 2024 despite MXN 72 billion in upgrades, reflecting aging units ill-suited to heavy-sulfur Mexican crude. The new Olmeca refinery achieved initial output in August 2024 but still faces challenges related to ramp-up hurdles, including issues with feedstock quality and weather disruptions. High operating costs compress margins and discourage private capital. Pemex’s USD 101.5 billion debt further constrains spending on catalytic crackers and desulfurization units that could lift yields.
*Our forecasts treat driver/restraint impacts as directional, not additive. The impact forecasts reflect baseline growth, mix effects, and variable interactions.
Mexico Oil And Gas Market Segment Analysis
By Sector:
Upstream Dominance Drives Market StructureUpstream activity captured 72.60% of the Mexican oil & gas market in 2025 as companies raced to replace maturing reserves. Development commitments totaling more than USD 11 billion, including Trion, Zama, and Lakach, anchor upstream visibility through 2031. Yet, the downstream build-out shows the strongest momentum, with the segment advancing at a 2.26% CAGR, driven by the Olmeca refinery and upgrades to Cadereyta and Salina Cruz. These investments signal a determination to cap refined-product imports at a level now equal to 56.8% of domestic demand.
The Mexico oil and gas market size attributed to the downstream sector is projected to rise to USD 2.68 billion by 2031, thereby increasing its share of the overall market. Midstream operators, such as TC Energy, allocate USD 3.9 billion to the Southeast Gateway pipeline, ensuring a steady supply of feedstock for the new refining and power fleet. Collectively, these flows align with government objectives for energy security and industrial growth.

By Location:
Offshore Expansion Balances Onshore MaturityOnshore acreage delivered 65.30% of the Mexico Oil & Gas market share in 2025, supported by legacy fields in Tabasco and shallow-water Campeche. Nonetheless, offshore projects show stronger traction, advancing at a 2.22% CAGR as Perdido Fold Belt hubs come online. Technologies such as subsea compression and dynamic positioning rigs reduce lifting costs and enhance recovery at water depths exceeding 1,500 m.
As a result, the Mexico oil and gas market size for offshore operations is expected to exceed USD 3.24 billion by 2031. Risk mitigation improves because most subsea developments are located far from community protest zones that complicate land-based pipelines. Concurrently, onshore output in Tabasco declined from 511,000 bpd in July 2023 to 410,000 bpd in November 2024, demonstrating reservoir depletion.
By Service:
Construction Dominance Shifts to Decommissioning GrowthConstruction delivered 61.10% of Mexico's oil and gas market share in 2025, reflecting a heavy infrastructure cycle that spans deepwater platform fabrication, long-haul pipelines such as the Southeast Gateway, and Olmeca refinery builds. Firms like Saipem and SICIM supply specialized heavy-lift vessels and subsea lay spreads to meet deepwater engineering needs, signaling that Mexico has moved from exploration to full-scale development.
Maintenance and turnaround programs, which raise barriers to entry and favor service providers with a proven track record in the North Sea or U.S. Gulf, are vital yet mature, focusing on Pemex's aging refineries and offshore jackets that require integrity inspections, rotating-equipment overhauls, and corrosion mitigation. Decommissioning, although the smallest today, is the fastest-growing segment with a 4.86% CAGR through 2031, as Cantarell, Ku-Maloob-Zaap, and other mature hubs approach end-of-life obligations. New environmental rules require documented plugging and abandonment, topside removal, and seabed clearance to international standards, which raises barriers to entry and favors service providers with a proven track record in the North Sea or U.S. Gulf.
Cantarell alone hosts more than 200 wells and 24 platforms approaching decommissioning age, implying an anchor backlog for plug-and-abandon spreads, heavy-lift ships, and subsea cutting tools. Service providers that master regulatory reporting, contamination monitoring, and asset-transfer protocols secure a first-mover edge as the Mexico Oil & Gas market transitions into its retirement phase.
Geography Analysis
Southeastern states continue to dominate activity. Tabasco hosted 410,000 bpd in November 2024 and houses the Olmeca refinery, positioning the region as both a production and processing hub. Neighboring Campeche’s offshore province remains the bedrock of shallow-water output and serves as the jump-off point for deepwater programs. Veracruz balances onshore wells with midstream and LNG ambitions; the Altamira floating terminal achieved first cargo in July 2024.
Northern border states matter chiefly for gas transport. Tamaulipas and Nuevo León interconnect the United States supply to Mexican demand via the Sur de Texas-Tuxpan corridor and the forthcoming Southeast Gateway line, enabling cheaper feedstock for power plants. The Burgos Basin offers unconventional shale gas potential, though development hinges on regulatory clarity and water-usage rules.
Pacific coast entities such as Sonora and Baja California line up as export gateways. Energia Costa Azul will load its first LNG cargo in 2025, reducing congestion through the Panama Canal. Meanwhile, the Yucatán Peninsula seeks USD 30 billion in new lines and generation to meet the demands of tourism and industrial growth. The Tampico-Misantla basin in the east provides a testing ground for CCS-EOR, combining geological suitability with proximity to industrial CO₂ sources.
Regulatory Landscape
Mexico overhauled its hydrocarbons governance in 2025 by dissolving the Energy Regulatory Commission (CRE) and the National Hydrocarbons Commission (CNH) and consolidating oversight into the National Energy Commission (CNE) under the Ministry of Energy (SENER). The Hydrocarbons Sector Law (Ley del Sector Hidrocarburos) and the National Energy Commission Law (Ley de la Comision Nacional de Energia) were published on March 18, 2025, establishing a re-centralized policy framework with stronger state direction through Pemex and related agencies.
Secondary regulation was updated with the Regulation of the Hydrocarbons Sector Law published on October 3, 2025 (effective October 4, 2025). Implementation has extended into operational rulemaking for gas transportation. In 2026, the state gas system operator CENAGAS advanced a binding capacity allocation mechanism (MAC) for SISTRANGAS, highlighting a more administratively managed approach to pipeline access and balancing as Mexico relies on imported gas to support power generation and industrial demand.
Competitive Landscape
Pemex remains the anchor, yet the Mexican oil and gas industry now operates under a hybrid model. The state firm still handles 87.5% of gasoline and 80% of diesel retail volumes but increasingly turns to joint ventures for capital-intensive exploration. IOCs such as Chevron and TotalEnergies typically retain 20-35% equity in deepwater blocks, trading control for regulatory acceptance. Service giants, SLB, Halliburton, and Baker Hughes, differentiate through digital drilling tools, with SLB’s AI contract for Trion exemplifying a competitive edge.
Midstream remains more open. TC Energy is on schedule to commission the 2.6 Bcf/d Southeast Gateway in May 2025, while Kinder Morgan expands GCX to serve Pacific LNG terminals. New Fortress Energy’s first-in-class floating LNG shows how private firms can sidestep refining constraints and create export lanes.
Regulatory consolidation under SENER arguably tilts the advantage back toward state affiliates, yet Pemex’s fiscal burdens create space for capable partners. Recent Mixed Development Schemes keep Pemex above 50% ownership but allow outsiders to earn cost-recovery fees. Over the medium term, balance-of-risk structures will define competitiveness in the Mexican oil and gas market.
Mexico Oil And Gas Industry Leaders
-
Petroleos Mexicanos (Pemex)
-
Royal Dutch Shell PLC
-
BP PLC
-
Chevron Corporation
-
TotalEnergies SE
- *Disclaimer: Major Players sorted in no particular order
Mexico Oil And Gas Market Companies Covered in this Report
- Petróleos Mexicanos (Pemex)
- Royal Dutch Shell plc
- Chevron Corporation
- TotalEnergies SE
- BP plc
- Exxon Mobil Corporation
- Eni SpA
- Repsol S.A.
- Equinor ASA
- Citla Energy
- TC Energy Corporation
- Sempra Infrastructure
- Saipem SpA
- Schlumberger NV
- Baker Hughes Co.
- Woodside Energy Group
- Marathon Petroleum Corp.
- Trafigura Group Pte.
- Vitol SA
- SICIM SpA
Market Opportunities and Future Outlook
Near-term whitespace sits between state-led supply security goals and private execution capacity, particularly in gas processing, pipeline access, and brownfield reliability. Pemex has framed 2026 exploration and extraction capital investment at MX$102.1 billion, and the broader 2026-2030 energy roadmap includes a MX$739 billion investment package tied to system expansion and capacity additions. This creates demand for EPC, integrity management, and midstream debottlenecking around industrial corridors and the southeast.
Downstream opportunities also track those investments, extending into petrochemicals and fertilizers. Pemex has outlined a 93 billion peso plan with a stated role for mixed-investment schemes, which can support contractor participation in project delivery and operational upgrading. Unconventional gas is another emerging opportunity area, with the federal government establishing a scientific committee in April 2026 to evaluate hydraulic fracturing feasibility, potentially translating into service demand for subsurface appraisal, water management, and regulatory compliance capabilities if activity moves forward. Offshore and mature-field technology transfer also remains a practical route to capability-building, with Pemex's June 2026 collaboration memorandum with Petrobras creating a channel for deepwater and production know-how in a policy environment that prioritizes sovereignty while still allowing specialized partners and vendors.
Recent Industry Developments in Mexico Oil And Gas Market
- July 2026: CENAGAS began implementing a binding capacity allocation mechanism (MAC) for the SISTRANGAS natural gas pipeline network, administering a stated available capacity of 287,478 GJ/day through December 1, 2026. This formalizes how shippers access constrained grid capacity and raises the importance of firm contracting, balancing, and portfolio optimization for gas-dependent generators and industrial users.
- June 2026: Pemex signed a memorandum of understanding with Petrobras covering cooperation in hydrocarbon exploration and production and industrial transformation in the Gulf of Mexico. The agreement strengthens Pemex's access to deepwater and mature-asset operating experience and supports a partner-led pathway for complex offshore execution within a more state-directed sector framework.
- July 2024: New Fortress Energy shipped Mexicos first LNG cargo from Altamira, commissioning a 1.4 Mtpa floating facility on the Gulf Coast. The start-up added an export outlet and introduced a new demand sink for gas logistics and associated midstream services tied to Gulf ports and pipeline connectivity.
Mexico Oil And Gas Market Report Scope and Research Methodology
Market Definition and Coverage
For this study, the Mexico oil and gas market is sized as the value generated from oil and gas sector activity in Mexico, covering upstream, midstream, and downstream operations, and related services that directly support these activities.
Scope exclusions: Electricity generation revenue, petrochemicals manufacturing revenue, and retail fuel taxes are excluded so the model stays tied to oil and gas industry activity.
Segments Covered in This Report
- By Sector
- Upstream
- Midstream
- Downstream
- By Location
- Onshore
- Offshore
- By Service
- Construction
- Maintenance and Turn-around
- Decommissioning
Data Sources, Market Sizing, and Validation
Desk Research
Desk research started with public production, reserves, and trade statistics, because these series help anchor activity levels over time. We used non-paywalled sources such as publications from Mexico's energy regulator, releases from the national hydrocarbons regulator, official statistics from Mexico's national statistics agency, and customs or trade data published by government portals. We also reviewed international reference series, including intergovernmental energy balance publications and publicly tracked price benchmarks.
To connect volumes to value, we relied on public price indicators and contract disclosures where available, then cross-checked with company annual reports, investor presentations, and audited filings from operators and major service providers active in Mexico. A paid subscription for company financials and intelligence was used selectively to standardize revenue splits and reduce gaps when public disclosures were uneven. The desk sources listed here are illustrative only, and many additional public documents and datasets were reviewed to support data collection, validation, and clarification.
Primary Interviews and Surveys
Primary work focused on interviews and short surveys with upstream and midstream operators, service contractors, and downstream stakeholders, so the model assumptions match how projects are being bid, executed, and delayed on the ground. The discussions were used to confirm project timing, typical service intensity by field type (onshore versus offshore), and how pricing and cost pass-through behave across Mexico.
Distribution of primary research fieldwork respondents
| Company type | Respondent position |
|---|---|
| Top tier: 31% | CXOs: 14% |
| Mid tier: 55% | Functional/Unit leaders: 34% |
| Smaller Players: 14% | Managers: 52% |
Market-Sizing & Forecasting
Sizing was built using a top-down and bottom-up combination. First, Mexico hydrocarbon production, refinery throughput, and pipeline and terminal activity were reconstructed into a value pool using observed price signals and service intensity factors. Then, selected bottom-up approximations were used as reasonableness checks, including sampled operator and contractor revenue exposure to Mexico and simple volume times average realized price spot checks for key streams.
Key model inputs included crude oil and natural gas production by type, the offshore versus onshore activity mix, refinery utilization and turnaround cycles, pipeline and storage capacity additions, and reference price movements that affect realized pricing. For forecasting, we ran scenario analysis around upstream activity levels and midstream and downstream utilization, then chose the preferred path based on input from primary respondents on project timing, the regulatory pace, and expected price ranges. Where bottom-up checks had missing coverage, gaps were handled by applying validated intensity ratios from comparable projects inside Mexico, and then re-testing totals against major activity signals.
Data Validation & Update Cycle
Validation was done through multiple passes where model outputs were compared against independent signals, including national production series, refinery throughput trends, and large project start and stop timelines reported publicly. Outliers were reviewed one by one, and when the variance could not be explained by timing or pricing, we re-contacted selected primary sources to confirm assumptions.
Before sign-off, the work was reviewed across analysts to check arithmetic, unit consistency, and year-over-year movements so the numbers remain internally consistent. Reports are refreshed annually, and interim updates are made when material events occur, including policy changes, major project awards, or sharp price shifts. Right before delivery, an analyst runs a final update pass so clients receive the latest view available.
Mordor Intelligence's Mexico Oil and Gas Market Size Versus Other Published Estimates
Published market sizes for Mexico oil and gas can look far apart, even when the topic name sounds the same, because the underlying scope and value build-up can be very different. Differences usually come from what revenue streams are counted, how pricing is translated into USD for a given year, and how much primary validation is done on activity and project timing.
Petrochemicals manufacturing revenue sits outside Mordor Intelligence's scope here, and that item alone can push some published totals much higher when fuels are mixed with chemicals and broader energy spending. Other gaps also come from using aggressive price paths, applying global average service-to-production ratios without Mexico checks, or blending taxes and retail margins into the value pool, which inflates the total beyond sector activity.
Benchmark comparison
| Source | Market Size | Gaps in Research Methodology |
|---|---|---|
| Mordor Intelligence | USD 8.51 B (2026) | |
| Global Consultancy A | USD 193.06 B (2023) | Uses a full value chain framing that can roll in downstream retail economics, taxes, and sometimes petrochemicals-linked value, which increases the headline total versus a sector activity view. |
| Research Publisher B | USD 191.12 B (2024) | Often mixes end-use and application spending with upstream and midstream activity, and the USD conversion and base-year pricing assumptions are not always tied back to Mexico activity signals. |
The table indicates that the gap mostly comes from how wide the value pool is, rather than a difference in Mexico's underlying oil and gas activity. By keeping the value tied to observable signals like production, throughput, and utilization, and then checking assumptions through primary discussions, the output stays traceable and repeatable across refresh cycles.
Key Questions Answered in the Report
What is the current size of the Mexico Oil & Gas market?
The Mexico Oil & Gas market size is USD 8.51 billion in 2026 and is forecast to reach USD 9.19 billion by 2031.
Which segment grows fastest in the Mexico Oil & Gas market?
Downstream activities expand at the quickest 2.26% CAGR through 2031 due to new refining capacity and fuel self-sufficiency policies.
How significant are deepwater developments to future output?
Projects such as Trion and Zama could collectively add more than 280,000 barrels per day after 2028, helping reverse national production declines.
Why is natural gas demand rising so quickly in Mexico?
The Federal Electricity Commission is adding 10.1 GW of combined-cycle plants, making gas the preferred bridge fuel while renewables scale up.
What is the outlook for LNG exports from Mexico?
With Altamira operating and Energia Costa Azul set for 2025 service, LNG capacity exceeds 4 Mtpa, positioning Mexico as a new exporter to Pacific and Atlantic markets.
How do recent policy changes affect private investment?
Centralization under SENER grants Pemex preferential access, increasing regulatory risk and delaying new bid rounds, but Mixed Development Schemes still allow minority IOC participation.