
Market Overview
| Study Period | 2020 - 2031 |
|---|---|
| Forecast Data Period | 2026 - 2031 |
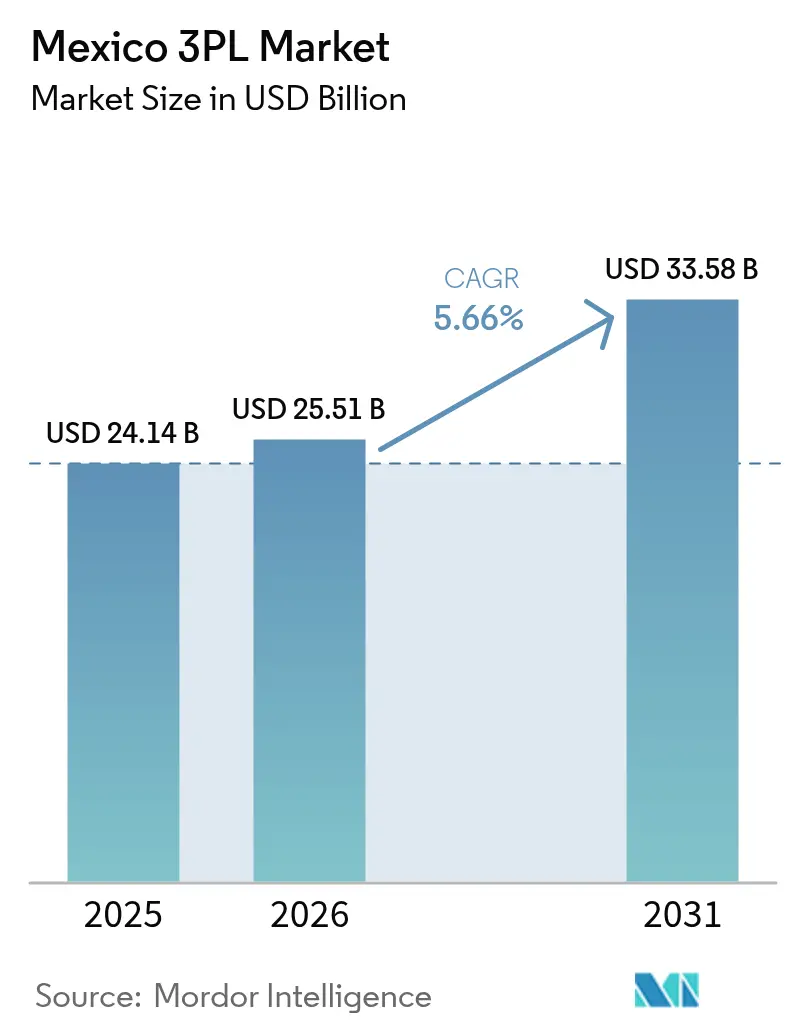
| Base Year Market Size (2025) | USD 24.14 Billion |
| Market Size (2026) | USD 25.51 Billion |
| Market Size (2031) | USD 33.58 Billion |
| Growth Rate (2026 - 2031) | 5.66 % |
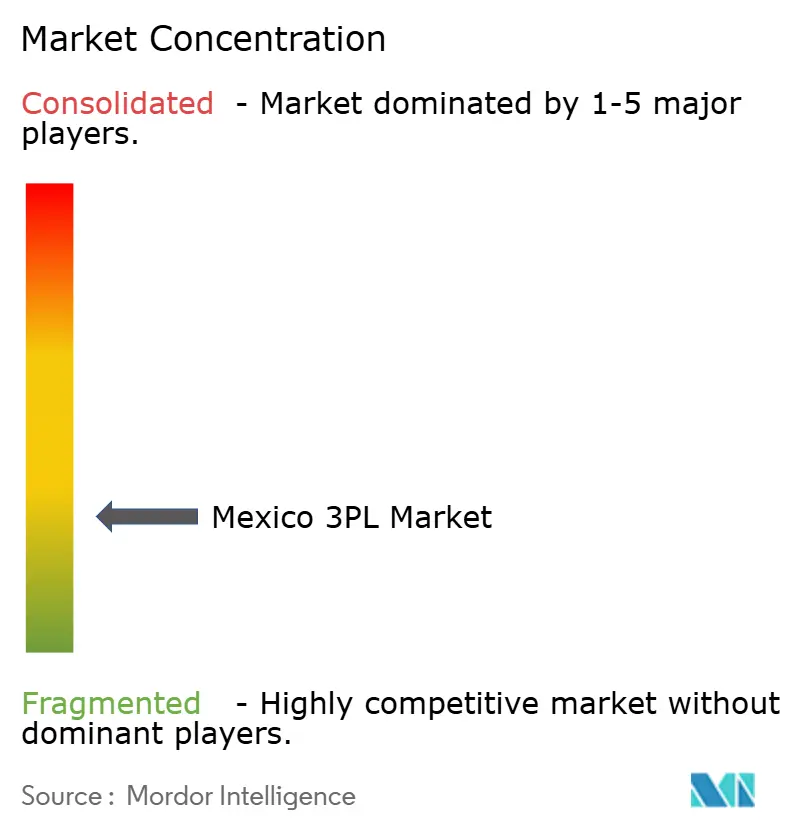
| Market Concentration | Low |
Major Players *Disclaimer: Major Players sorted in no particular order Image © Mordor Intelligence. Reuse requires attribution under CC BY 4.0. | |
Mexico 3PL Market Analysis by Mordor Intelligence
The Mexico 3PL market size in 2026 is estimated at USD 25.51 billion, growing from 2025 value of USD 24.14 billion with 2031 projections showing USD 33.58 billion, growing at 5.66% CAGR over 2026-2031.
The steady climb of the market is anchored in Mexico’s role as North America’s preferred near-shoring destination, rising bilateral trade with the United States, and the accelerated digitalization of freight networks. E-commerce parcel expansion, infrastructure upgrades such as the Interoceanic Corridor, and persistent inflows of foreign direct investment into automotive and electronics plants add momentum. However, the Mexico third-party logistics market navigates persistent security risks, driver-hours limits, and currency volatility, forcing providers to adopt technology-rich, asset-light models that lower fixed costs and spread risk. The interplay of these factors keeps pricing rational, promotes consolidation, and pushes the sector toward advanced visibility platforms and value-added warehousing services.
Key Report Takeaways
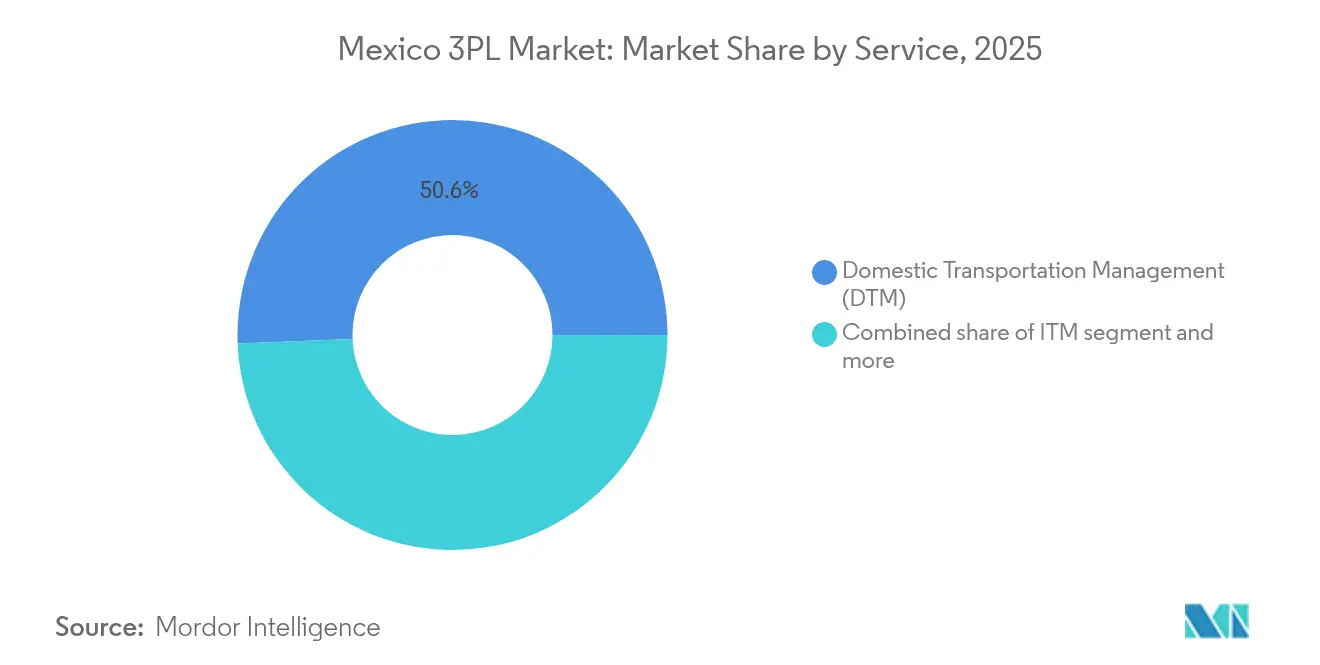
- By service, domestic transportation management led with 50.63% of Mexico's third-party logistics market share in 2025, while value-added warehousing and distribution are projected to advance at a 7.05% CAGR through 2031.
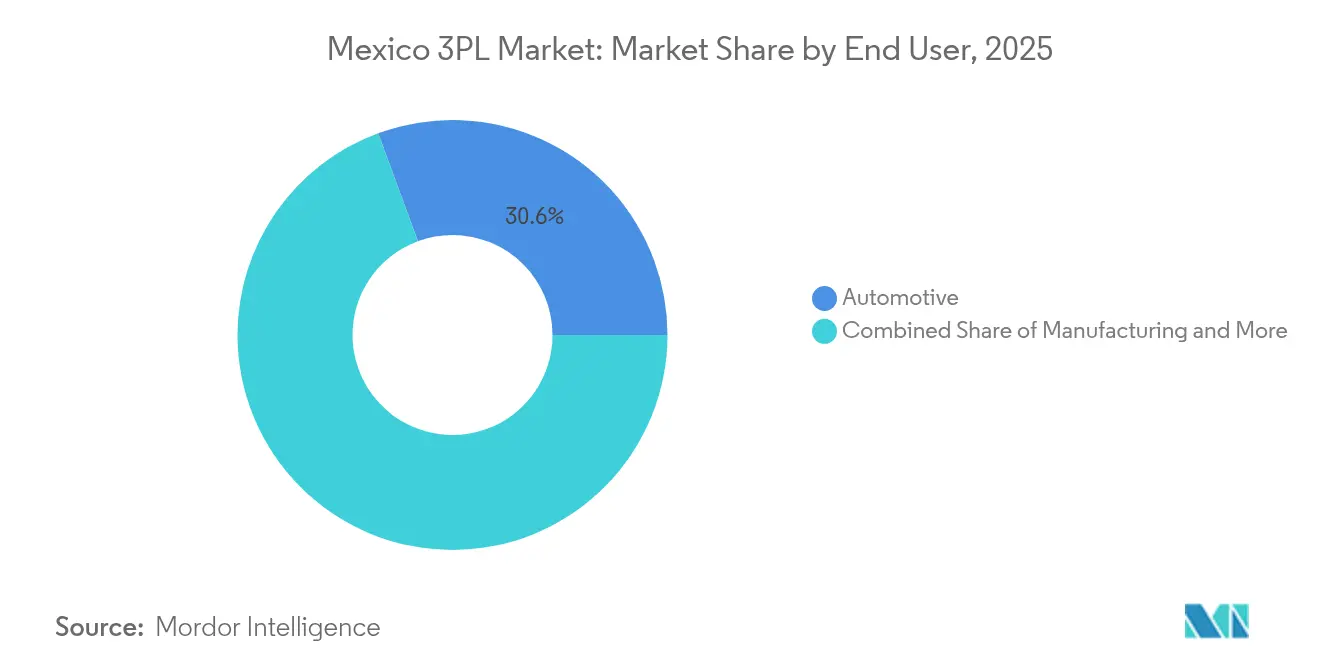
- By end user, automotive accounted for 30.62% of Mexico third-party logistics market size in 2025, and life sciences & healthcare is advancing at an 7.86% CAGR through 2031.
- By logistics model, asset-light providers captured 41.57% share of Mexico third-party logistics market size in 2025, and the same model is forecast to expand at an 6.03% CAGR to 2031.
Note: Market size and forecast figures in this report are generated using Mordor Intelligence’s proprietary estimation framework, updated with the latest available data and insights as of 2026.
Mexico 3PL Market Trends and Insights
Drivers Impact Analysis*
| Driver | (~) % Impact on CAGR Forecast | Geographic Relevance | Impact Timeline |
|---|---|---|---|
| Near-shoring led re-routing of North American supply chains | +1.8% | Northern border states and Bajío region | Medium term (2-4 years) |
| E-commerce parcel volumes pushing same-day delivery expectations | +1.2% | Mexico City, Guadalajara, Monterrey | Short term (≤ 2 years) |
| Rebound in automotive production and cross-border component flows | +1.0% | Northern manufacturing corridors and central Mexico | Medium term (2-4 years) |
| Foreign pharma investment expanding GDP-linked cold-chain demand | +0.8% | Mexico City, Guadalajara, Tijuana | Long term (≥ 4 years) |
| Government incentives for agri-export cold logistics | +0.6% | Sinaloa, Sonora, Michoacán | Medium term (2-4 years) |
| Aduanas Digital customs-clearance program | +0.4% | Border crossings and major ports | Short term (≤ 2 years) |
| Source: Mordor Intelligence | |||


Near-shoring Led Re-routing of North American Supply Chains
Foreign manufacturers continue relocating capacity from Asia to Mexico, channeling USD 46 billion of planned investments into automotive, electronics, and pharmaceutical plants. Truck crossings into the United States have climbed 62.6% since 2000, magnifying demand for cross-border brokerage and multimodal coordination. As companies seek USMCA compliance without inflating landed costs, the Mexico third-party logistics market gains importance in orchestrating synchronized just-in-time flows that integrate value-added warehousing close to production nodes. Enhanced visibility platforms and unified customs data sets unlock cost savings, encouraging further outsourcing and sustaining the driver’s medium-term boost[1]Raúl Rodríguez, “2025 Mexican Automotive Industry Outlook,” Asociación Mexicana de la Industria Automotriz (AMIA), amia.com.mx.
E-commerce Parcel Volumes Pushing Same-day Delivery Expectations
Online retail now captures a rising share of Mexican consumer spending, led by platforms such as MercadoLibre, Temu, and Shein. MercadoLibre alone is investing USD 2.5 billion to lift its fulfillment centers from 90 to over 100, compressing delivery windows to under 24 hours in major cities. Logistics providers answer with micro-fulfillment hubs, dark stores, and crowdsourced rider fleets, all backed by AI-driven route engines that cut dwell time. The Mexico third-party logistics market must integrate same-day capabilities without eroding margins, further cementing the relevance of urban vertical warehouses that lower the last-mile cost curve.
Rebound in Automotive Production and Cross-border Component Flows
Automakers plan multibillion-dollar electrification bets, including BMW’s USD 870 million battery campus and Tesla’s projected USD 5 billion gigafactory[2]Olivier Zipse, “BMW Group Invests €870 Million in San Luis Potosí Battery Plant,” BMW Group Newsroom, bmwgroup.com. Component streams already benefit from Canadian Pacific Kansas City’s USD 100 million twin-track bridge at Laredo-Nuevo Laredo, boosting rail fluidity for tier-one part suppliers. Specialized handling for batteries and power electronics drives new contract logistics bids featuring temperature-managed transport and stringent ADR compliance. This high-value freight profile lifts revenue yield, reinforcing the sector as a durable growth engine for the Mexico third-party logistics market.
Foreign Pharma Investment Expanding GDP-linked Cold-chain Demand
DHL Supply Chain’s USD 200 million outlay in life-sciences facilities underscores a wave of pharmaceutical near-shoring that demands GDP-certified warehousing, 2-8 °C transport, and end-to-end traceability. Frialsa’s 125.7 million ft³ of Latin American freezer space demonstrates domestic capacity scaling, while federal clean-energy targets spur providers to adopt solar-powered refrigeration. Long-term contracts from multinational drug makers anchor predictable volumes, cushioning the Mexico third-party logistics market against cyclical swings.
Restraints Impact Analysis*
| Restraint | (~) % Impact on CAGR Forecast | Geographic Relevance | Impact Timeline |
|---|---|---|---|
| Dilapidated road & rail infrastructure is inflating domestic haulage costs | -1.4% | Southern and rural regions | Long term (≥ 4 years) |
| Cargo-theft hotspots are raising insurance premiums and route detours | -1.0% | Estado de México, Puebla, Michoacán | Short term (≤ 2 years) |
| Driver-hours cap (NOM-087-SCT-2-2017) squeezing long-haul efficiency | -0.8% | Nationwide long-distance routes | Medium term (2-4 years) |
| Peso volatility & small-parcel documentation complexity | -0.6% | Cross-border corridors | Short term (≤ 2 years) |
| Source: Mordor Intelligence | |||
Dilapidated Road & Rail Infrastructure Inflating Domestic Haulage Cost
Roughly 85% of Mexican freight still moves by road, exposing shippers to bottlenecks on aging highways that require USD 18.9 billion to modernize by 2030. Although the MXN 157 billion (USD 8.45 billion) rail build-out and the USD 850 million Interoceanic Corridor promise relief, completion dates stretch beyond 2025. Until then, detours, vehicle wear, and congestion inflate operating costs that cascade into contract rates across the Mexico third-party logistics market. Providers respond by blending rail where available, but the restraint remains a long-term drag on margin.
Cargo-theft Hotspots Raising Insurance Premiums and Route Detours
More than 24,000 cargo robberies were logged in 2024, 83% involving violence, forcing shippers to pay higher insurance and schedule guarded convoys. Central corridors near Puebla and Estado de México are flashpoints, prompting lengthy bypasses that add fuel and labor hours. The National Guard’s “Balam” program trimmed highway robbery by 8.8%, yet risk remains elevated, particularly for food, beverage, and consumer electronics loads. The Mexico third-party logistics market invests heavily in telematics, geofencing, and driver training to counteract the short-term headwind[3]Miguel Silva, “National Guard ‘Balam’ Strategy Quarterly Report 2024,” Secretaría de Seguridad y Protección Ciudadana, gob.mx.
*Our forecasts treat driver/restraint impacts as directional, not additive. The impact forecasts reflect baseline growth, mix effects, and variable interactions.
Segment Analysis
By Service: Transportation Dominance Amid Warehousing Acceleration
Domestic transportation management generated 50.63% of Mexico third-party logistics market size in 2025 as manufacturers relied on trucks to connect Bajío plants with border crossings. The corridor-heavy structure demands end-to-end orchestration, dynamic pricing, and compliance with driver-rest mandates. International transportation management, riding on USD 839.9 billion in bilateral trade, leverages integrated customs brokerage, bonded drayage, and rail interchanges to streamline USMCA cargo flows. Together, these services lock in predictable revenue streams that providers often hedge with multi-year contracts.
Value-added warehousing and distribution is scaling fastest at a 7.05% CAGR. Robotics-enabled centers, like Walmart’s AI-equipped hubs in Bajío, illustrate a pivot from basic storage to omnichannel fulfillment, returns processing, and kitting. Autonomous mobile robots deployed by GEODIS cut picking times, raising throughput without expanding footprint. As space near Mexico City tightens, vertical warehouses emerge, reinforcing the Mexico third-party logistics market as an innovation sandbox. Rail-linked facilities in San Luis Potosí and Monterrey integrate cross-dock zones that speed parts delivery to assembly plants, widening service stickiness.


By End User: Automotive Leadership Challenged by Healthcare Surge
Automotive contracts supplied 30.62% of Mexico third-party logistics market share in 2025, supported by 3.8 million vehicle exports and tier-one suppliers’ just-in-sequence schedules. Fleet expansions, such as TLE Automotive’s doubling of carrier units, underscore robust lane volumes into U.S. dealerships. Manufacturing, technology, and electronics combine near-shoring economics with duty-saving tariff structures, illustrated by Foxconn’s AI server expansion in Chihuahua.
Life sciences and healthcare, at an 7.86% CAGR, will erode automotive’s dominance by mid-decade. DHL’s USD 1.1 billion continent-wide upgrade introduces GDP-certified nodes, reversible temperature lanes, and real-time biologic tracking. Cold-storage specialists integrate solar arrays to meet environmental mandates while maintaining ±2 °C tolerances, boosting the value proposition of the Mexico third-party logistics industry. Consumer goods, FMCG, and food trade maintain stable trajectories but wrestle with theft-driven insurance surcharges that compress margins.
By Logistics Model: Asset-Light Strategy Drives Market Evolution
Asset-light operators held 41.57% of Mexico third-party logistics market size in 2025, expanding at 6.03% CAGR by leveraging partner fleets and orchestration software rather than owned trucks. Platforms like C.H. Robinson’s Navisphere offer API-fed visibility, exception management, and automated paperwork that cut overhead. In a high-theft landscape, dispersing equipment risk across subcontracted carriers lowers exposure and premiums.
Asset-heavy providers remain critical for sectors needing dedicated rigs, secured yards, and specialized equipment such as car carriers and GDP-certified trailers. Hybrid models fuse selective ownership with brokerage networks to optimize capacity swings while meeting stringent service-level agreements. NOM-087-SCT-2-2017 driver-hour limits tighten fleet utilization, pushing even asset-heavy players toward collaborative pooling via digital freight platforms. The Mexico third-party logistics market thus converges on data-rich ecosystems where physical assets and software symbiotically unlock scale.
Geography Analysis
Northern border states dominate volumes thanks to proximity to Texas gateways; Laredo-Nuevo Laredo alone processed nearly 3 million inbound trucks in 2023, equating to USD 320 billion in trade. Plants in Nuevo León, Coahuila, and Chihuahua funnel parts northward, and value-added warehouses in Monterrey supply just-in-time kits to Detroit in under 48 hours. Central Mexico, anchored by the Mexico City-Querétaro axis, acts as the nation’s consolidation hub, blending domestic distribution with export staging; the region’s multimodal linkages enable sub-24-hour truck relays between ports and maquiladoras, reinforcing the Mexico third-party logistics market.
Southern corridors receive fresh attention through the USD 850 million Interoceanic Corridor that links Salina Cruz to Coatzacoalcos, targeting 1.4 million TEUs annually by 2033. Ten planned industrial parks and dredging upgrades could shift Asia-U.S. East Coast containers off the Panama Canal, creating a new load center for third-party providers. Yet poor road quality and sparse secure parking still deter time-sensitive cargo, keeping growth modest until rail and port works finish in 2025.
Pacific coast hubs such as Manzanillo and Lázaro Cárdenas expand crane capacity to 10 million TEUs, strengthening links with Asian suppliers. Gulf terminals in Veracruz and Altamira support energy projects and agro-export cold chains, while rising industrial clusters in Guanajuato and Aguascalientes leverage Bajío tollways for balanced access to both oceans. The Mexico third-party logistics market, therefore, mirrors the country’s polycentric economic map, with each zone specializing in lanes that match its industrial DNA and infrastructure readiness.
Regulatory Landscape
Mexico 3PL operations are increasingly shaped by digitized transport and customs compliance. SATs Complemento Carta Porte (version 3.1) is mandatory across road, rail, air, and maritime moves, and it adds more granular data fields that improve auditability and shipment traceability. This is pushing 3PLs to embed compliant e-documentation into TMS workflows and carrier onboarding.
At the border and port interface, reforms to the Customs Law published on November 19, 2025 took effect from January 1, 2026, alongside the 2026 General Foreign Trade Rules (RGCE). These changes tighten fiscal controls and increase the role of integrated brokerage and data-management services. On the operating side, NOM-087-SCT-2-2017 continues to constrain long-haul productivity through driver-hours and rest requirements, while SICTs ongoing 2026 push toward digital recording of driving and rest time (digital tachograph implementation) raises the compliance bar for carriers and their 3PL coordinators. SEMARs inter-institutional coordination guidelines for the Interoceanic Corridor multimodal logistics platform, including linkage of ports such as Coatzacoalcos and Salina Cruz into the Secure Intelligent Port Platform (PIPS), further expand shared-data expectations for multimodal providers.
Value Chain Analysis
The Mexico 3PL value chain covers shipper procurement, freight brokerage and carrier management, linehaul and cross-border execution (truck and rail), customs brokerage and documentation, port and terminal handling, warehousing and value-added services (kitting, sequencing, returns), and last-mile distribution across major metros. The mix is shifting from stand-alone forwarding to integrated contracts that bundle customs, warehouse management, and omnichannel fulfillment, which aligns with near-shoring requirements for time-definite cross-border flows and higher visibility.
Key constraints and cost drivers cluster at infrastructure and labor nodes, including congestion and capacity pressure at gateways such as Manzanillo and Lazaro Cardenas and road bottlenecks on domestic corridors. The market also faces an estimated shortfall of 56,000 professional truck drivers, which can affect service reliability. At the same time, compliance is becoming more digital and centralized, and 2026 customs reform requirements such as the Electronic Value Manifest (MVE) and broader digital tools increase the operating burden for non-digitalized operators. This favors 3PLs that can standardize document flows and connect shipment data across carriers, brokers, and government platforms.
Competitive Landscape
The competitive field is moderately fragmented: global integrators such as DHL, GEODIS, Kuehne+Nagel, and DSV coexist with domestic specialists Traxión and Solistica. Scale once conferred advantage, yet differentiation now hinges on technology, vertical expertise, and security protocols. Blue Yonder’s AI engines power predictive ETAs for automotive and pharma accounts, while Solistica’s real-time cargo-monitoring command centers reduce theft exposures along central highways.
Cross-border expertise remains a battleground. C.H. Robinson, Nuvocargo, and Trimble exploit the Complemento Carta Porte mandate to bundle compliance services with transportation bids. Meanwhile, asset-heavy fleets hedge risk by carving out separate asset-light subsidiaries to tap brokerage margins without swelling depreciation. Ongoing consolidation—typified by Nuvocargo’s 2025 acquisition of Merge Transportation—signals a gradual roll-up of midsize brokers aiming for network density and TMS scale.
Security spending skews market share toward cash-rich players able to finance telematics, escort services, and cargo insurance buffers. Providers that can demonstrate less than 1% claims ratios command premium rates among life-sciences and high-tech shippers. Over 2025–2030, the Mexico third-party logistics market is poised for deeper strategic alliances as digital platforms match vetted carriers with demand, compressing spot margins but lifting overall service quality.
Mexico 3PL Industry Leaders
DHL Supply Chain
Solistica
Traxión
CEVA Logistics
Kuehne + Nagel
- *Disclaimer: Major Players sorted in no particular order

Market Opportunities and Future Outlook
A clear opportunity is emerging in compliance-led digitization and control-tower services as Mexico tightens customs and transport data requirements in 2026. The November 19, 2025 Customs Law reforms (effective January 1, 2026), along with SATs Carta Porte requirements and the move toward digital artifacts such as the Electronic Value Manifest (MVE), create room for 3PLs to bundle brokerage, automated documentation, and API-based visibility into one managed service across cross-border and domestic networks.
Capacity and specialization investments are also opening new contracting lanes for 3PLs across ports, industrial corridors, and cold chain. The Ministry of Economy has cited a 25% to 30% logistics deficit, and companies are adding warehousing and depot capacity tied to near-shoring corridors and port congestion relief, including Maersks USD 15 million depot inauguration in Manzanillo and APM Terminals committing over USD 350 million to accelerate the next phase of its Lazaro Cardenas terminal expansion. In temperature-controlled logistics, new cold-chain investments such as Frialsas new Querataro megacenter (MXN 400 million) reinforce demand for GDP-aligned warehousing, automation, and traceability services, supporting higher-yield contract logistics beyond standard transport management.
Recent Industry Developments
- July 2026: Sese launched a new logistics operation in Monterrey for International, covering sequencing, kitting, and warehousing across a 90,000 square meter area. The site strengthens contract logistics capacity in a key near-shoring corridor and expands the addressable scope for value-added warehousing services beyond basic transport.
- May 2026: Walmart de Mexico y Centroamerica inaugurated an expanded GTP 2.0 goods-to-person robotic system at its Megapark eCommerce distribution center in Tepotzotlan, Estado de Mexico. The automation upgrade raises throughput and order-handling efficiency, pushing 3PL partners and competing warehouse operators to match higher service levels for omnichannel fulfillment.
- December 2024: Canadian Pacific Kansas City completed a USD 100 million double-track expansion at the Laredo-Nuevo Laredo rail bridge. By increasing cross-border rail fluidity, the project supports more reliable multimodal routing for automotive and manufacturing shippers and improves the economics of rail-linked 3PL solutions on the busiest North America trade lanes.


Research Methodology Framework and Report Scope
Market Definition and Coverage
For this study, the Mexico 3PL market is counted as revenues earned by third party providers for managing and executing logistics activities for shippers inside Mexico, including transportation management and warehousing and distribution services.
Scope exclusions: In-house logistics run fully by shippers and pure parcel courier revenues that are not sold as 3PL solutions are excluded from this sizing.
Segmentation Overview
- By Service
- Domestic Transportation Management (DTM)
- Roadways
- Railways
- Airways
- Waterways
- International Transportation Management (ITM)
- Roadways
- Railways
- Airways
- Waterways
- Value-Added Warehousing & Distribution (VAWD)
- Domestic Transportation Management (DTM)
- By End User
- Automotive
- Energy & Utilities
- Manufacturing
- Life Sciences & Healthcare
- Technology & Electronics
- E-commerce
- Consumer Goods & FMCG
- Food & Beverages
- Others
- By Logistics Model
- Asset-Light (Management-Based)
- Asset-Heavy (Own Fleet & Warehouses)
- Hybrid
Data Sources, Market Sizing, and Validation
Desk Research
Desk research was used to set the demand context and operating reality for 3PL in Mexico before the model was finalized. We reviewed public statistics and releases from sources such as INEGI for industrial activity and sector output signals, Banco de Mexico for inflation, rates, and FX context, and SAT customs releases for import and export activity by major corridors.
To understand how logistics demand changes by corridor and sector, we also checked sources such as the Secretariat of Economy for trade and industry updates, SCT and related transport authorities for road and freight infrastructure direction, and port and airport authority updates for throughput and capacity signals. Company filings, investor presentations, association websites, and reputable press were used to cross-check service mix changes, footprint expansions, and outsourcing announcements discussed publicly. Patent databases were used selectively to track logistics automation themes that influence warehouse operations. The source list is illustrative and other public references were also used for data collection, validation, and clarification.
Primary Interviews and Surveys
Primary work focused on validating what portion of shipper logistics spending is realistically outsourced to 3PLs, and how that split changes across transportation management versus warehousing and distribution. We spoke with providers, shipper-side logistics leaders, and industry advisors across key Mexican manufacturing and consumption corridors to confirm assumptions on contract structures, utilization, and nearshoring driven volume shifts.
Distribution of primary research fieldwork respondents
| Company type | Respondent position |
|---|---|
| Top tier: 31% | CXOs: 17% |
| Mid tier: 47% | Functional/Unit leaders: 34% |
| Smaller Players: 22% | Managers: 49% |
Market-Sizing & Forecasting
Sizing started from a top-down build where Mexico freight movement and trade-linked activity was converted into an addressable outsourced logistics pool using outsourcing rates and service mix splits that were checked in interviews. Once that demand pool was set, it was translated into market value through service-level pricing logic, with transportation management and warehousing and distribution handled separately because their revenue drivers differ.
To keep the model practical, we used a short set of inputs that can be tracked consistently, such as manufacturing output trends, cross-border trade volumes, warehouse space additions and absorption, fuel and labor cost direction that influences rate resets, and shifts in inventory positioning tied to nearshoring and e-commerce fulfillment. Results were corroborated with selective bottom-up approximations, including sampled price per shipment or per pallet movements, capacity and utilization signals from large logistics facilities, and channel checks on contract logistics penetration, which helped us adjust totals where public data was thin.
For forecasting, scenario analysis was applied around nearshoring and trade corridor growth, and then the central case was shaped using expert views on how quickly outsourcing adoption and pricing normalization will progress. When provider-level revenue disclosure was limited, gaps were handled using corridor and facility proxies (such as cross-dock activity and warehouse footprint) and then totals were rebalanced back to the demand pool.
Data Validation & Update Cycle
Outputs were reviewed through several checks so that one noisy data series does not dictate the final number. We compared the implied 3PL revenue intensity against independent signals like trade growth, manufacturing momentum, and facility utilization patterns, and then followed up on any variances that appeared too sharp for the operating environment.
Before sign-off, assumptions and formulas go through a second analyst review, and respondents are re-contacted when a shift in rates, capacity, or regulation could change the story materially. Reports refresh annually, with interim updates for material events, followed by a final pre-delivery pass so clients receive the latest updated view.
Mordor Intelligence's Mexico 3pl Market Size Compared Against Other Published Estimates
It is normal to see different market sizes published for Mexico 3PL because studies do not always count the same services, or they use different base years and currency timing. In logistics, a small change in what is treated as 3PL revenue versus general freight activity can move the total by several billion dollars.
Key gaps usually come from scope boundaries and the way outsourcing is measured. By tracking cross-border trade momentum and warehouse absorption, refreshing service-level pricing, and then applying Mordor Intelligence interview-backed outsourcing and service-mix splits, the estimate stays tied to provider revenues linked to transportation management and warehousing and distribution in Mexico. Some external estimates start from older demand conditions, blend courier-like activity into the same bucket, or apply broad growth rates without rechecking corridor utilization and contract reset patterns.
Benchmark comparison
| Source | Market Size | Gaps in Research Methodology |
|---|---|---|
| Mordor Intelligence | USD 24.14 B (2025) | |
| Trade Publisher A | USD 18.70 B (2024) | Uses an earlier base year and can undercount later nearshoring driven expansion in warehousing and cross-border flows, and service lines may be combined without a clear outsourcing rate reset for Mexico. |
| Global Consultancy B | USD 20.44 B (2025) | Often applies broad service growth assumptions and uses a different split between transportation management and warehousing, which changes the implied pricing and utilization mix used to build total revenues. |
Across the three values, most of the spread is explained by timing, scope choices, and how outsourcing penetration and pricing are updated year to year. The method used here keeps the math traceable to clear demand signals and repeatable steps, and then validates it with practical checks before sign-off.


Key Questions Answered in the Report
What is the forecast value of the Mexico third-party logistics market by 2031?
It is projected to reach USD 33.58 billion, reflecting a 5.66% CAGR.
Which service segment is growing fastest in Mexico’s 3PL space?
Value-added warehousing and distribution is advancing at a 7.05% CAGR due to robotics-enabled fulfillment demand.
How large is the automotive share in Mexico’s 3PL sector?
Automotive held 30.62% of Mexico third-party logistics market share in 2025, sustained by 3.8 million vehicle exports.
Why are asset-light models gaining traction?
They reduce capital exposure and distribute security risk while leveraging technology platforms for visibility and compliance.
What is the key geographic corridor for cross-border trade?
The Laredo-Nuevo Laredo crossing processes nearly 3 million trucks and USD 320 billion in annual bilateral trade.
How does cargo theft affect logistics costs?
Elevated theft rates increase insurance premiums and force route detours, trimming sector CAGR by an estimated 1.0%.
Page last updated on:


 Your data is secure and never sold or shared.


