Methanol Market Size and Share
Market Overview
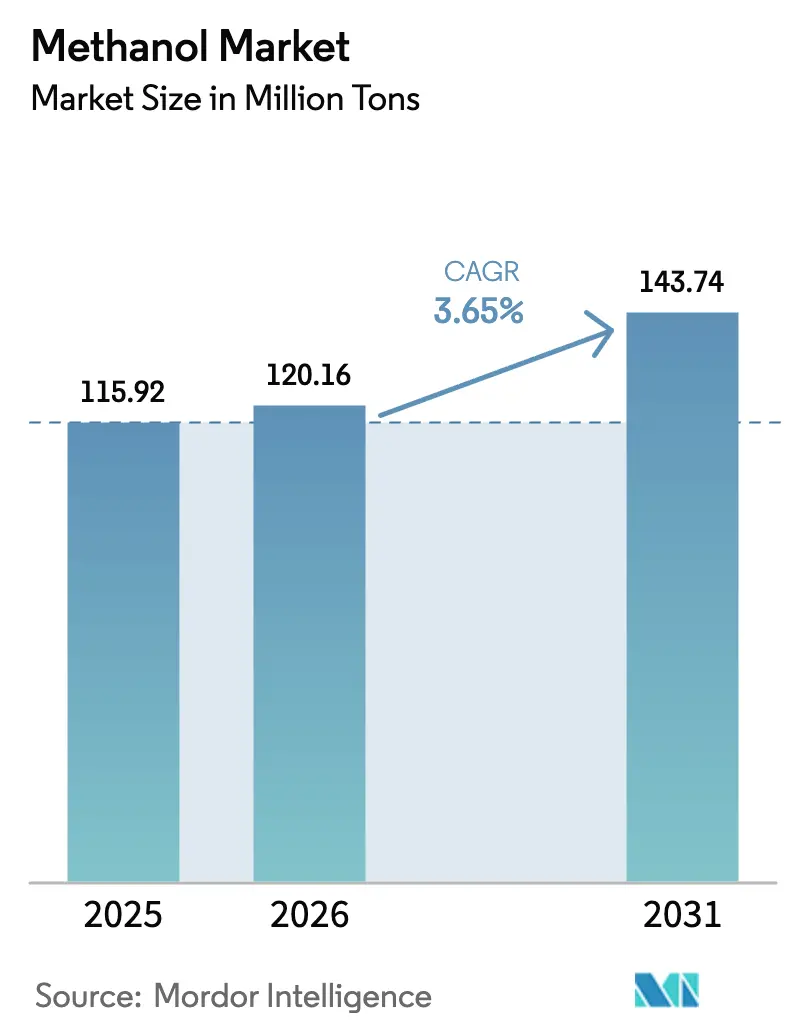
| Study Period | 2021 - 2031 |
|---|---|
| Market Volume (2026) | 120.16 Million tons |
| Market Volume (2031) | 143.74 Million tons |
| Growth Rate (2026 - 2031) | 3.65% CAGR |
| Fastest Growing Market | Asia Pacific |
| Largest Market | Asia Pacific |
| Market Concentration | Medium |
Major Players *Disclaimer: Major Players sorted in no particular order Image © Mordor Intelligence. Reuse requires attribution under CC BY 4.0. | |
Methanol Market Analysis by Mordor Intelligence
The Methanol Market size is expected to increase from 115.92 million tons in 2025 to 120.16 million tons in 2026 and reach 143.74 million tons by 2031, growing at a CAGR of 3.65% over 2026-2031. Growth is anchored by Asia-Pacific demand but is increasingly defined by energy-related uses such as marine fuel and methanol-to-olefins, both of which command premium pricing in low-carbon supply chains. Feedstock dynamics are shifting as renewable pathways gain policy support, while natural-gas-based producers defend cost positions through scale and long-term contracts. Intensifying competition between integrated petrochemical incumbents and technology-focused entrants is spurring strategic joint ventures, offtake agreements, and capacity retrofits aimed at carbon-intensity reduction. Near-term volatility in gas and coal prices remains the key margin headwind, although flexible feedstock strategies and carbon-credit monetization are cushioning the impact for well-hedged operators.
Key Report Takeaways
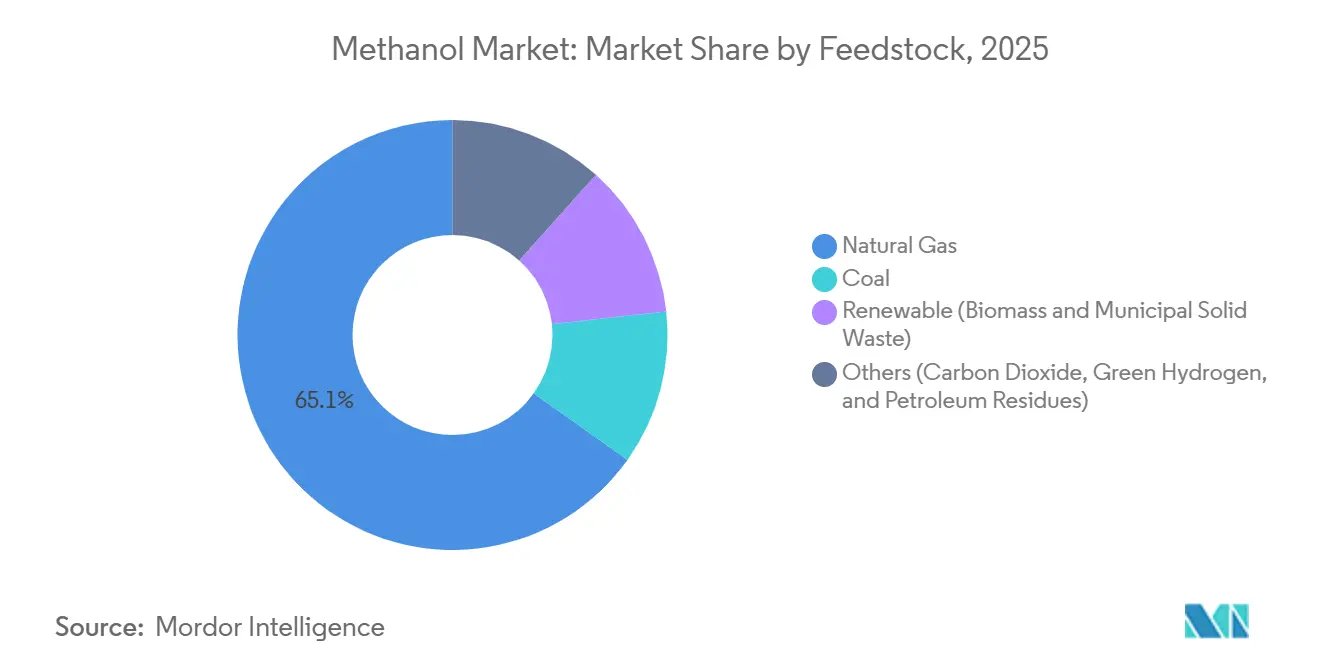
- By feedstock, natural gas held 65.12% of methanol market share in 2025; renewable feedstocks are projected to post the fastest growth at an estimated 5.07% CAGR through 2031.
- By derivative/application, energy uses captured 54.34% share of the methanol market size in 2025, and is projected to expand at 4.18% CAGR to 2031 on the back of aggressive dual-fuel vessel orders.
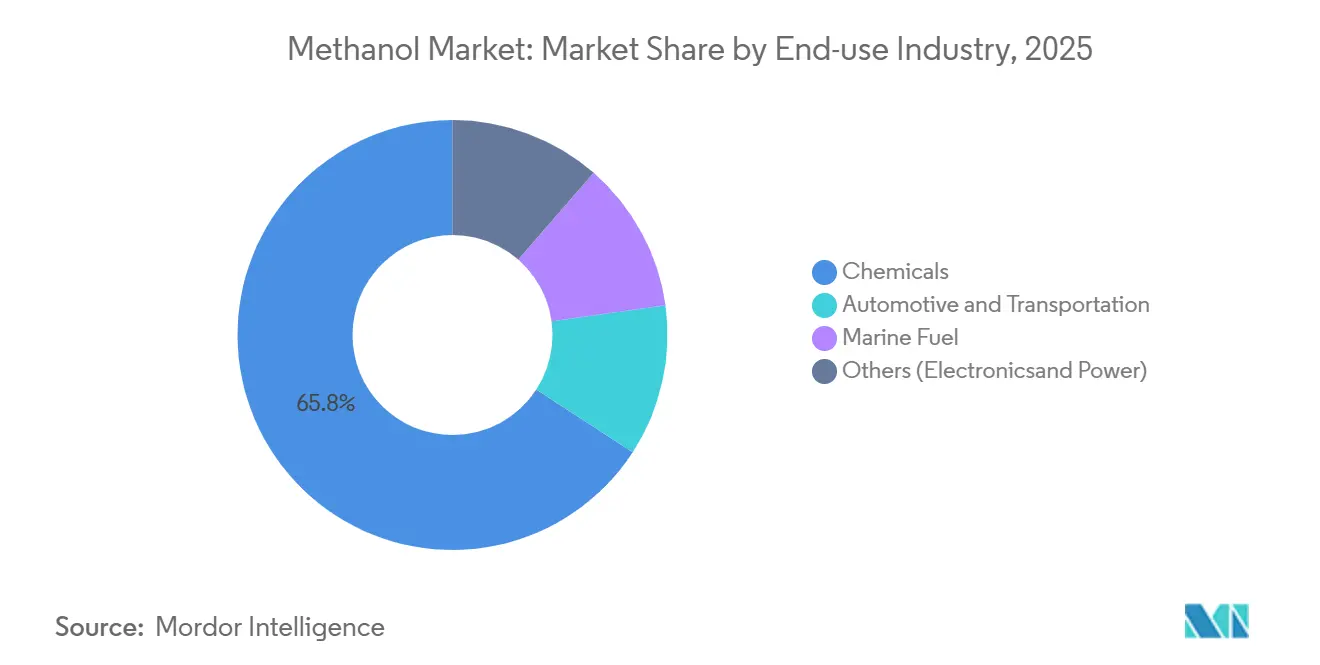
- By end-use industry, the chemical sector dominated with 65.81% of the methanol market share in 2025; the automotive and transportation sector is forecast to record the highest 4.21% CAGR through 2031 as shipping lines decarbonize.
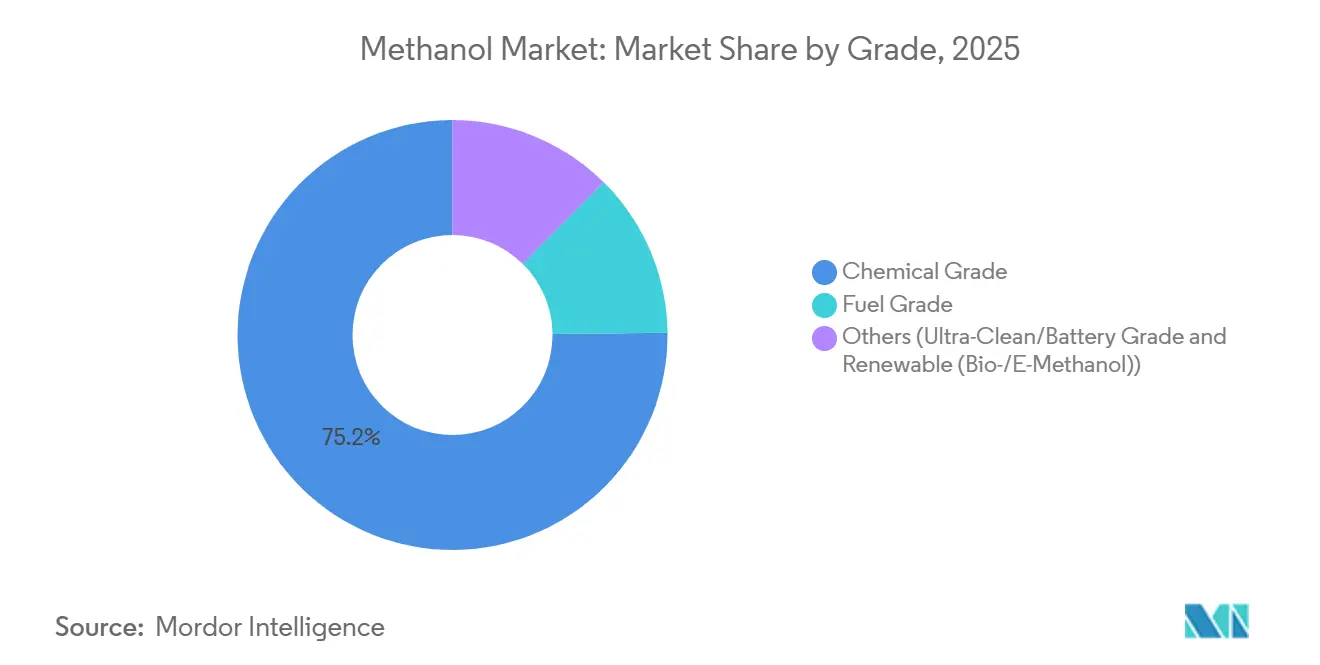
- By grade, chemical-grade methanol commanded 75.16% share of the methanol market size in 2025; fuel-grade methanol is projected to grow at 4.04% CAGR through 2031, supported by IMO emission targets.
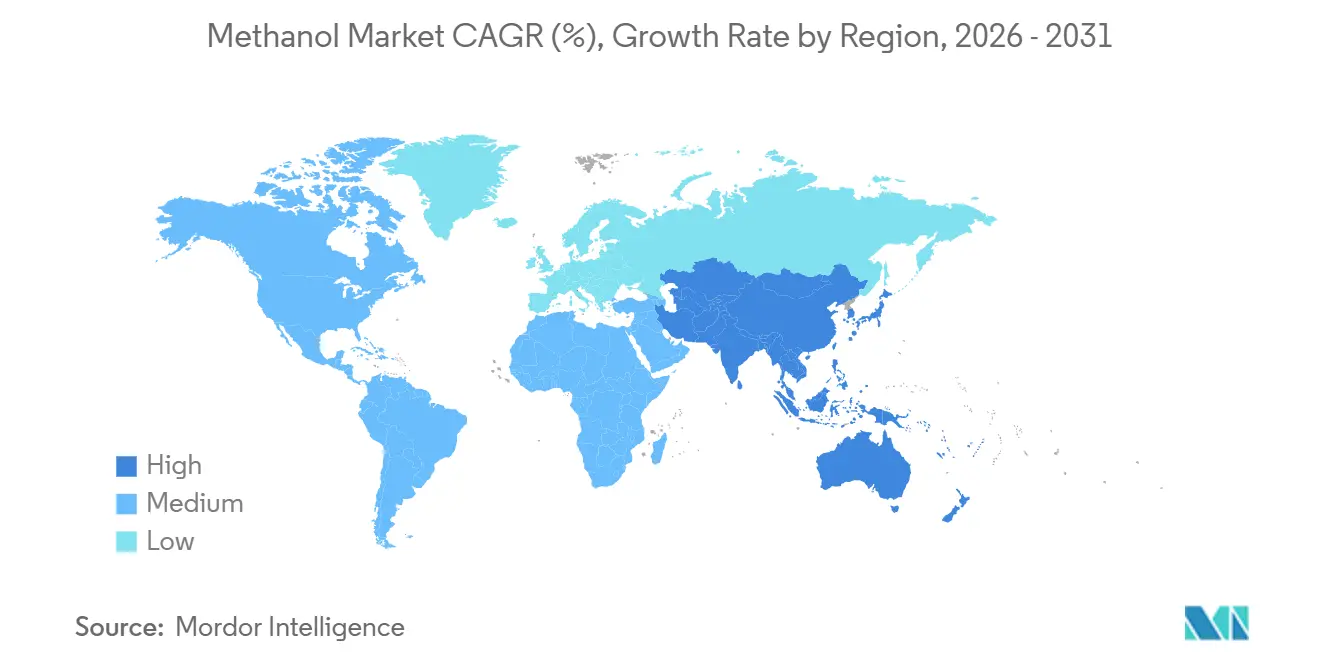
- By geography, Asia-Pacific led with 78.10% share of the methanol market size in 2025, and is forecast to deliver the fastest 3.91% CAGR to 2031, leveraging low-cost shale gas and export-oriented capacity additions.
Note: Market size and forecast figures in this report are generated using Mordor Intelligence’s proprietary estimation framework, updated with the latest available data and insights as of January 2026.
Global Methanol Market Trends and Insights
Drivers Impact Analysis*
| Driver | (~) % Impact on CAGR Forecast | Geographic Relevance | Impact Timeline |
|---|---|---|---|
| Expanding petrochemical capacity in China, US, and emerging Asia | +0.9% | Asia-Pacific core, North America spill-over | Medium term (2-4 years) |
| Marine sector shift to low-carbon fuels, green methanol adoption | +1.2% | Global, early gains in Europe and Asia-Pacific | Long term (≥ 4 years) |
| Increasing use of methanol-to-olefins routes | +0.8% | China dominant, emerging in Middle East | Short term (≤ 2 years) |
| Waste-to-methanol projects scaling via MSW gasification | +0.4% | North America and Europe, pilot stage in Asia | Long term (≥ 4 years) |
| CO₂-utilization hubs driving e-methanol demand in Europe | +0.5% | Europe core, demonstration projects in Asia | Medium term (2-4 years) |
| Source: Mordor Intelligence | |||


Expanding Petrochemical Capacity in China, US, and Emerging Asia
China added more than 10 million tons per year of coal-to-methanol capacity between 2024 and 2025, primarily in Inner Mongolia and Shaanxi, where coal remains cost-competitive under current environmental levies[1]China National Chemical Engineering Corporation, “Capacity Expansion Update,” cncec.com.cn. US Gulf Coast producers leveraged Henry Hub gas near USD 4.00 per million Btu in 2026 to supply Latin American importers at a delivered-cost advantage. Import demand in Vietnam, Thailand, and Indonesia rose as formaldehyde and acetic-acid capacity outpaced indigenous supply, compressing Asia-to-Europe spot differentials and forcing traders to optimize fleet allocation. Capacity additions raise an over-supply risk should real-estate activity soften faster than methanol-to-olefins absorption, underscoring the importance of flexible offtake structures and downstream integration.
Marine Sector Shift to Low-Carbon Fuels – Green Methanol Adoption
The International Maritime Organization mandates a 20% emissions-intensity cut by 2030 and net-zero by 2050, with carbon penalties beginning at USD 100 per ton CO₂-equivalent in 2028 and escalating thereafter[2]International Maritime Organization, “Revised GHG Strategy,” imo.org. Maersk contracted 500,000 tons per year of green methanol and is deploying 25 dual-fuel vessels by 2027, front-running infrastructure constraints at global bunkering hubs. Similar commitments from CMA CGM and MSC suggest shipping could absorb 13 million tons annually by 2030, equal to roughly 9% of the 2026 global supply. Green-methanol premiums of USD 200–400 per ton in 2025 mirror renewable-energy input costs and carbon-credit value capture. Limited refueling capacity at only 15 ports worldwide creates a bottleneck, yet high carbon-levy visibility is accelerating terminal-upgrade announcements in Rotterdam and Singapore.
Increasing Use of Methanol-to-Olefins Routes
Twenty commercial MTO units in China now exceed 15 million tons per year of ethylene and propylene equivalents, with DMTO-III technology achieving 85.9% selectivity at a 2.66 ton methanol-to-olefin ratio. Baofeng Energy’s 3.0 million ton complex integrates upstream coal gasification and downstream polyolefins, capturing integrated margins when Brent exceeds USD 75 per barrel. Shenhua Yulin’s 1.8 million ton project, due online in late 2026, will intensify competition for coal feedstock. MTO economics tighten methanol supply for traditional chemical derivatives during crude-oil rallies, thereby influencing intra-regional price spreads and arbitrage flows.
Waste-to-Methanol Projects Scaling via MSW Gasification
Enerkem’s Varennes plant converts 125,000 tons per year of municipal solid waste into renewable methanol, earning CAD 80 per ton gate fees and a USD 300 per ton product premium under the California Low Carbon Fuel Standard. Repsol’s EUR 800 million Tarragona facility, scheduled for 2029, will gasify non-recyclable waste and pair syngas with green hydrogen to supply marine-fuel customers seeking scope-3 reductions. The European Union’s Renewable Energy Directive III double-counts waste-derived methanol toward transport-fuel mandates, boosting project returns. Seasonal feedstock variability and pre-treatment costs of USD 50–80 per ton remain scaling hurdles outside regions with mature waste-sorting infrastructure.
Restraints Impact Analysis*
| Restraint | (~) % Impact on CAGR Forecast | Geographic Relevance | Impact Timeline |
|---|---|---|---|
| Feedstock price volatility | -0.6% | Global, acute in North America and Europe | Short term (≤ 2 years) |
| Health and safety hazards of methanol handling | -0.3% | Global, stricter enforcement in OECD | Medium term (2-4 years) |
| Competition from bio-MPG and RNG in marine decarbonization | -0.4% | Europe and North America | Long term (≥ 4 years) |
| Source: Mordor Intelligence | |||
Feedstock Price Volatility
North American gas ranged between USD 2.00 and USD 6.00 per million Btu during 2024–2025, with each USD 1.00 swing adding roughly USD 30 per ton to methanol production cost. Chinese coal spot prices moved between CNY 800 and CNY 1,200 per ton in 2025; environmental levies on high-sulfur coal further eroded cost advantages. Producers with integrated coal mines or long-term gas supply managed higher utilizations, whereas merchant plants cut operating rates below 70% during price spikes. Dual-feedstock designs and tolling agreements are emerging as hedge mechanisms, but dilute upside when spreads widen.
Health and Safety Hazards of Methanol Handling
Methanol’s toxicity prompts OSHA exposure limits of 200 ppm TWA and 250 ppm STEL, while IEC 60079 compliance for explosion-proof equipment adds USD 0.5–2 million per site. Insurance premiums for methanol terminals run 20–30% above those for ethanol due to vapor cloud ignition risk. IMO interim guidelines require double-wall piping and automated leak detection on dual-fuel ships, raising retrofit costs by USD 1–3 million per vessel. Some ports have delayed bunkering approvals pending vapor-recovery installations, temporarily slowing fleet conversions.
*Our forecasts treat driver/restraint impacts as directional, not additive. The impact forecasts reflect baseline growth, mix effects, and variable interactions.
Segment Analysis
By Feedstock: Renewable Pathways Challenge Gas Dominance
Natural-gas feedstock controlled 65.12% of the Methanol market share in 2025, anchored by low-cost supply in the US Gulf Coast and the Middle East. Renewable feedstock is expanding at a 5.07% CAGR, outpacing the overall methanol market. Enerkem’s Varennes plant monetizes both gate fees and carbon credits, illustrating superior economics under robust policy incentives. Repsol’s Tarragona project, due in 2029, signals European momentum toward circular feedstock despite higher capital intensity. Coal remains relevant in China, yet tightening air-quality rules and environmental levies are squeezing margins. Emerging CO₂-plus-green-hydrogen routes are subscale but enjoy strong policy tailwinds, hinting at future supply diversification.
The methanol market size attributable to renewable feedstock remains small today, yet long-term visibility on carbon pricing suggests a sustained shift in capital allocation toward these pathways. Producers capable of arbitraging between gas, coal, and waste-derived feedstocks will gain flexibility in balancing compliance premiums against feedstock cost volatility. Early movers that secure waste-sorting partnerships and renewable-power contracts are likely to lock in margin advantages as regulatory thresholds ratchet upward.


By Derivative/Application: Energy Uses Outpace Traditional Chemicals
Energy-related derivatives held 54.34% of 2025 volume and are projected to grow at a 4.18% CAGR through 2031, faster than traditional chemical uses. Twenty MTO units in China and a rising fleet of methanol-fueled vessels underpin this trajectory. Dimethyl ether pilots in Indonesia and Vietnam show promise as diesel substitutes, further broadening the energy footprint. Conversely, MTBE demand is retreating in North America and Europe due to environmental restrictions, although gasoline blending in Chinese tier-2 cities is offsetting some of the decline.
Traditional chemical derivatives still anchor one-third of global demand, with formaldehyde tied to construction activity and acetic acid linked to packaging and textiles. The divergence in growth rates suggests incremental supply will tilt toward energy applications, tightening availability for chemical buyers during crude-oil up-cycles and potentially widening quality-based price differentials.
By End-Use Industry: Automotive Gains as Chemicals Mature
Chemical end use retains 65.81% of volume but exhibits more mature growth tied to construction and consumer goods. Real-estate softness in China and slower European renovation activity weigh on formaldehyde consumption. The strategic challenge for producers is allocating tonnage between long-term chemical contracts and spot marine-fuel demand that commands higher margins yet introduces volume uncertainty.
The automotive and transportation segment is advancing at a 4.21% CAGR, outstripping the overall methanol market. China’s approval of M15 gasoline in ten provinces and India’s pilot programs for methanol buses are expanding fuel-blending demand. Direct methanol fuel cells for material-handling equipment and backup power add further pull. Marine fuel remains the keystone growth driver; if all dual-fuel ships on order operate at design capacity, shipping alone could account for 13 million tons annually by 2030.
By Grade: Fuel Specifications Tighten as Marine Demand Scales
Chemical-grade methanol accounted for 75.16% of volume in 2025, catering to derivatives that require 99.85% purity. Fuel-grade, specified at ≥ 99.00% purity, is expanding at a 4.04% CAGR, propelled by IMO bunkering standards. Producers are investing in upgrading distillation towers to achieve the tighter water-and-sulfur limits demanded by marine customers. Specialty ultra-clean and battery-grade methanol, though less than 1% of total supply, captures premiums of USD 100–150 per ton due to stringent trace-metal specifications. Renewable-certified grades trade at even higher premiums and are rapidly becoming a procurement requirement for scope-3-conscious buyers.
The methanol market size for fuel-grade is expected to close the gap with chemical-grade as shipping demand scales, driving incremental investment in purification capacity. Grade bifurcation will likely deepen, with commodity chemical-grade volumes competing on cost while premium low-carbon and specialty grades leverage certification and purity to defend margins.
Geography Analysis
Asia-Pacific dominated with 78.10% share in 2025 and is forecast at a 3.91% CAGR through 2031. China’s 50 million tons per year coal-to-methanol capacity and aggressive MTO expansion underpin regional leadership. India’s push for self-sufficiency through coal-gasification and policy-backed fuel blending adds incremental demand. Southeast Asian imports continue rising to serve construction-driven formaldehyde needs. Japan and South Korea remain net importers, focusing on high-purity methanol for electronics and automotive uses.
North America maintained a mid-single-digit share, with Methanex’s Geismar complex and new renewable capacity from Enerkem anchoring supply. Low-cost shale gas and proximity to Latin American markets offer a structural advantage, though LNG export growth is tightening domestic gas balances during winter peaks. Canada’s focus on waste-to-methanol highlights policy-driven diversification, while Mexico’s demand tracks automotive and construction cycles.
Europe’s share is small but strategically important due to its pivot toward e-methanol. Innovation-Fund grants, OCI’s blue-methanol retrofit, and Repsol’s Tarragona investment demonstrate capital commitment to low-carbon supply. The Port of Rotterdam targets 2 million tons per year of bunkering capacity by 2030, positioning the region as a trading hub for green methanol. The Carbon Border Adjustment Mechanism strengthens the competitive position of low-carbon domestic producers versus high-carbon imports.
South America and the Middle East & Africa each hold mid-single-digit shares. Brazil’s methanol demand is tied to biodiesel and construction, while Argentina explores gas-to-methanol projects linked to Vaca Muerta shale. The Middle East remains a cost leader, leveraging cheap associated gas to export to Asia. African demand is import-dependent and constrained by currency volatility and logistics costs, though mining and construction provide stable baseline consumption.

Competitive Landscape
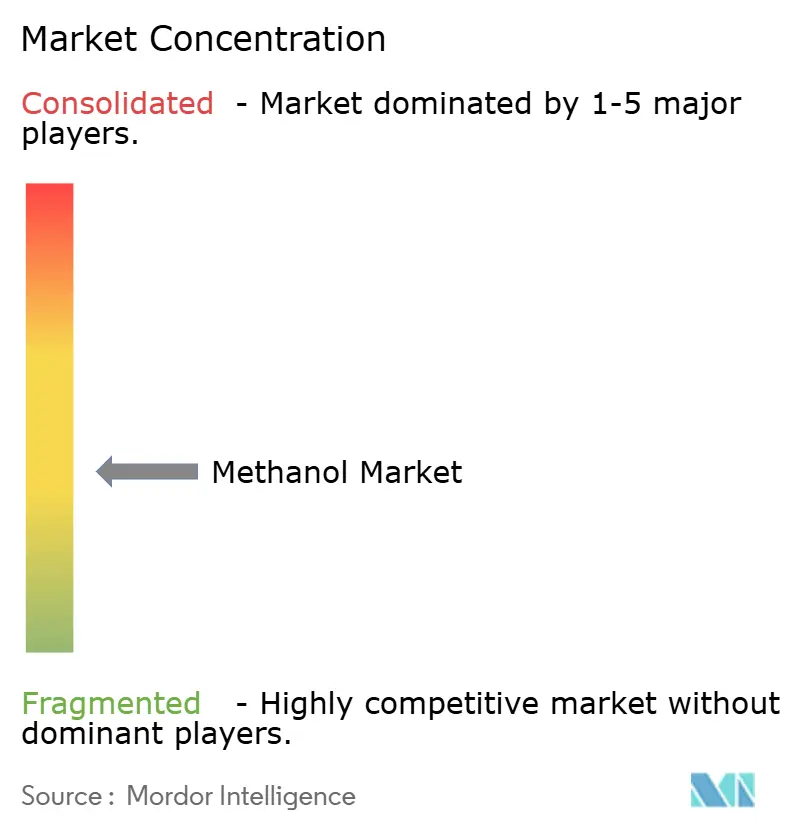
The Methanol market is moderately fragmented. Key participants include SABIC, OCI, PETRONAS, and Mitsubishi Gas Chemical, each operating 1-3 million tons per year and exploiting vertical integration or feedstock advantages. Chinese coal-based producers such as Baofeng Energy and Yankuang Energy compete on delivered-cost parity within Asia. Producers without an established low-carbon supply risk margin compression as carbon levies escalate. Engineering standards under IEC 60079 create a capex barrier but also a moat for players with proven safety systems.
Methanol Industry Leaders
Methanex Corporation
OCI
Proman
SABIC
Yankuang Energy Group Company Limited
- *Disclaimer: Major Players sorted in no particular order

Recent Industry Developments
- November 2025: Three state-owned Chinese entities commenced construction on the country’s first full-chain green methanol demonstration project, targeting the shipping sector. The initiative aims to export this sustainable fuel to international maritime markets. The project is projected to produce 197,200 tonnes of green methanol annually.
- October 2025: India took a major leap in its industrial decarbonization journey. At NTPC’s Vindhyachal Super Thermal Power Station, the nation successfully produced its first drop of methanol, harnessed from captured carbon dioxide.


Research Methodology Framework and Report Scope
Market Definitions and Key Coverage
Mordor Intelligence treats the methanol market as the annual global output of commodity-grade CH3OH that leaves a production site for merchant sale, expressed in metric tons. Our coverage spans plants using natural-gas reforming, coal gasification, and emerging waste or biomass gasification once they reach commercial scale.
(Scope exclusion) Ultra-high-purity laboratory reagent methanol and captive volumes consumed completely inside an integrated complex are left outside the sizing.
Segmentation Overview
- By Feedstock
- Natural Gas
- Coal
- Renewable (Biomass, Municipal Solid Waste)
- Others (Carbon Dioxide, Green Hydrogen, Petroleum Residues)
- By Derivative / Application
- Traditional Chemical
- Formaldehyde
- Acetic Acid
- Solvents
- Methylamines
- Other Traditional Chemicals
- Energy-related
- Methanol-to-Olefins (MTO)
- Methyl Tert-Butyl Ether (MTBE)
- Gasoline Blending
- Dimethyl Ether (DME)
- Biodiesel
- Traditional Chemical
- By End-use Industry
- Automotive & Transportation
- Chemicals
- Marine Fuel
- Others (Electronics, Power)
- By Grade
- Chemical Grade
- Fuel Grade
- Others (Ultra-Clean/Battery Grade and Renewable (Bio-/E-Methanol))
- By Geography
- Asia-Pacific
- China
- India
- Japan
- South Korea
- Vietnam
- Thailand
- Indonesia
- Malaysia
- Australia
- New Zealand
- Rest of Asia-Pacific
- North America
- United States
- Canada
- Mexico
- Europe
- Germany
- United Kingdom
- Italy
- France
- Turkey
- Russia
- Nordics
- Spain
- Rest of Europe
- South America
- Brazil
- Argentina
- Colombia
- Rest of South America
- Middle East and Africa
- Saudi Arabia
- Qatar
- United Arab Emirates
- South Africa
- Nigeria
- Egypt
- Rest of Middle East & Africa
- Asia-Pacific
Detailed Research Methodology and Data Validation
Primary Research
Analysts interviewed plant operators, marine-fuel distributors, formaldehyde resin buyers, and regional trade bodies across Asia-Pacific, North America, and the Middle East. Those calls clarified shadow-capacity utilization, contract pricing corridors, and the pace at which low-carbon methanol grades penetrate bunkering pools.
Desk Research
We began with public datasets on production, trade, and consumption from agencies such as the International Energy Agency, UN Comtrade, the International Methanol Producers & Consumers Association, and the US Energy Information Administration. We then layered price and capacity insights from industry periodicals and national chemical associations. Company filings gathered through D&B Hoovers, customs-level shipment traces from Volza, patent pools via Questel, and port traffic statistics helped us firm up plant commissioning dates, utilization drifts, and downstream pull. These sources illustrate our desk-work foundation and are not exhaustive.
Market-Sizing & Forecasting
A top-down balance-sheet links nameplate capacity, rolling utilization, and net exports to reconstruct apparent demand, which is then cross-checked with selective bottom-up snapshots such as sampled FOB prices multiplied by lifted cargoes. Key variables like MTO plant start-ups, coal-to-methanol economics, marine-fuel mandates, natural-gas spreads, and announced CCU projects feed a multivariate regression that generates the 2025-2030 outlook. Where bottom-up samples under-report informal trade, adjustment factors derived from primary interviews bridge the gap.
Data Validation & Update Cycle
Outputs pass variance checks against historical trade elasticities and peer ratios before a senior reviewer's sign-off. The model refreshes every year, and mid-cycle updates are triggered when feedstock prices or policy moves shift forecasts materially.
Why Mordor's Methanol Baseline Commands Reliability
Published figures often diverge because firms juggle units, feedstock scope, and refresh timing.
By anchoring on physically verifiable production and trade flows and blending that with on-ground sentiment, we reduce blind spots that pure desk models or single-source interviews leave behind.
Benchmark comparison
| Market Size | Anonymized source | Primary gap driver |
|---|---|---|
| 115.90 million t (2025) | Mordor Intelligence | - |
| USD 45.56 bn (2025) | Global Consultancy A | Values in dollars, narrower derivative list, no volume test |
| 79.2 million t (2024) | Industry Journal B | Omits coal-based plants outside Asia; uses earlier base year |
| USD 38.50 bn (2024) | Regional Consultancy C | Bundles downstream derivatives, forecasts on sales revenue |
The comparison shows that when currency swings, derivative bundling, or partial geographies creep in, totals shift markedly.
Mordor Intelligence keeps definitions tight and refresh cadence annual, giving decision-makers a transparent, repeatable baseline they can trace back to clear variables and documented steps.


Key Questions Answered in the Report
What is the projected global methanol demand by 2031?
Global consumption is forecast to reach 143.74 million tons in 2031, up from 120.16 million tons in 2026, reflecting a 3.65% CAGR.
How fast are energy-related methanol applications growing?
Energy uses such as methanol-to-olefins and marine fuel are expanding at a 4.18% CAGR through 2031, faster than traditional chemical derivatives.
Which region leads methanol consumption and why?
Asia-Pacific accounts for 78.10% of global volume in 2025, driven by China’s coal-to-methanol capacity, methanol-to-olefins investments, and fuel-blending programs.
What role will green methanol play in shipping decarbonization?
If all dual-fuel vessels on order operate at design capacity, shipping alone could absorb 13 million tons of green methanol annually by 2030, helping carriers meet IMO carbon-reduction targets.
How does feedstock volatility affect methanol production costs?
A USD 1.00 per million Btu swing in natural-gas prices typically moves cash cost by about USD 30 per ton, eroding margins when product pricing lags.
Page last updated on:


