
Metastatic Cancer Treatment Market Size and Share
Market Overview
| Study Period | 2020 - 2031 |
|---|---|
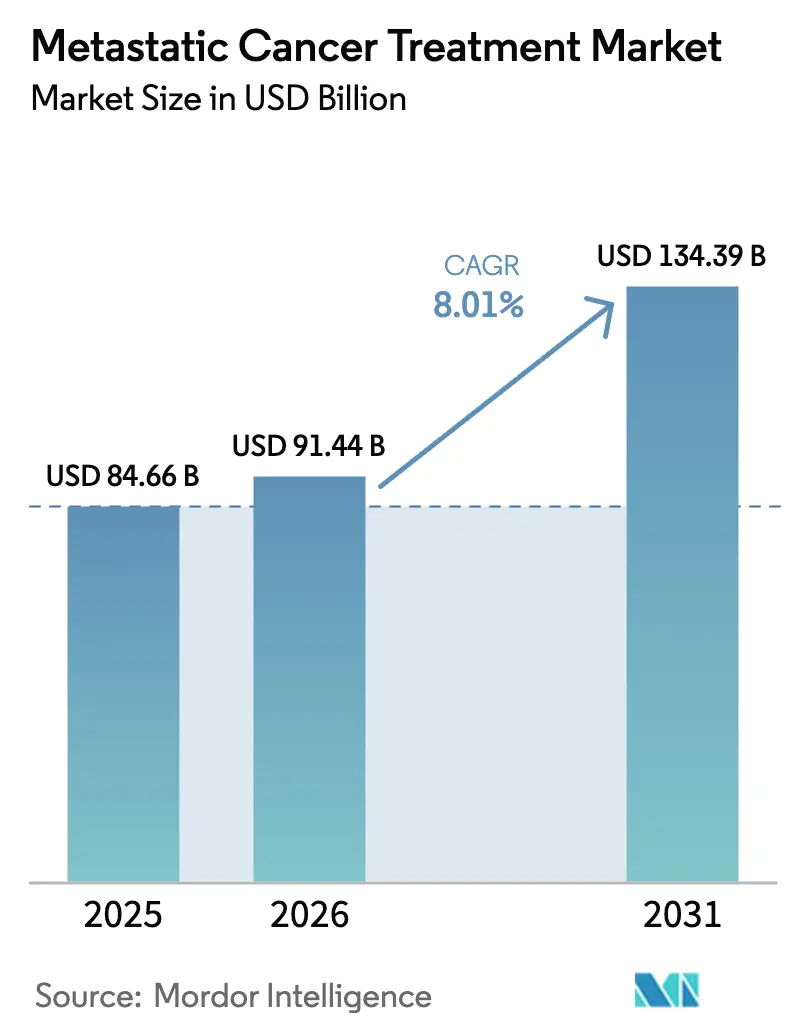
| Market Size (2026) | USD 91.44 Billion |
| Market Size (2031) | USD 134.39 Billion |
| Growth Rate (2026 - 2031) | 8.01 % |
| Fastest Growing Market | Asia-Pacific |
| Largest Market | North America |
| Market Concentration | Medium |
Major Players *Disclaimer: Major Players sorted in no particular order Image © Mordor Intelligence. Reuse requires attribution under CC BY 4.0. | |
Metastatic Cancer Treatment Market Analysis by Mordor Intelligence
The metastatic cancer treatment market size in 2026 is estimated at USD 91.44 billion, growing from 2025 value of USD 84.66 billion with 2031 projections showing USD 134.39 billion, growing at 8.01% CAGR over 2026-2031. Rapid regulatory clearances, rising precision-guided therapy use, and wider health-system reimbursement underpin this expansion. Momentum stems from 55 U.S. Food and Drug Administration approvals in 2024—the second-highest oncology total in three decades—and 28 positive European Medicines Agency opinions that same year, underscoring the shift from cytotoxic regimens to pathway-targeted and immune-modulating approaches. Targeted therapy already leads the metastatic cancer treatment market with a 54.51% share, yet cell and gene therapy is advancing the fastest at an 18.25% CAGR on the back of CAR-T production scale-ups and tumor-infiltrating lymphocyte breakthroughs. Hospital networks remain the primary treatment venue, but specialty clinics are expanding swiftly, mirroring decentralised trial models that cut enrolment timelines by up to 50% versus conventional sites. Regionally, North America keeps its lead, Asia-Pacific shows the highest growth, and patent-driven dealmaking is reshaping competitive positions.
Key Report Takeaways
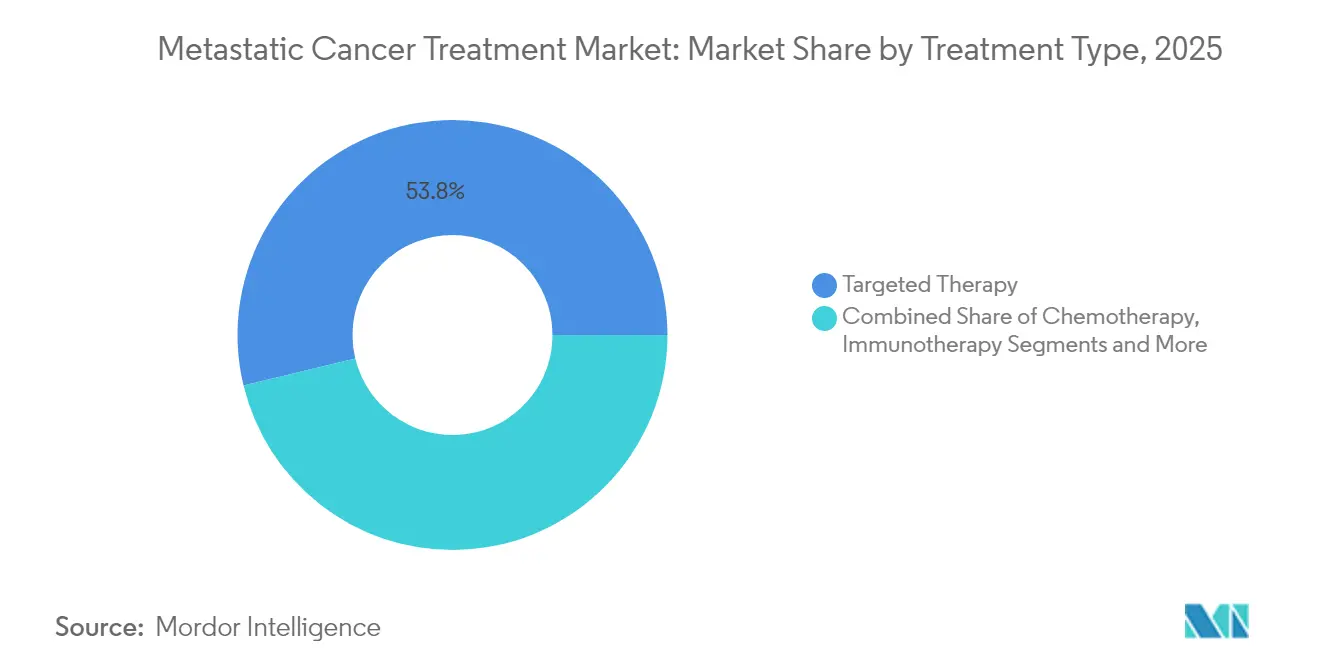
- By treatment type, targeted therapy commanded 53.78% of the metastatic cancer treatment market share in 2025; cell and gene therapy is projected to grow at an 17.35% CAGR to 2031.
- By cancer type, lung cancer led with 25.08% of the metastatic cancer treatment market size in 2025, while liver metastases will expand at a 12.14% CAGR through 2031.
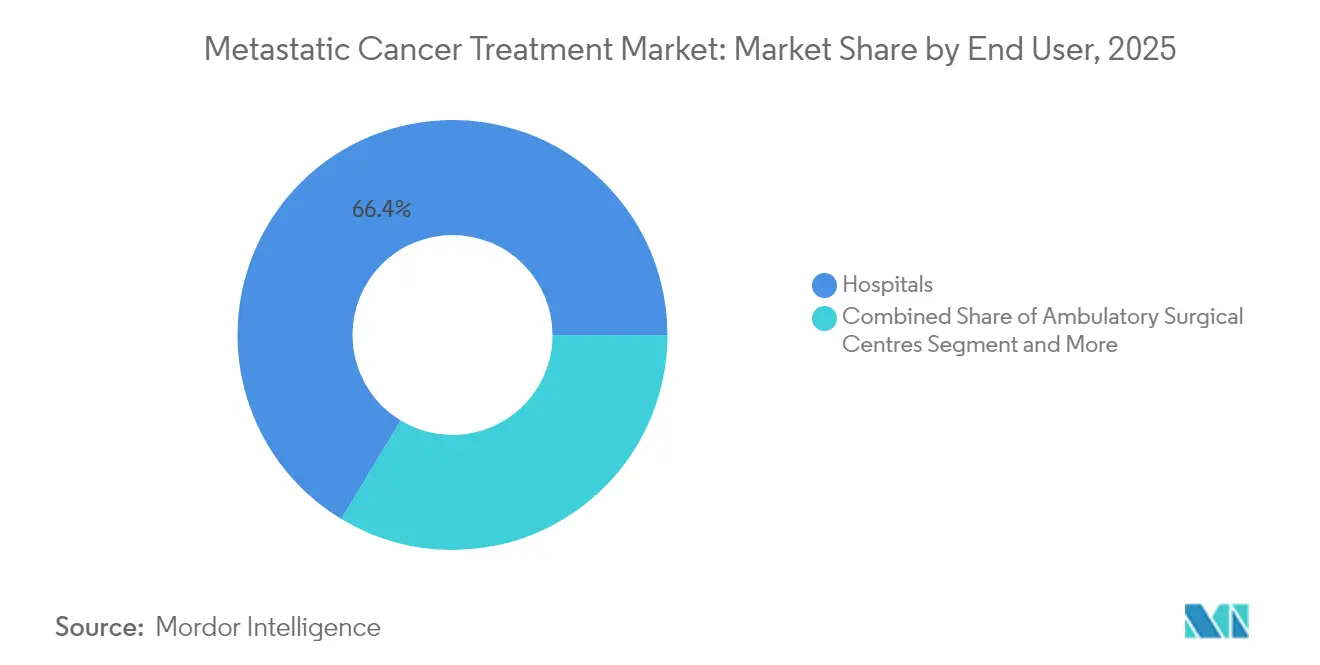
- By end user, hospital-based centres accounted for 66.35% of the metastatic cancer treatment market in 2025; specialty clinics post the highest forecast CAGR at 9.78% to 2031.
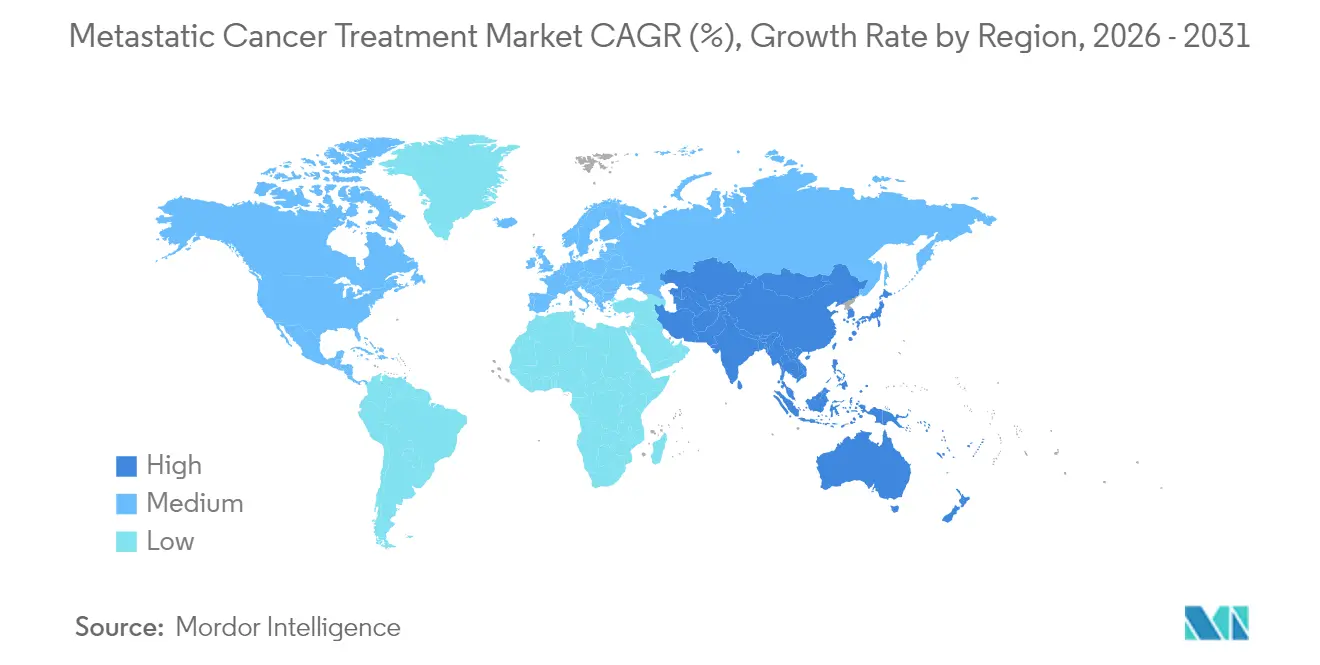
- By geography, North America captured 44.89% of the metastatic cancer treatment market in 2025, whereas Asia-Pacific is on track for a 10.22% CAGR to 2031.
Note: Market size and forecast figures in this report are generated using Mordor Intelligence’s proprietary estimation framework, updated with the latest available data and insights as of 2026.
Market Trends and Insights
Drivers Impact Analysis of Metastatic Cancer Treatment Market*
| Driver | (~) % Impact on CAGR Forecast | Geographic Relevance | Impact Timeline |
|---|---|---|---|
| Rising prevalence of metastatic cancers | +1.5% | Global, strongest in ageing North America & Europe | Long term (≥ 4 years) |
| Accelerated FDA/EMA approvals & label expansions | +1.2% | North America & Europe, spill-over to Asia-Pacific | Medium term (2–4 years) |
| Surge in immunotherapy adoption | +0.8% | Global, earliest uptake in advanced markets | Medium term (2–4 years) |
| Precision-medicine & companion-diagnostic uptake | +0.6% | Core in North America & Europe, rising in Asia-Pacific | Long term (≥ 4 years) |
| Tumor-agnostic approvals expanding revenue | +0.4% | Regulatory-advanced markets first, then global | Medium term (2–4 years) |
| Decentralised clinical-trial models | +0.3% | Dependent on digital readiness worldwide | Short term (≤ 2 years) |
| Source: Mordor Intelligence | |||
Accelerated FDA/EMA approvals & label expansions
Breakthrough therapy designations now cut median U.S. review times to 6.1 months, while the EMA issued eight conditional approvals for oncology products in 2024, including tisotumab vedotin and linvoseltamab, showing regulatory flexibility for high-need indications[1]. Streamlined CAR-T umbrella evaluations further trim filing burdens by 40%, advantaging sponsors with robust manufacturing and late-stage assets. Joint clinical assessments under the European Health Technology Assessment framework promise aligned value dossiers across member states, narrowing launch gaps and accelerating revenue capture.
Surge in immunotherapy adoption
Checkpoint inhibitors now span 15 approved tumour types, with biomarker-driven selection lifting overall response rates to 45% in PD-L1-positive populations. Combination regimens that convert “cold” tumours into inflamed phenotypes through radiation or oncolytic viruses broaden eligibility beyond the historical 30% responsive cohort, and early data with linvoseltamab shows a 70% objective response in heavily pre-treated myeloma. Such outcomes cement the metastatic cancer treatment market as an innovation engine for durable survival gains.
Precision-medicine & companion-diagnostic uptake
Eight tumour-agnostic therapies now mandate companion diagnostics, adding USD 2.3 billion in global testing revenue streams. Next-generation sequencing, liquid biopsy, and AI interpretation together reduced turnaround to 3 days, enabling same-clinic treatment decisions and making precision workflows mainstream. Diagnostic-therapeutic integrators enjoy 60% higher uptake than stand-alone drug developers, underscoring the business case for platform strategies.
Tumor-agnostic approvals creating new revenue pools
Broad molecular targeting triples the addressable base compared with single-indication launches. Pembrolizumab now holds clearances across 20 histologies, while larotrectinib treats any solid tumour harbouring NTRK fusions, giving sponsors multi-billion pipelines without de-novo discovery programmes. Flexible study designs also cut recruitment periods by 40%, concentrating capital efficiency and speeding time-to-break-even.
Restraints Impact Analysis of Metastatic Cancer Treatment Market*
| Restraint | (~) % Impact on CAGR Forecast | Geographic Relevance | Impact Timeline |
|---|---|---|---|
| High treatment costs & reimbursement hurdles | -0.9% | Global, highest pressure in emerging markets | Long term (≥ 4 years) |
| Severe immune-related adverse events (irAEs) | -0.7% | Advanced systems better equipped | Medium term (2–4 years) |
| Limited efficacy in cold tumours | -0.5% | Impacts 60–70% of solid tumour patients worldwide | Long term (≥ 4 years) |
| Radionuclide & cell-therapy supply bottlenecks | -0.4% | Manufacturing centred in North America & Europe | Short term (≤ 2 years) |
| Source: Mordor Intelligence | |||
High treatment costs & reimbursement hurdles
Average CAR-T pricing near USD 450,000 per course and antibody-drug conjugates exceeding USD 180,000 annually create affordability barriers. Total care costs soar another 60–80% due to specialised administration and toxicity management. Forty percent of U.S. commercial payers require prior authorisation for combination regimens, delaying optimal initiation, while European HTA bodies push for cost per quality-adjusted life year below EUR 100,000. Value-based contracting and biosimilar entry offer partial relief.
Severe immune-related adverse events (irAEs)
Grade 3-4 toxicities occur in up to 30% of immunotherapy recipients and trigger discontinuation in roughly 15%. Long-term endocrinopathies and pneumonitis inflate per-patient costs by USD 75,000–150,000. Access to specialist immunotoxicity clinics is uneven outside major academic centres, constraining broader uptake.
*Our forecasts treat driver/restraint impacts as directional, not additive. The impact forecasts reflect baseline growth, mix effects, and variable interactions.
Metastatic Cancer Treatment Market Segment Analysis
By Treatment Type:
Precision regimens anchor demand while cell therapy acceleratesTargeted therapies commanded 53.78% of 2025 revenue, anchored by robust biomarker-led protocols that cut empirical failure rates nearly in half. The segment enjoys stable formulary positioning and benefits from progressive label extensions. Chemotherapy persists mainly as a backbone for new combination protocols, and immunotherapy continues its expansion. Cell and gene therapy, though starting from a low base, posts the highest 17.35% CAGR. Legend Biotech’s plan to double Carvykti slots to 10,000 in 2025 exemplifies the infrastructure build-out required to satisfy demand. Novartis is similarly scaling radioligand output to 250,000 annual doses, addressing historic supply shortages.
The metastatic cancer treatment market size for cell and gene therapy is projected to expand at 17.35% CAGR between 2026 and 2031 on the back of manufacturing advances and favourable reimbursement pilots. Targeted therapy, despite slower percentage growth, will still add the largest absolute revenue owing to its broad base and numerous upcoming small-molecule launches.

By Cancer Type:
Lung cancer holds leadership and liver metastases surgeLung malignancies represented 25.08% of the metastatic cancer treatment market share in 2025, supported by universal EGFR, ALK, ROS1, and KRAS G12C screening. Continuous detection initiatives and liquid biopsy adoption sustain this edge. Breast cancer follows, driven by HER2-directed and CDK4/6 regimens, while prostate oncology benefits from androgen-pathway and PARP innovations.
Liver metastases treatment clocked the fastest 12.14% CAGR, propelled by histotripsy and improved ablation devices that create minimally invasive options for previously inoperable cases. Consequently, the metastatic cancer treatment market size for liver metastases is expected to outpace colorectal and melanoma segments through 2031, offering device and drug makers a high-growth niche.
By End User:
Hospital concentration endures but specialty clinics gain groundHospitals retained 66.35% revenue in 2025 due to complex procedure requirements, central pharmacy infrastructure, and higher reimbursement. The metastatic cancer treatment market share is likely to stay hospital-centric for CAR-T and radioligand infusions that demand round-the-clock monitoring. Academic centres inside the hospital group often act as early technology adopters.
Specialty clinics, however, are rising at a 9.78% CAGR. Consolidated oncology practices, tele-oncology, and remote monitoring allow sophisticated regimens to move outside tertiary centres, improving patient convenience and cutting indirect costs. Decentralised trials executed through these clinics have already reduced enrolment timelines by an average 40%, further supporting their momentum.
Geography Analysis
North America Metastatic Cancer Treatment Market
North America generated 44.89% of revenue in 2025, underpinned by robust Medicare reimbursement, multi-state early-access pathways, and a mature clinical-trial ecosystem that hosts 60% of active global oncology protocols. The United States enjoys rapid uptake thanks to breakthrough designations that shave 6–12 months off launch timelines. Canada provides universal coverage yet faces longer provincial negotiations.
Europe Metastatic Cancer Treatment Market
Europe stands second, benefiting from the EMA’s eight conditional oncology approvals in 2024. Germany leads uptake through well-funded cancer centres, while the United Kingdom imposes stricter cost-effectiveness hurdles. Southern European nations such as Spain have become attractive trial hubs, aided by EU-level cross-border research networks.
APAC Metastatic Cancer Treatment Market
Asia-Pacific delivers the strongest 10.22% CAGR. China slashed approval cycles to 12 months and expanded domestic biologic capacity, boosting access and price competition. Japan, with its rapidly ageing demographic, embraces novel regimens like tislelizumab. India leverages large generic plants and a vibrant medical-tourism economy, while South Korea and Australia supply sophisticated trial sites. Rising incidence—projected up 24% by 2035—keeps demand high.
Competitive Landscape
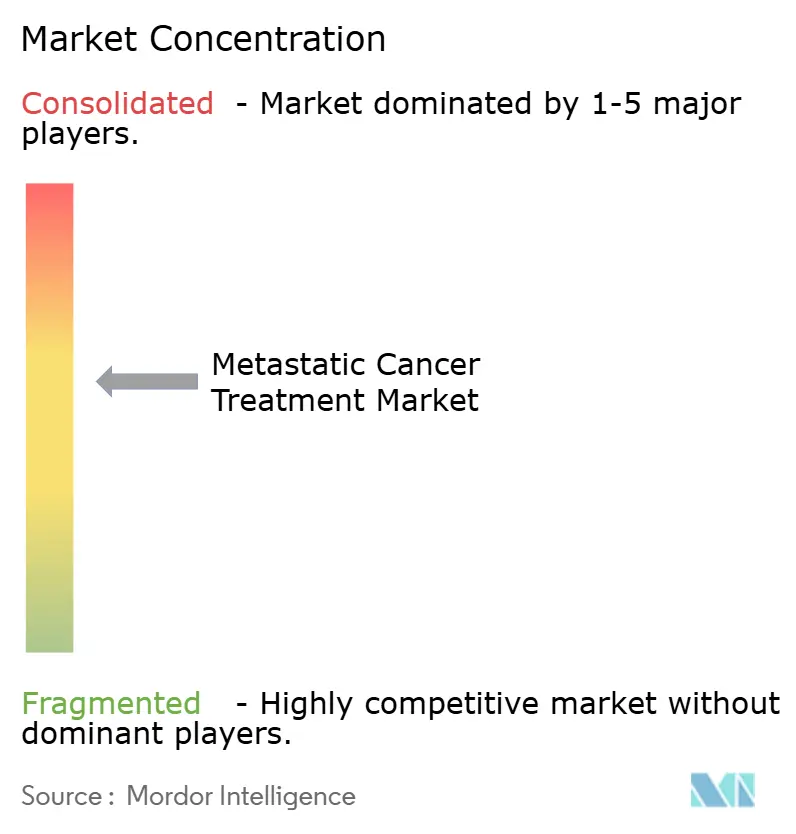
The metastatic cancer treatment industry remains moderately concentrated as diversified pharmaceutical majors battle agile biotechs. Bristol Myers Squibb, Roche, and Merck hold depth across checkpoints, antibody-drug conjugates, and radioligands. Pipeline gaps from looming patent cliffs prompt bolt-on M&A: Bristol Myers Squibb bought Mirati for USD 4.8 billion to secure KRAS G12C assets, and Merck spent USD 10.8 billion on Harpoon Therapeutics to access T-cell engagers[3]. Integrated diagnostic partnerships help incumbents defend share by embedding their medicines into testing algorithms.
Emerging players specialise in niche modalities. Novartis scales radioligand therapy, Legend Biotech focuses on BCMA-directed CAR-T, and Iovance pioneers TIL therapy for solid tumours, having filed Europe’s first application in 2024. Success hinges on manufacturing agility, payer alignment, and safety management infrastructure.
Digital health firms supply predictive algorithms for toxicity, adherence, and value tracking, positioning themselves as essential collaborators. The result is a dynamic marketplace where data, diagnostics, and drugs increasingly converge around the shared goal of durable control of advanced disease.
Metastatic Cancer Treatment Industry Leaders
-
Bristol Myers Squibb Company
-
Merck and Co Inc.
-
Johnson & Johnson Services Inc
-
Novartis AG
-
F. Hoffmann-La Roche Ltd
- *Disclaimer: Major Players sorted in no particular order
Metastatic Cancer Treatment Market Companies Covered in this Report
- Bristol-Myers Squibb
- Roche
- Merck
- Johnson & Johnson
- Novartis
- AstraZeneca
- Abbvie
- Pfizer
- Eli Lilly and Company
- Amgen
- GlaxoSmithKline
- Sanofi
- Bayer
- Astellas Pharma
- Seagen
- Gilead Sciences
- Regeneron Pharmaceuticals
- Takeda Pharmaceuticals
- BeiGene Ltd.
- Daiichi Sankyo Co., Ltd.
Market Opportunities and Future Outlook
White space in metastatic oncology is increasingly shaped by earlier-line use and improved delivery of established modalities, not only by new targets. In 2026, Gilead Sciences received U.S. FDA approval for Trodelvy (sacituzumab govitecan-hziy) in first-line unresectable locally advanced or metastatic triple-negative breast cancer. That shift highlights room for antibody-drug conjugates to move upstream in treatment pathways and expand combination strategies across high-burden metastatic settings.
Operationally, subcutaneous and co-formulated delivery approaches already visible in major brands across solid tumors are creating practical access gains for hospitals and specialty clinics. Precision oncology workflows are also opening additional commercial and clinical adoption space through drug-diagnostic alignment and monitoring. Recent FDA activity in 2026 around metastatic indications in lung, colorectal, breast, and prostate cancers points to continued label expansion opportunities for biomarker-defined subsets, which can support broader companion-diagnostic penetration and associated testing demand. In immuno-oncology, the use of circulating tumor DNA and minimal residual disease testing to guide therapy before radiographic progression is becoming more operationally feasible, supporting partnership opportunities across therapeutics, diagnostics, and data platforms for selection and monitoring in metastatic disease.
Recent Industry Developments in Metastatic Cancer Treatment Market
- April 2026: SystImmune and Bristol Myers Squibb reported positive Phase III interim topline results for izalontamab brengitecan (Iza-bren) in previously treated unresectable locally advanced or metastatic triple-negative breast cancer. The update reinforced continued innovation in advanced breast cancer, where efficacy and tolerability improvements can rapidly reshape sequencing and combination strategies in metastatic care.
- February 2025: Bristol Myers Squibb received U.S. FDA approval for Opdivo (nivolumab) plus Yervoy (ipilimumab) for previously untreated MSI-H or dMMR unresectable or metastatic colorectal cancer. The label expansion strengthened checkpoint inhibitor use in a biomarker-defined metastatic population and supported broader adoption of upfront testing to guide first-line decisions.
- June 2024: Bristol Myers Squibb announced U.S. FDA accelerated approval of KRAZATI (adagrasib) in combination with cetuximab for adults with previously treated KRAS G12C-mutated locally advanced or metastatic colorectal cancer. The approval advanced targeted treatment options in metastatic CRC and elevated the role of mutation screening to match patients to pathway-driven regimens.
Metastatic Cancer Treatment Market Report Scope and Research Methodology
Market Definition and Coverage
For this methodology, the market covers drug-based and therapy-based treatments used to manage metastatic (stage IV) cancer. This includes systemic options delivered in hospitals and clinics to slow disease progression and extend survival.
Scope exclusions: Procedures and supportive care that do not directly treat the cancer (for example, standalone pain management services) are not counted in the market value.
Segments Covered in This Report
- By Treatment Type
- Chemotherapy
- Immunotherapy
- Targeted Therapy
- Hormone Therapy
- Cell & Gene Therapy
- Radiation Therapy
- By Cancer Type
- Breast
- Lung
- Prostate
- Colorectal
- Melanoma
- Liver
- Others
- By End User
- Hospitals
- Specialty Clinics
- Ambulatory Surgical Centres
- Academic & Research Institutes
- Geography
- North America
- United States
- Canada
- Mexico
- Europe
- Germany
- United Kingdom
- France
- Italy
- Spain
- Rest of Europe
- Asia-Pacific
- China
- Japan
- India
- South Korea
- Australia
- Rest of Asia-Pacific
- Middle East and Africa
- GCC
- South Africa
- Rest of Middle East and Africa
- South America
- Brazil
- Argentina
- Rest of South America
- North America
Data Sources, Market Sizing, and Validation
Desk Research
We started by building the disease and treatment context using public sources that are easy to verify. This included cancer burden and survival statistics from the World Health Organization and the International Agency for Research on Cancer, along with US incidence and treatment pattern signals from the National Cancer Institute.
Pricing and access assumptions were then grounded using policy and product-level information from the US FDA for approvals and labels, plus published health technology assessment and reimbursement references where available. We also reviewed peer-reviewed oncology journals for metastatic treatment standards, sequencing patterns, and adoption shifts across immunotherapy, targeted therapy, chemotherapy, and hormone therapy. Company filings, investor presentations, and reputable press were used to cross-check portfolio exposure and geographic mix. A paid subscription database for company financials and a separate one for patent and pipeline tracking were used selectively to confirm timelines and revenue direction. The sources listed here are illustrative, and many other public documents were also used for data collection, validation, and clarification during the work.
Primary Interviews and Surveys
Our primary work focused on validating what gets used in real practice and what is reimbursed across major regions, since metastatic care pathways vary by tumor type and line of therapy. Interviews and survey responses were used to confirm treatment mix shifts, typical duration of therapy, and the practical impact of new approvals and guideline changes across APAC, EMEA, and the Americas.
Distribution of primary research fieldwork respondents
| Company type | Respondent position | Region |
|---|---|---|
| Top tier: 28% | CXOs: 14% | APAC: 44% |
| Mid tier: 57% | Functional/Unit leaders: 33% | EMEA: 31% |
| Smaller Players: 15% | Managers: 53% | Americas: 25% |
Market-Sizing & Forecasting
The core sizing starts from a top-down demand pool build using metastatic patient counts by major tumor types, then filtering through treated share, regimen mix, and typical lines of therapy in each geography. Once the treated pool is established, spending is reconstructed using therapy duration assumptions and representative annual cost ranges for the main systemic options, then rolled up into a total value.
To keep the model realistic, the inputs were anchored on practical fingerprints that experts could confirm quickly, such as stage IV incidence and prevalence trends, biomarker testing and eligibility rates for targeted agents, share of patients receiving immunotherapy in first line versus later lines, average treatment duration and discontinuation patterns, and the timing of new approvals or label expansions. Totals were then checked using selective bottom-up approximations, including sampled therapy cost times volume checks by tumor type and channel checks on hospital and clinic utilization. This helped adjust areas where public pricing or access signals were uneven.
For forecasting, scenario analysis was applied because uptake and access can shift quickly when a therapy gains a new indication or when reimbursement improves. The forward view uses expected patient pool changes, pipeline and approval timing, likely penetration curves by therapy class, and gradual price pressure, then stress tests are applied using feedback from primary experts to keep the trajectory plausible.
Data Validation & Update Cycle
Before finalizing, we ran consistency checks across regions and tumor types so that treatment mix, duration, and pricing logic did not create unrealistic jumps that would conflict with known clinical practice. Outputs were also compared with independent signals, including approval timelines, guideline changes, and major therapy class share shifts. When outliers appeared, assumptions were re-checked, and relevant interviewees were re-contacted when needed.
A multi-step internal review was followed so that calculation logic, currency conversions, and aggregation rules were verified by another analyst before sign-off. Reports are refreshed annually, and interim updates are made when material events occur, such as major label expansions, safety warnings, or meaningful reimbursement changes. Before delivery, a final pass is completed so clients receive the latest updated view available at that point in time.
Mordor Intelligence's Metastatic Cancer Treatment Market Estimate Compared With Other Published Estimates
Published market values for metastatic cancer treatment often vary because the underlying definition of what is counted is not always the same, and the patient and pricing assumptions can be built from different starting points. Differences also show up when one estimate leans more on list prices and broad therapy baskets, while another ties spending more tightly to treated metastatic cohorts and therapy duration.
By tracking treated stage IV patient pools and line of therapy mix across tumor types, and then refreshing price and access assumptions annually, Mordor Intelligence keeps the total aligned to what is actually used in metastatic settings rather than blending in adjacent oncology drug spend. Gaps also come from how targeted therapy and immunotherapy adoption is projected, whether eligibility is constrained by biomarker prevalence, and how currency timing is handled for multi-region rollups, which can push totals higher or lower even in the same year.
Benchmark comparison
| Source | Market Size | Gaps in Research Methodology |
|---|---|---|
| Mordor Intelligence | USD 91.44 B (2026) | |
| Healthcare Publisher A | USD 57.50 B (2024) | Uses an earlier base year and a broader product style segmentation, and it can understate later adoption effects when newer metastatic indications and longer treatment durations are not fully carried into the base sizing. |
| Industry Portal B | USD 77.92 B (2024) | Frames the scope as metastatic cancer treat drugs and may apply a product type rollup with less explicit treated cohort logic, which can shift totals depending on what is included as metastatic use versus general oncology use. |
The spread in estimates mainly reflects year choice and how tightly spending is connected to metastatic treated cohorts, especially by tumor type and therapy duration. When the model keeps eligibility, regimen mix, and adoption timing visible, the market value becomes easier to trace and to re-run as new clinical and reimbursement events occur.
Key Questions Answered in the Report
What is the current metastatic cancer treatment market size?
The metastatic cancer treatment market size is USD 91.44 billion in 2026, with an 8.01% forecast CAGR through 2031.
Which treatment type dominates the metastatic cancer treatment market?
Targeted therapy leads, accounting for 53.78% of 2025 revenue thanks to widespread biomarker-guided use.
Why is cell and gene therapy growing rapidly?
Manufacturing expansions, favourable reimbursement pilots, and strong clinical responses drive an 17.35% CAGR for cell and gene therapy between 2026 and 2031.
Which region shows the fastest growth?
Asia-Pacific posts the highest forecast CAGR at 10.22% through 2031 due to faster approvals, manufacturing investment, and a rising incidence burden.
How are high treatment costs being addressed?
Manufacturers increasingly pursue value-based contracts and explore biosimilar or next-generation platforms aimed at lowering acquisition and total care costs.