
Metal Oxide Nanoparticles Market Size and Share
Market Overview
| Study Period | 2020 - 2031 |
|---|---|
| Market Size (2026) | USD 1.11 Billion |
| Market Size (2031) | USD 1.54 Billion |
| Growth Rate (2026 - 2031) | 6.74 % |
| Fastest Growing Market | Asia Pacific |
| Largest Market | Asia Pacific |
| Market Concentration | Medium |
Major Players *Disclaimer: Major Players sorted in no particular order Image © Mordor Intelligence. Reuse requires attribution under CC BY 4.0. | |
Metal Oxide Nanoparticles Market Analysis by Mordor Intelligence
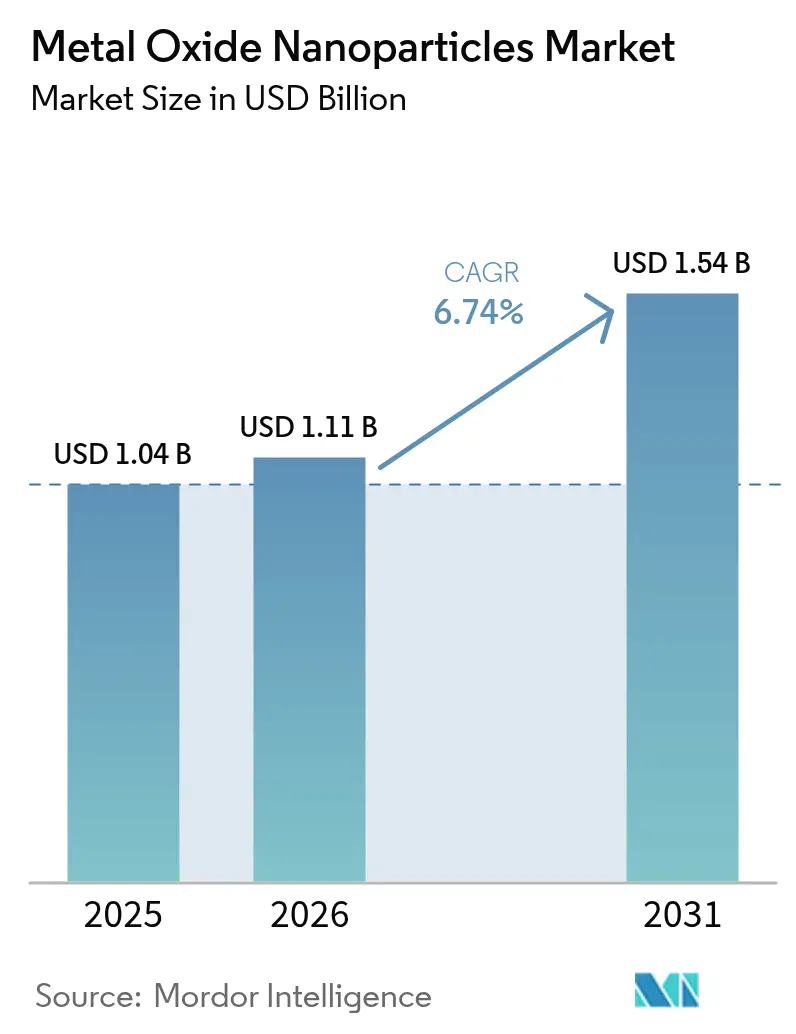
The Metal Oxide Nanoparticles Market size market is expected to grow from USD 1.04 billion in 2025 to USD 1.11 billion in 2026 and is forecast to reach USD 1.54 billion by 2031 at 6.74% CAGR over 2026-2031. Robust demand from semiconductor fabs, electric-vehicle battery makers and high-performance coating formulators underpins this outlook. Advanced node logic below 5 nm, solid-state electrolyte prototypes and antimicrobial surface treatments all rely on metal oxides whose surface-to-volume ratios deliver properties unavailable in bulk equivalents. Supply chains remain regionally concentrated, yet bio-based synthesis pilots are lowering environmental footprints while meeting electronics-grade purity thresholds. Regulatory momentum around nanomaterial stewardship, especially in the European Union and North America, is steering procurement toward greener production routes, favouring suppliers that disclose full life-cycle data.
Key Report Takeaways
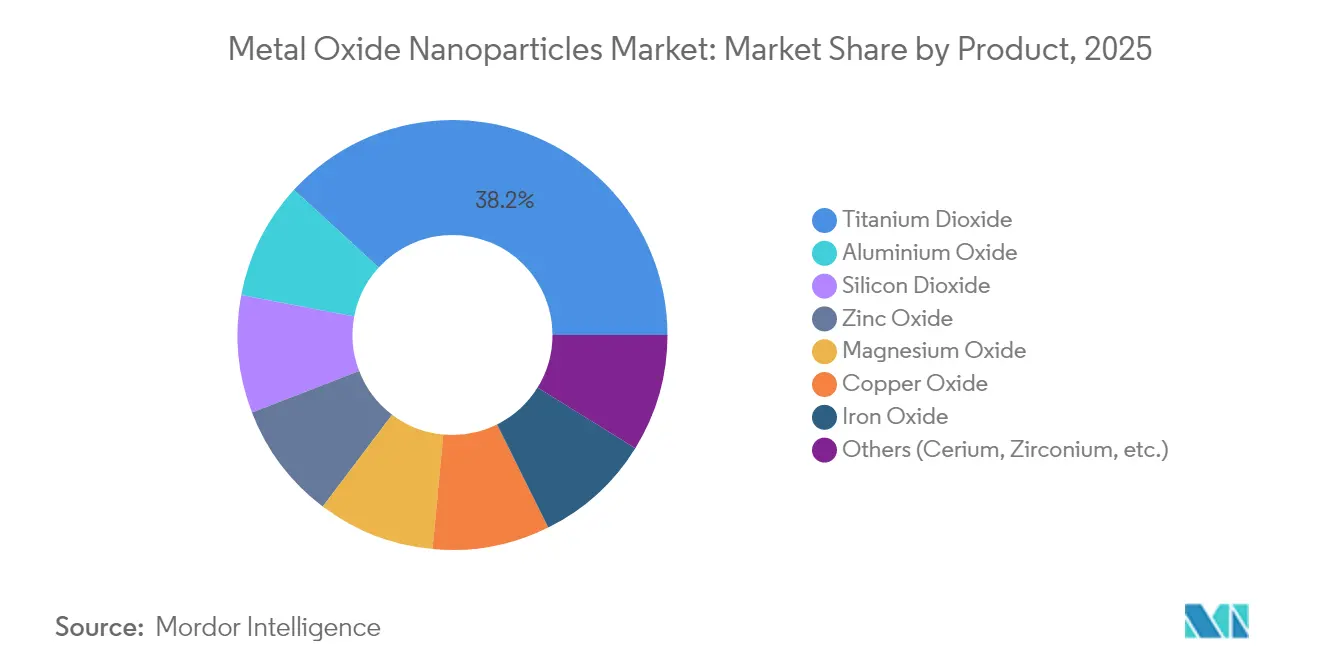
- By product type, Titanium Dioxide led with 38.20% of the Metal oxide nanoparticles market share in 2025.
- By synthesis method, chemical routes held 62.55% share of the Metal oxide nanoparticles market size in 2025, while bio-based synthesis is projected to expand at 7.89% CAGR through 2031.
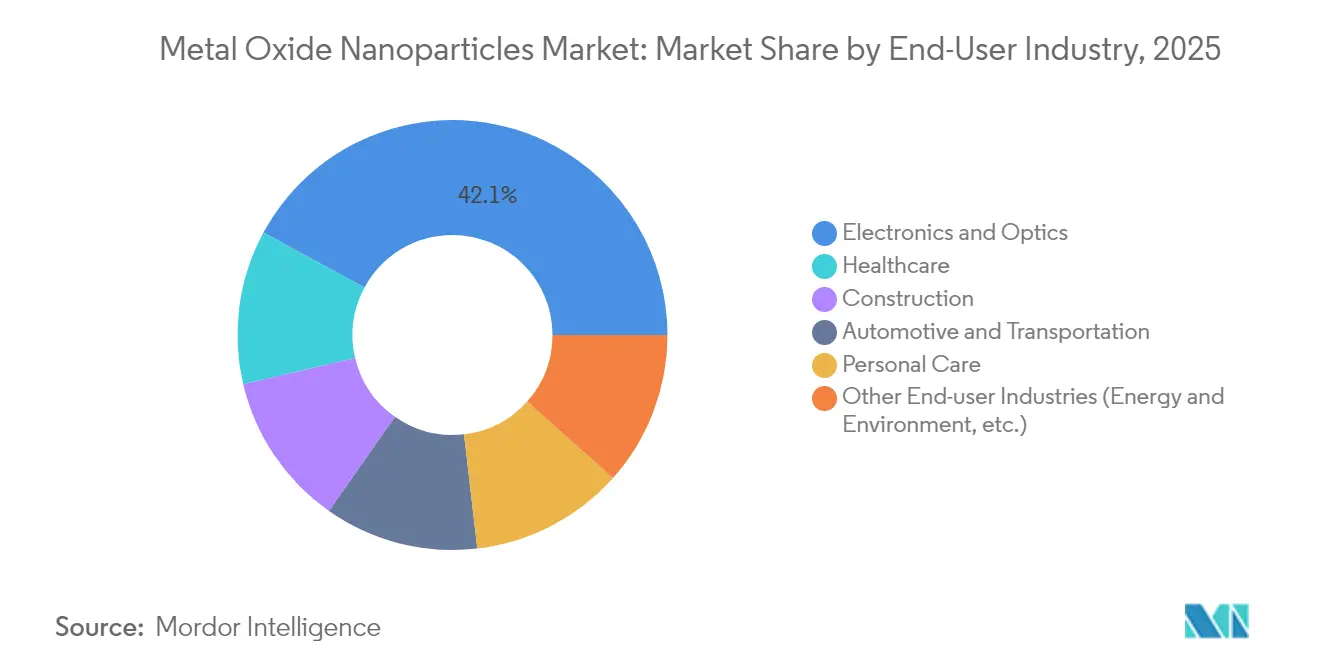
- By end-user industry, electronics and optics commanded 42.10% share of the Metal oxide nanoparticles market size in 2025; energy & environment is forecast to advance at an 8.32% CAGR to 2031.
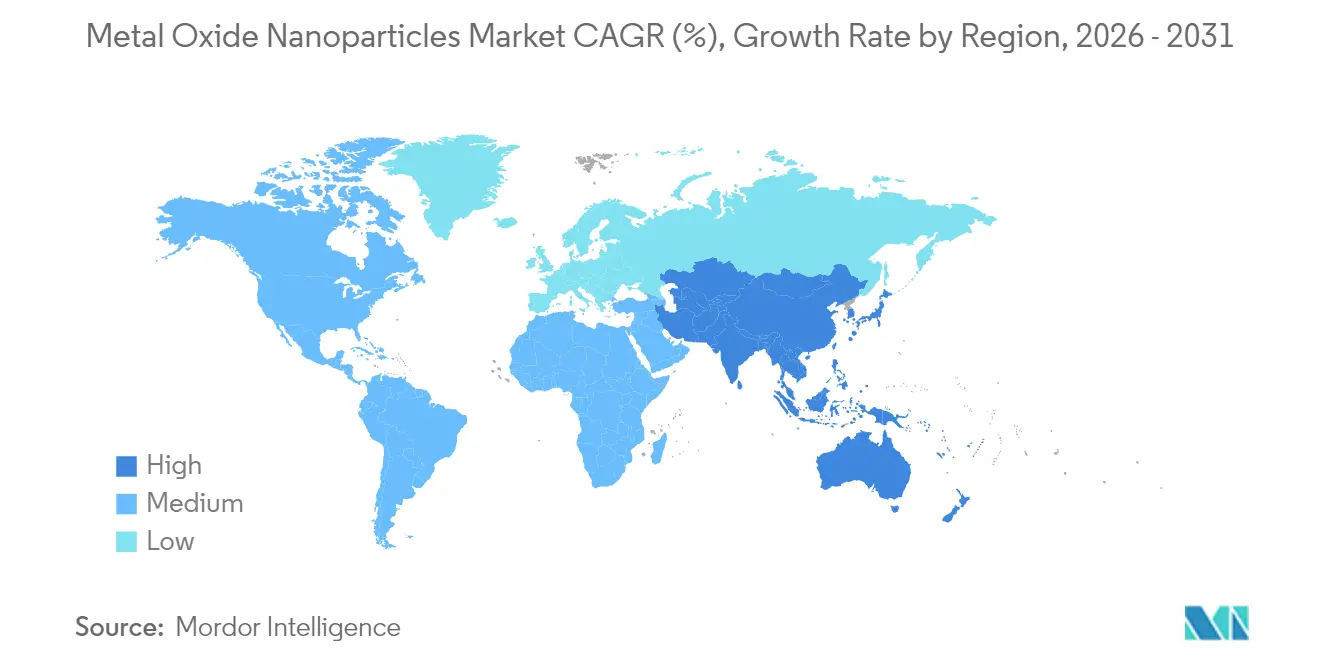
- By geography, Asia-Pacific accounted for 47.40% of the Metal oxide nanoparticles market share in 2025 and is set to grow at 7.55% CAGR between 2026 and 2031.
Note: Market size and forecast figures in this report are generated using Mordor Intelligence’s proprietary estimation framework, updated with the latest available data and insights as of 2026.
Global Metal Oxide Nanoparticles Market Trends and Insights
Drivers Impact Analysis*
| Driver | (~) % Impact on CAGR Forecast | Geographic Relevance | Impact Timeline |
|---|---|---|---|
| Growing electronics demand for high-k dielectric & transparent conductive films | +1.8% | Global, concentrated in APAC semiconductor hubs | Medium term (2-4 years) |
| Rising use as antibacterial agents in personal care & coatings | +1.2% | Global, with regulatory leadership in EU and North America | Short term (≤ 2 years) |
| Surge in Li-ion battery cathode & solid-state electrolyte R&D | +1.5% | APAC core, spill-over to North America and EU | Long term (≥ 4 years) |
| Transition to green synthesis routes enhancing regulatory acceptance | +0.9% | EU and North America leading, APAC following | Long term (≥ 4 years) |
| Demand for UV-blocking additives in 3D-printing photopolymers | +0.7% | North America and EU, early adoption in APAC | Medium term (2-4 years) |
| Government incentives for semiconductor fabs needing high-purity oxide nanopowders | +1.1% | United States, South Korea, Japan, Taiwan | Short term (≤ 2 years) |
| Source: Mordor Intelligence | |||
Growing electronics demand for high-k dielectric & transparent conductive films
Advanced node logic chips below 5 nm require ultrathin gate stacks made from titanium dioxide and hafnium oxide nanoparticles that minimize leakage currents while preserving capacitance. United States incentives total USD 1.4 billion for advanced packaging, with funds supporting materials down-selection that depends on semiconductor-grade oxides[1]. Touchscreens and flexible OLED displays rely on indium tin oxide and zinc oxide nanoparticle films that remain conductive under repeated bending cycles. AI accelerators positioned at the edge drive higher operating temperatures, compelling designers to specify dielectric layers able to withstand thermal spikes without drifting electrical constants. HP’s USD 50 million Oregon expansion aims to scale microfluidic MEMS technologies that incorporate oxide thin films for nozzle and channel insulation. These converging trends sustain a high-purity materials pipeline that anchors the Metal oxide nanoparticles market.
Rising use as antibacterial agents in personal care & coatings
Zinc oxide and copper oxide nanoparticles deactivate 99.9% of bacteria within 10 minutes by releasing reactive oxygen species, offering an alternative to conventional preservatives. Pandemic-era building retrofits accelerated orders for antimicrobial wall paints and HVAC filters embedding these oxides. European regulators formalised nano-specific safety dossiers for TiO₂ and ZnO in cosmetics, signalling likely adoption in other jurisdictions and giving compliant producers first-mover advantage. Construction specifications increasingly embed antimicrobial coatings to extend maintenance intervals, while smart-textile manufacturers incorporate nanoparticle finishes that survive 50+ wash cycles. The breadth of applications continues to pull new volumes into the Metal oxide nanoparticles market.
Surge in Li-ion battery cathode & solid-state electrolyte R&D
Battery developers engineer lithium nickel manganese cobalt oxide and lithium iron phosphate cathodes with nanoscale morphology control to shorten diffusion paths. Evonik’s Yokkaichi fumed alumina plant, opening 2025, will supply separator coatings demanding 99.99% purity grades. Ceramic solid-state electrolytes formulated with zirconia and alumina nanoparticles now achieve ionic conductivities of 10^-3 S/cm at room temperature. American Elements expanded its portfolio to include silicon nanoparticles coated with metal oxides that mitigate volumetric expansion in high-capacity anodes[2]. With automakers committing to multi-gigawatt-hour cell factories, stable upstream supply strengthens the Metal oxide nanoparticles market.
Transition to green synthesis routes enhancing regulatory acceptance
Plant-extract and microbial processes cut energy input by up to 60% versus conventional sol-gel methods while sidestepping toxic solvents. Proof-of-concept lines converting agricultural waste into ZnO and TiO₂ feedstocks are reaching kilogram-per-hour output, matching semiconductor purity after post-synthesis calcination. European buyers evaluating cradle-to-gate emissions now treat bio-based nanoparticles as a differentiator in supplier scorecards. Harmonised protocols for biologically derived powders support regulatory filings, smoothing commercial rollout. These developments position sustainable processes as a core growth lever inside the Metal oxide nanoparticles market.
Restraints Impact Analysis*
| Restraint | (~) % Impact on CAGR Forecast | Geographic Relevance | Impact Timeline |
|---|---|---|---|
| Toxicity and environmental persistence prompting stricter regulations | -1.4% | Global, with EU and North America leading regulatory stringency | Medium term (2-4 years) |
| Lack of standardized nano-scale metrology across supply chains | -0.8% | Global, particularly affecting cross-border trade | Short term (≤ 2 years) |
| Price volatility of rare-earth precursors for complex oxides | -0.6% | Global, with supply concentration in China creating vulnerabilities | Short term (≤ 2 years) |
| Source: Mordor Intelligence | |||
Toxicity and environmental persistence prompting stricter regulations
Tokyo University of Science revealed that ultra-small silica nanoparticles alter protein secondary structures, increasing β-sheet content linked to neurodegeneration. Water-treatment plants struggle to capture sub-50 nm particles, leading to accumulation in aquatic ecosystems. The European Union broadened REACH to mandate full life-cycle safety files for nanomaterials, stretching product qualification timelines and raising compliance costs. Manufacturers unable to furnish chronic toxicity data risk delayed market entry, tempering near-term expansion of the Metal oxide nanoparticles market.
Lack of standardized nano-scale metrology across supply chains
Inter-laboratory tests show particle-size readings can diverge by 20% despite identical instrumentation, underscoring the need for certified reference materials. Non-uniform reporting complicates regulatory reviews and forces buyers to pad specifications, increasing scrap risk. NIST is developing calibration artefacts and best-practice guides to close these gaps. Until adoption becomes widespread, measurement uncertainty will continue to challenge just-in-time delivery models in the Metal oxide nanoparticles market.
*Our forecasts treat driver/restraint impacts as directional, not additive. The impact forecasts reflect baseline growth, mix effects, and variable interactions.
Segment Analysis
By Product: Titanium Dioxide anchors electronics demand
Titanium Dioxide retained a 38.20% stake in the Metal oxide nanoparticles market in 2025, buoyed by dual roles in UV-blocking sunscreens and 5 nm gate dielectrics. Over 98% visible-light transmission photoresists rely on TiO₂’s high refractive index, keeping defect densities below 0.3 cm^-2 in extreme-ultraviolet lithography. Magnesium Oxide posts the fastest CAGR at 7.78% through 2031, propelled by its ability to stabilise ceramic electrolytes at 300 °C. Silicon Dioxide broadens its reach into additive manufacturing powders, while Zinc Oxide expands inside antimicrobial polymer films. These shifts keep product differentiation high and support value capture inside the Metal oxide nanoparticles market.
Japanese plasma-spray breakthroughs now deliver TiO₂ nanoparticles averaging 40 nm at 12.3 g/min throughput, closing the scale gap between pilot and mass production. Aluminum Oxide’s presence in separator coatings and ceramic substrates further entrenches its role, especially following Evonik’s capacity build-out. Copper and Iron Oxides occupy catalysis and magnetic-storage niches, and ceria or zirconia oxides serve fuel cell and high-temperature turbine markets. The resulting portfolio complexity encourages strategic sourcing programs that balance cost, purity and functional performance, bolstering resilience across the Metal oxide nanoparticles industry.

By Synthesis Method: Chemical routes dominate, bio-based gains pace
Chemical processes constitute 62.55% of 2025 production as sol-gel, precipitation and CVD lines guarantee parts-per-billion impurity control. These mature platforms underpin semiconductor node migrations, anchoring the Metal oxide nanoparticles market. Yet bio-based synthesis is set for 7.89% CAGR, catalysed by policy incentives and early adopter demand from personal-care brands seeking eco-labels. Pilot units using citrus peel extracts now produce ZnO nanorods with 30 nm mean diameters and consistent aspect ratios below 2.5, matching optoelectronic grade standards.
Hybrid workflows that blend biological templates with downstream chemical calcination offer tunable surface functionalisation useful in targeted drug delivery. Physical techniques such as mechanical milling or pulsed-laser vaporisation keep a foothold where unique morphologies are needed, for instance in thermally conductive fillers. As metrology protocols converge, parity in specification language between green and conventional powders will expand purchasing options, intensifying competition inside the Metal oxide nanoparticles market.
By End-User Industry: Electronics leads while energy accelerates
Electronics and optics applications captured 42.10% of the Metal oxide nanoparticles market size in 2025. Multi-chiplet packaging architectures hinge on ultra-pure oxide layers that isolate heat-generating dies, and display makers deploy nanoparticle inks for bendable touch sensors. Government allocations of USD 1.7 billion for semiconductor materials in North America directly boost procurement.
Energy & environment is the fastest riser at 8.32% CAGR. Lithium-ion cell makers coat separators with alumina nanosheets only 30 nm thick, reducing thermal runaway by 60%. Solid-state electrolyte prototypes featuring sulfide-stabilised zirconia nanoparticles hit cycle lives beyond 1,000 charges at 25 °C. Healthcare gains from metal-oxide-mediated photodynamic therapies, while construction adopts nanoparticle-enhanced cement that extends service life in coastal infrastructure. This diversified pull cements long-term relevance for the Metal oxide nanoparticles industry.
Geography Analysis
Asia-Pacific held 47.40% of the Metal oxide nanoparticles market in 2025 and is poised for 7.55% CAGR through 2031. China’s titanium dioxide capacity nears 7 million tons following multi-province expansions, yet anti-dumping actions by the EU and Brazil tighten margins. Japan’s universities pioneer magnetic nanoparticle therapies for cancer and improve defect detection in powder batches, reinforcing domestic high-value demand. South Korea and Taiwan leverage oxide purity to sustain foundry competitiveness, and India grows output for sunscreens and architectural coatings. End-to-end electronics ecosystems and targeted subsidies preserve the region’s primacy within the Metal oxide nanoparticles market.
North America benefits from CHIPS Act funding that underwrites polysilicon and substrate projects, pulling local oxides into advanced-packaging supply chains. Hemlock Semiconductor’s USD 325 million Michigan investment will ship 59,000 metric tons of hyper-pure polysilicon annually, each ingot doped with metal oxide trace additives. Extensive R&D activity translates to early adoption of bio-based synthesis, while aerospace primes demand for radiation-hard oxides. Cross-border integration with Canada’s mining and Mexico’s assembly plants underpins a resilient regional Metal oxide nanoparticles market.
Europe prioritises sustainability and compliance. REACH nano-amendments motivate automakers to source low-carbon alumina for clear-coat formulations, and aerospace primes ceramic-matrix composite investments that rely on yttria-stabilised zirconia nanopowders. Germany leads industrial throughput, while Nordic nations incubate circular-economy pilots reclaiming oxides from end-of-life batteries. Middle East and Africa build construction and solar projects that integrate nanoparticle additives for heat-reflective paints. South America deploys oxides to enhance ore beneficiation and fertiliser efficiency, adding incremental volumes to the Metal oxide nanoparticles market.
Regulatory Landscape
Regulation of metal oxide nanoparticles is shaped by chemical safety frameworks that now treat nanoforms as distinct compliance objects, which increases documentation and test-data demands for suppliers serving electronics, coatings, personal care, and energy end uses. In the European Union, REACH nanoform requirements (implemented via amendments to the REACH Annexes) drive registration dossiers with nano-specific characterization (for example, particle size distribution and surface treatment) for substances manufactured or imported above 1 tonne per year. This heightens the value of robust metrology and traceable QC systems for nanopowders.
In the United States, TSCA actions continue to shape market-entry pathways for engineered nano-substances. In April 2026, the US Environmental Protection Agency issued a Significant New Use Rule (SNUR) covering mixed metal oxide substances (including cobalt lithium manganese nickel oxide), requiring notification at least 90 days before manufacture or import. This adds lead time and exposure-control planning for battery-material and catalyst-grade nano-oxides. Parallel work through OECD test guideline programs and guidance consultations (including 2024-2026 progress and draft guidance activity focused on nanomaterials) supports greater cross-border alignment in testing expectations, which encourages suppliers to build GLP-ready toxicology and fate data packages alongside product qualification files.
Value Chain Analysis
The value chain starts with upstream minerals and chemical intermediates (mining/beneficiation and conversion into bulk oxides or soluble salts), then moves into precursor purification and nanoparticle synthesis using chemical routes (sol-gel, precipitation, CVD), physical routes (milling, vapor-based approaches), and emerging green/bio-based methods. Midstream players concentrate on particle engineering (size distribution, morphology, surface functionalization) and contamination control to meet electronics-grade purity thresholds, followed by post-processing (drying, calcination, classification), packaging, and logistics designed to prevent moisture uptake and cross-contamination.
Downstream, nanoparticles are typically sold directly to OEMs and formulators, or through specialty chemical distributors, and then integrated into electronic pastes and thin films, battery components (cathode, electrolyte, separator-coating additives), coatings, personal-care formulations, and environmental catalysts. Value creation centers on qualification support and application co-development rather than commodity supply, because buyers demand repeatable performance tied to tight PSD, surface chemistry, and dispersion behavior. A key bottleneck remains long customer qualification cycles (often 12-24 months), especially for semiconductor and battery applications, which increases switching costs and favors suppliers with consistent QC and documentation. Regulatory-driven transparency requirements (for example, REACH nanoform dossier expectations) also increase the need for standardized measurement and reporting, while technical literature in 2026 continues to highlight industrial reproducibility challenges between green and conventional ZnO synthesis routes, reinforcing the importance of scalable, continuous, and well-instrumented production protocols.
Competitive Landscape
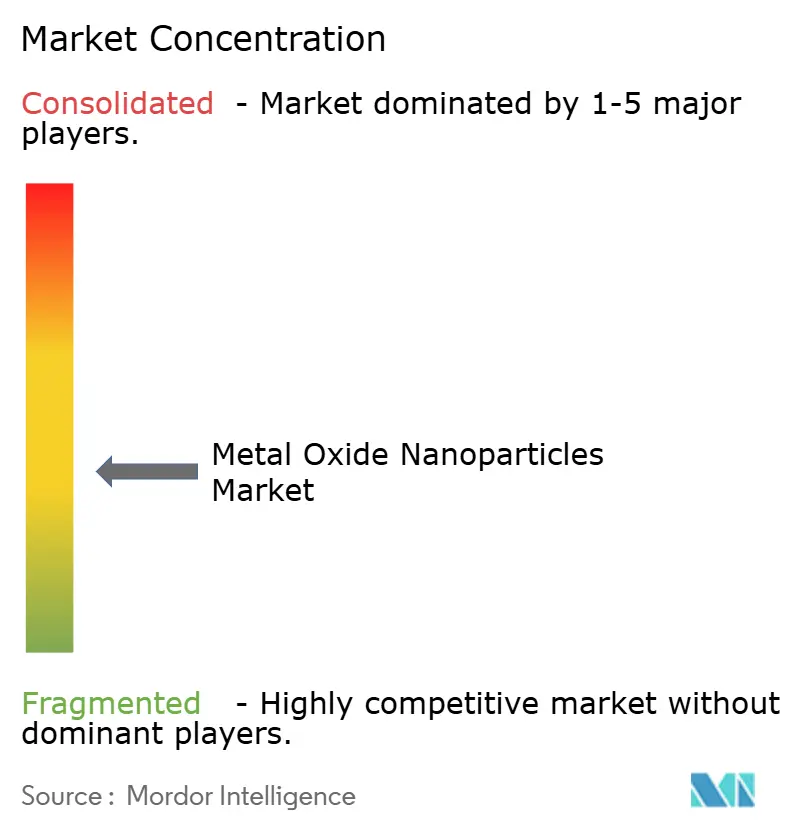
The Metal oxide nanoparticles market remains moderately fragmented. Large integrated players such as Evonik, Sumitomo Chemical and American Elements leverage controlled precursor chains to guarantee semiconductor-grade purity, while niche specialists like SkySpring Nanomaterials tailor coatings for magnetic data storage. Consolidation prospects increase as OEMs simplify approved-vendor lists, valuing suppliers able to cover multiple oxide families under uniform quality systems.
Process innovation serves as a strategic differentiator. Evonik’s fumed alumina line in Japan exemplifies CAPEX directed at fast-growing battery segments, while American Elements expands IP around oxide-coated silicon anodes. Patent filings in pulse-modulated plasma synthesis and bio-templated routes underscore active R&D rivalry.
Metal Oxide Nanoparticles Industry Leaders
-
American Elements
-
Nanoshell LLC
-
Meliorum Technologies, Inc.
-
Evonik Industries AG
-
Merck KGaA
- *Disclaimer: Major Players sorted in no particular order
Market Opportunities and Future Outlook
Qualification-ready, electronics-grade nanopowders remain a core whitespace. Advanced node logic below 5 nm and advanced packaging flows reward suppliers that can show low metals contamination, controlled agglomeration behavior, and stable lot-to-lot dielectric performance across titanium dioxide, hafnium oxide, and alumina families. Public funding programs supporting semiconductor manufacturing in North America (including CHIPS-related allocations referenced in industry procurement) keep material down-selection and vendor qualification active, creating room for suppliers that pair particle engineering with documentation packages aligned to nanoform registration and customer audit needs.
Green and bio-based synthesis also represents a near-term commercialization opportunity where buyers incorporate sustainability scorecards alongside performance, particularly in Europe under REACH nanoform compliance pressure. Pilot-to-industrial translation work continues to reduce barriers, including ongoing 2026 technical emphasis on reproducibility for green versus conventional zinc oxide routes, which helps define scale-up control points (feedstock variability, calcination windows, and PSD control). Demand pull from battery safety and durability improvements further widens openings for nano-alumina and zirconia in separator coatings and solid-state electrolyte prototypes, reinforcing opportunities for suppliers that can provide ultra-high-purity grades alongside co-development support for dispersion, coating, and interface stabilization.
Recent Industry Developments
- April 2026: The US Environmental Protection Agency issued a Significant New Use Rule (SNUR) for mixed metal oxide substances, including cobalt lithium manganese nickel oxide, requiring notification at least 90 days before manufacture or import. The change elevates pre-market planning for battery-material and catalyst-grade oxide nanoforms, which increases the importance of compliance-ready supply documentation and exposure-control measures across the US supply chain.
- February 2025: Matexcel broadened its product portfolio to offer a wider range of metal oxide nanoparticles for sectors including electronics, energy, catalysis, and biomedicine. The expansion supports procurement consolidation by customers seeking multiple oxide families from fewer qualified vendors and increases competitive pressure on niche suppliers that rely on narrow product slates.
- December 2024: American Elements announced an expansion of production facilities tied to gallium, germanium, and antimony product lines, which include related advanced materials such as metal oxides and nanoparticles. Added capacity and capability in adjacent critical-material supply chains strengthens availability for downstream thin-film, electronics, and clean-energy uses where oxide nanopowders are commonly specified as inputs or complementary materials.
Research Methodology Framework and Report Scope
Market Definition and Coverage
This market covers the value of metal oxide nanoparticles sold for use across industrial and commercial applications, counted where the material is supplied in nano-scale form and priced as a nanoparticle grade.
Scope exclusions: We exclude non-nano metal oxides, bulk pigments sold without nano specifications, and downstream finished products where nanoparticles are only an embedded input.
Segmentation Overview
- By Product
- Aluminium Oxide
- Titanium Dioxide
- Silicon Dioxide
- Zinc Oxide
- Magnesium Oxide
- Copper Oxide
- Iron Oxide
- Others (Cerium, Zirconium, etc.)
- By Synthesis Method
- Physical (Mechanical Milling, Vapor Deposition)
- Chemical (Sol-Gel, Precipitation)
- Green / Bio-based
- By End-User Industry
- Electronics and Optics
- Healthcare
- Construction
- Automotive and Transportation
- Personal Care
- Other End-user Industries (Energy and Environment, etc.)
- By Geography
- Asia-Pacific
- China
- India
- Japan
- South Korea
- ASEAN Countries
- Rest of Asia-Pacific
- North America
- United States
- Canada
- Mexico
- Europe
- Germany
- United Kingdom
- France
- Italy
- NORDIC Countries
- Rest of Europe
- South America
- Brazil
- Argentina
- Rest of South America
- Middle East and Africa
- Saudi Arabia
- South Africa
- Rest of Middle-East and Africa
- Asia-Pacific
Data Sources, Market Sizing, and Validation
Desk Research
Desk work starts by framing what is being sold and where it is consumed, and then mapping typical demand pockets such as electronics and optics, healthcare, construction, and personal care. We use public sources such as the USGS for minerals and oxides context, the US Census Bureau and UN Comtrade for trade direction checks, and OECD and World Bank series to anchor regional manufacturing and spending cycles.
To keep assumptions realistic, we also review open technical and safety references such as NIST materials resources, EPA and ECHA chemical guidance pages, and peer reviewed journals that discuss nanoparticle synthesis routes and use patterns. Company filings, investor decks, and reputable press releases help validate capacity additions and application priorities, and a paid company financials and intelligence subscription is used selectively to standardize revenue splits where disclosures are thin. These examples are not exhaustive, and many other public and proprietary references were consulted for collection, cross checks, and clarification.
Primary Interviews and Surveys
Primary work is used to pressure test the desk assumptions on what counts as nanoparticle grade material, typical pricing ranges by oxide type, and how volumes move with end use demand. We speak with a mix of producers, distributors, and downstream users across APAC, EMEA, and the Americas so the model reflects differences in manufacturing intensity, regulatory expectations, and adoption timing.
Distribution of primary research fieldwork respondents
| Company type | Respondent position | Region |
|---|---|---|
| Top tier: 33% | CXOs: 15% | APAC: 42% |
| Mid tier: 52% | Functional/Unit leaders: 26% | EMEA: 32% |
| Smaller Players: 15% | Managers: 59% | Americas: 26% |
Market-Sizing & Forecasting
The core model uses a top-down build where production and trade signals, along with industry output indicators, are used to reconstruct an addressable demand pool for metal oxide nanoparticles by region and then allocate it across major end uses. To make sure the totals do not drift, the outputs are corroborated with selective bottom-up approximations, such as sampled average selling price (ASP) bands by oxide, distributor channel checks, and a limited supplier roll up for high visibility materials.
Inputs are kept practical and market linked, including oxide level demand cues (for example titanium dioxide, zinc oxide, aluminum oxide, and silica nano grades), adoption rates in electronics and optics and personal care formulations, and shifts in synthesis mix between physical, chemical, and green or bio-based routes. Where data gaps appear, we apply conservative ranges that are confirmed in follow up calls, and then adjust only when multiple signals align. Forecasts are built using scenario analysis, where the forward view is tied to regional manufacturing momentum, application adoption curves, and expected ASP progression for higher purity nano grades.
Data Validation & Update Cycle
Validation is done through triangulation across the model, independent demand signals, and what interviewees describe as realistic volume and pricing movement. Outliers are reviewed by checking unit economics, regional splits, and sudden jumps in growth that do not match manufacturing or end use trends, and then the assumptions are revised or re-tested with follow up outreach.
Before sign off, the model goes through multiple analyst review steps so definitions, conversions, and year alignment stay consistent. Reports are refreshed annually, and interim updates are added when material events occur, such as regulation changes or major capacity announcements. Right before delivery, a final pass is run so clients receive the latest updated view with the same definitions and checks applied.
Mordor Intelligence's Metal Oxide Nanoparticles Market Estimate Compared With Other Published Estimates
Published market sizes for metal oxide nanoparticles can look far apart because the boundary is not always the same, even when the title sounds identical. Differences usually come from what is counted as nano grade versus bulk oxide, which oxide set is included, and how fast pricing is assumed to change across the forecast window.
By tracking price bands by oxide and use case, and refreshing them through interview checks, Mordor Intelligence keeps the model focused on nanoparticle grade sales into electronics and optics, healthcare, construction, automotive and transportation, and personal care instead of mixing in broader nano materials or bulk oxide value. The spread also grows when a study uses a different base year, applies aggressive adoption assumptions for new green synthesis routes, or converts currencies using different timing.
Benchmark comparison
| Source | Market Size | Gaps in Research Methodology |
|---|---|---|
| Mordor Intelligence | USD 1.11 B (2026) | |
| Global Consultancy A | USD 1.18 B (2024) | Uses a different base year and sizing window, and the scope description leans on a broad 1-100 nm definition that can pull in sales that are not consistently priced or specified as nanoparticle grade across regions. |
| Industry Publisher B | USD 1.60 B (2024) | Reports a higher 2024 value that likely reflects wider inclusion of adjacent nano materials or extended application mapping, and the page-level scope detail is thinner on exclusions, which can inflate totals when bulk oxides or non-standard grades are blended in. |
Looking across the three numbers, most of the gap is explained by year alignment and what is treated as in-scope nano grade material, not by a single math step. When the model is tied back to clear oxide types, end use demand signals, and practical ASP ranges that are rechecked, the final total becomes easier to replicate and easier to audit.
Key Questions Answered in the Report
What is the current Metal Oxide Nanoparticles Market size?
The Metal Oxide Nanoparticles Market stands at USD 1.11 billion in 2026 and is projected to reach USD 1.54 billion by 2031 at a 6.74% CAGR.
Which product segment dominates the Metal oxide nanoparticles market?
Titanium Dioxide leads, holding 38.20% share in 2025.
Which region shows fastest growth in the Metal oxide nanoparticles market?
Asia-Pacific grows at 7.55% CAGR due to concentrated semiconductor fabrication and supportive government incentives.
How do metal oxide nanoparticles enhance lithium-ion batteries?
They improve cathode conductivity, stabilise solid-state electrolytes and mitigate anode volume expansion, boosting safety and energy density.