
Metagenomics Market Size and Share
Market Overview
| Study Period | 2020 - 2031 |
|---|---|
| Market Size (2026) | USD 3.76 Billion |
| Market Size (2031) | USD 7.41 Billion |
| Growth Rate (2026 - 2031) | 14.57 % |
| Fastest Growing Market | Asia Pacific |
| Largest Market | North America |
| Market Concentration | Medium |
Major Players *Disclaimer: Major Players sorted in no particular order Image © Mordor Intelligence. Reuse requires attribution under CC BY 4.0. | |
Metagenomics Market Analysis by Mordor Intelligence
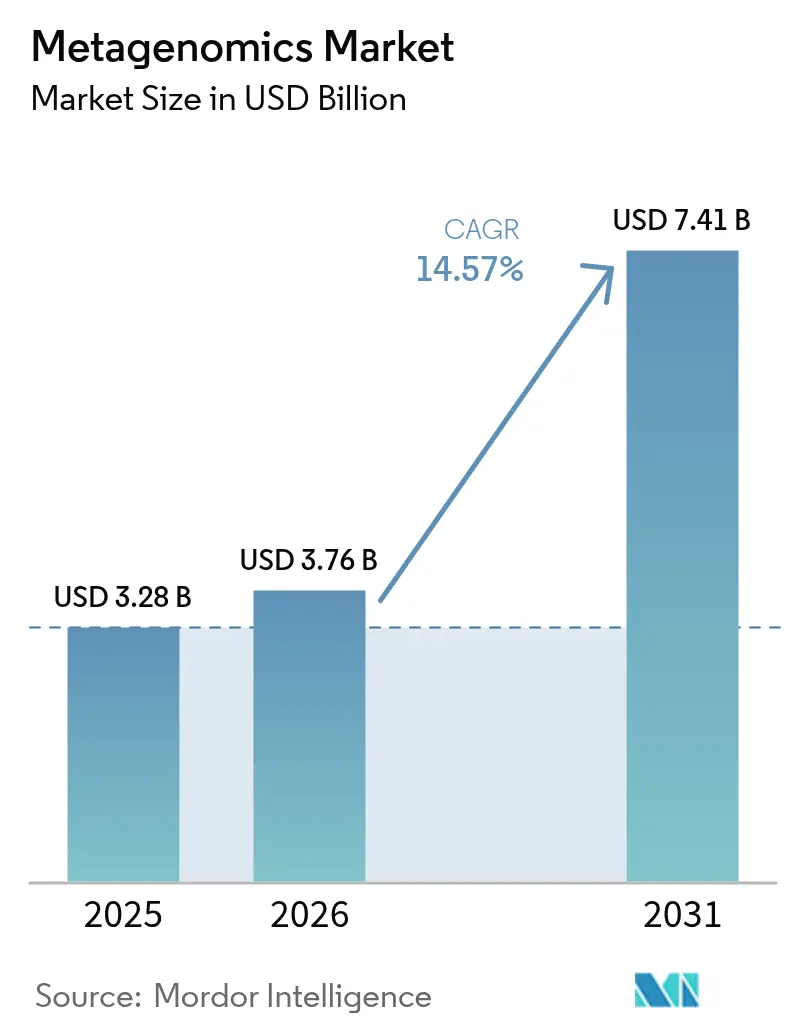
Metagenomics market size in 2026 is estimated at USD 3.76 billion, growing from 2025 value of USD 3.28 billion with 2031 projections showing USD 7.41 billion, growing at 14.57% CAGR over 2026-2031. Rising integration of artificial intelligence (AI) with sequencing platforms shortens pathogen identification time from days to hours, transforming the metagenomics market from research‐focused to clinically indispensable. Rapid cost compression—whole-genome sequencing prices fell from USD 100 million in 2001 to about USD 500 in 2023, which was the result of routine clinical and environmental use cases. North America maintains leadership, yet Asia Pacific records the quickest uptake as governments underwrite national microbiome programs and harmonize regulations. Product dynamics also evolve: kits & reagents retain the most significant slice of spending while outsourcing-driven services expand faster, mirroring the shortage of in-house bioinformatics talent. Competitive pressure is intensifying because AI-native entrants and USD 100-per-genome technology threaten incumbent pricing power.
Key Report Takeaways
- By product category, kits & reagents held 44.60% of the metagenomics market share in 2025, whereas sequencing & data analytics services are forecast to advance at an 17.85% CAGR through 2031.
- By technology class, sequencing-driven workflows captured a 62.10% share of the metagenomics market in 2025, while third-generation long-read sequencing is projected to rise at an 20.90% CAGR.
- By application, human health commanded 57.60% of the metagenomics market share in 2025; environmental monitoring and bioremediation are predicted to grow at a 23.20% CAGR to 2031.
- By end user, academic and research institutes accounted for 40.90% of the metagenomics market size in 2025, but clinical diagnostic laboratories showed the fastest 16.60% CAGR.
- Geographically, North America represented 46.20% of 2025 revenue, while Asia Pacific is on track for a 16.20% CAGR to 2031.
Note: Market size and forecast figures in this report are generated using Mordor Intelligence’s proprietary estimation framework, updated with the latest available data and insights as of 2026.
Market Trends and Insights
Drivers Impact Analysis of Metagenomics Market*
| Driver | (~) % Impact on CAGR Forecast | Geographic Relevance | Impact Timeline |
|---|---|---|---|
| Increasing R&D expenditure in metagenomics | +3.20% | Global; strongest in North America & EU | Medium term (2-4 years) |
| Declining cost of high-throughput sequencing | +4.10% | Global, accelerated adoption in APAC | Short term (≤ 2 years) |
| Continuous improvements in library-prep & bioinformatics pipelines | +2.80% | North America & EU leading; APAC following | Medium term (2-4 years) |
| Emergence of ultra-long-read sequencing enabling strain-level insights | +2.30% | Global research hubs, clinical labs in developed markets | Long term (≥ 4 years) |
| AI-powered point-of-care infectious-disease metagenomics platforms | +1.90% | North America & EU, expanding to APAC | Medium term (2-4 years) |
| National microbiome data-commons initiatives | +1.40% | United States, EU, China | Long term (≥ 4 years) |
| Source: Mordor Intelligence | |||
Increasing R&D Expenditure in Metagenomics
Pharmaceutical and biotechnology enterprises amplify metagenomics investments because microbial targets increasingly underpin novel drug discovery programs. Thermo Fisher Scientific earmarked USD 40-50 billion for acquisitions that strengthen metagenomics-adjacent capabilities, signaling boardroom conviction that next-generation therapeutics demand microbiome-centric data. The NIH’s Human Virome Program directs roughly USD 2.5 million toward 2026 tool development, fostering academic-industry alliances that accelerate clinical translation.[1]National Institutes of Health, “Human Virome Program Funding Opportunity,” nih.govGovernment grants such as the NSF Ecology and Evolution of Infectious Diseases initiative, with a USD 32 million budget for FY 2025, encourage multidisciplinary research linking metagenomics with computational modeling.[2]National Science Foundation, “Ecology and Evolution of Infectious Diseases,” nsf.gov
Declining Cost of High-Throughput Sequencing
Whole-genome sequencing prices plunged to USD 600 in 2024, unlocking widespread clinical deployment. Ultima Genomics further disrupted norms by achieving a USD 100 genome at Q60 accuracy, forcing incumbents to compress margins and accelerate product cycles.[3]Edward Dutka, “Q60 Accuracy at USD 100 per Genome,” science.org Additional price cuts, such as the University of Minnesota’s Element AVITI platform, now position next-generation sequencing below Illumina’s flagship NovaSeq for comparable throughput. Budgetary shifts away from capital equipment toward bioinformatics expertise reshape laboratory cost structures.
Continuous Improvements in Library-Prep & Bioinformatics Pipelines
Pipeline automation reduces hands-on time and contamination risk, enabling routine diagnostics in non-specialist settings. QIAGEN’s Digital Insights unit integrates AI-driven analytics that compress turnaround from days to hours. Illumina’s DRAGEN metagenomics workflow leverages NVIDIA GPUs for real-time computation. Machine-learning models achieve 93.6% sensitivity and 93.8% specificity in respiratory-virus detection, outperforming RT-PCR.
Emergence of Ultra-Long-Read Sequencing Enabling Strain-Level Insights
Oxford Nanopore Technologies and Pacific Biosciences deliver reads long enough to assemble complete microbial genomes, revealing structural variants and resistance genes that short-read methods overlook. Strain-level resolution enhances outbreak investigation, antimicrobial stewardship, and pollution source tracking.
Restraints Impact Analysis of Metagenomics Market*
| Restraint | (~) % Impact on CAGR Forecast | Geographic Relevance | Impact Timeline |
|---|---|---|---|
| High Overall Cost Of Comprehensive Metagenomic Workflows | -2.80% | Global, particularly impacting emerging markets | Short term (≤ 2 years) |
| Shortage Of Skilled Bioinformaticians For Data Interpretation | -1.90% | Global, acute in APAC and emerging markets | Medium term (2-4 years) |
| Data-Privacy & Ethical Concerns Over Incidental Human Genomic Findings | -1.50% | EU & North America primarily, expanding globally | Medium term (2-4 years) |
| Export-Control Risks Disrupting Enzyme & Reagent Supply Chains | -1.20% | Global supply chains, acute impact on China-US trade | Short term (≤ 2 years) |
| Source: Mordor Intelligence | |||
High Overall Cost of Comprehensive Metagenomic Workflows
Although sequencing itself is cheaper, total ownership costs remain high once computational infrastructure, storage, and accreditation are included. A Pentagon pilot concluded that daily metagenomic biosurveillance remains 10-100 times too costly for routine use unless sample pooling and virtualization mature further. Low- and middle-income regions pay up to USD 4,500 per genome because logistics and customs fees inflate consumable prices.
Shortage of Skilled Bioinformaticians for Data Interpretation
Global demand for specialists who can translate petabyte-scale data into clinical guidance outstrips supply. Most university programs still focus on wet-lab microbiology or general computer science, leaving a training gap in applied metagenomics. Smaller clinics struggle to recruit talent, driving demand for managed-service providers and cloud analysis portals, yet quality-control steps still require human oversight.
*Our forecasts treat driver/restraint impacts as directional, not additive. The impact forecasts reflect baseline growth, mix effects, and variable interactions.
Metagenomics Market Segment Analysis
By Product:
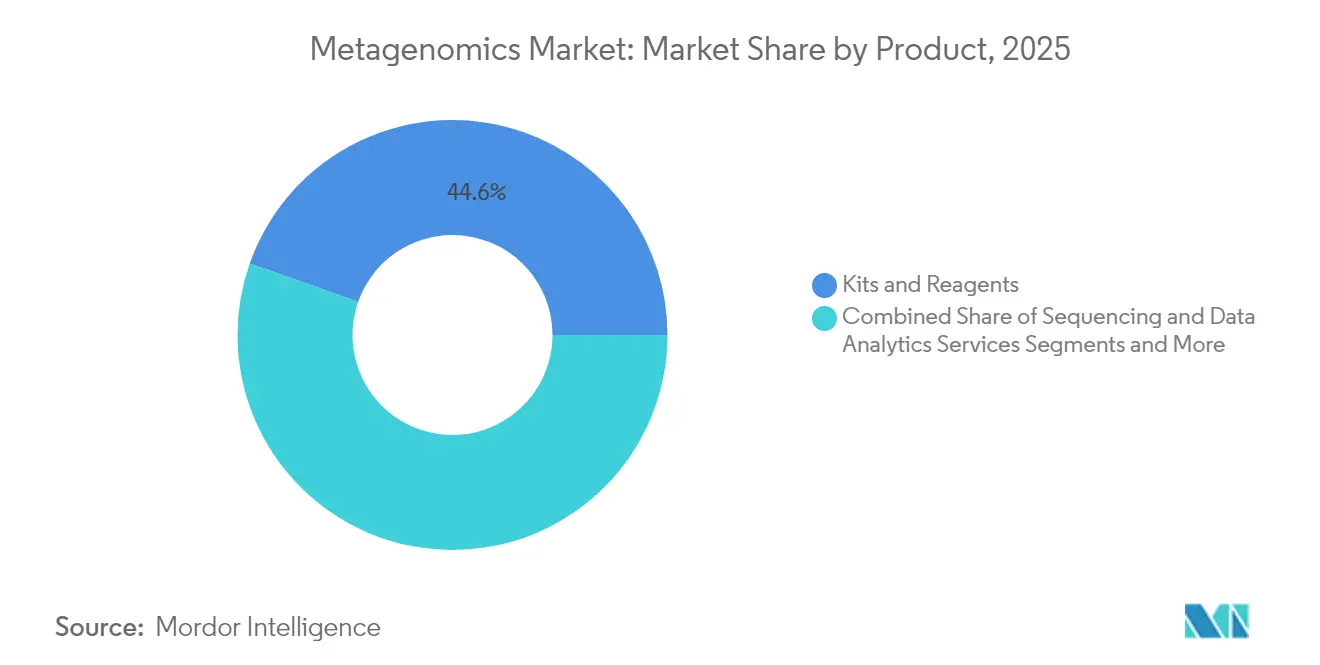
Services Surge Despite Reagents DominanceKits & reagents retained 44.60% of 2025 revenue because every sequencing run consumes standardized consumables that ensure reproducible results. However, sequencing & data analytics services are scaling at an 17.85% CAGR, reflecting laboratories’ preference to outsource compute-intensive steps to specialized providers. The metagenomics market size for services is projected to increase more than threefold by 2031. Instruments & consumables maintain steady replacement demand, whereas cloud-delivered software pipelines lower barriers for resource-constrained facilities.
Outsourcing momentum intensifies as regulators demand auditable pipelines that small laboratories rarely build in-house. QIAGEN’s Digital Insights partnership with major cloud vendors illustrates how service ecosystems capture recurring fees, while Novogene’s high-throughput model offers competitive pricing tiers for academic consortia. This combination of compliance burden and bioinformatics talent shortage should sustain double-digit growth for managed services over the forecast horizon.


By Technology:
Third Generation Disrupts Short-Read DominanceSequencing-driven workflows represented 62.10% of the metagenomics market share in 2025, yet third-generation long-read platforms are expanding at 20.90% CAGR. Long reads assemble complete microbial genomes, reveal plasmid-borne resistance genes, and quantify epigenetic modifications in real time. Function-driven protocols remain niche but essential for bioprocess optimization, while amplicon-based approaches persist in cost-sensitive surveillance. The metagenomics market size for long-read applications should surpass USD 2.28 billion by 2031, catalyzed by hospital infection-control programs and large-scale environmental projects.
Real-time nanopore sequencing enables field-deployable diagnostics at border checkpoints and remote farms. Researchers combining long-read DNA and RNA sequencing now correlate active gene expression with genomic context, a capability expected to unlock new anti-infective targets. Meanwhile, platform vendors seek standards harmonization so that hybrid assemblies merge the depth of short reads with the context of long ones.
By Application:
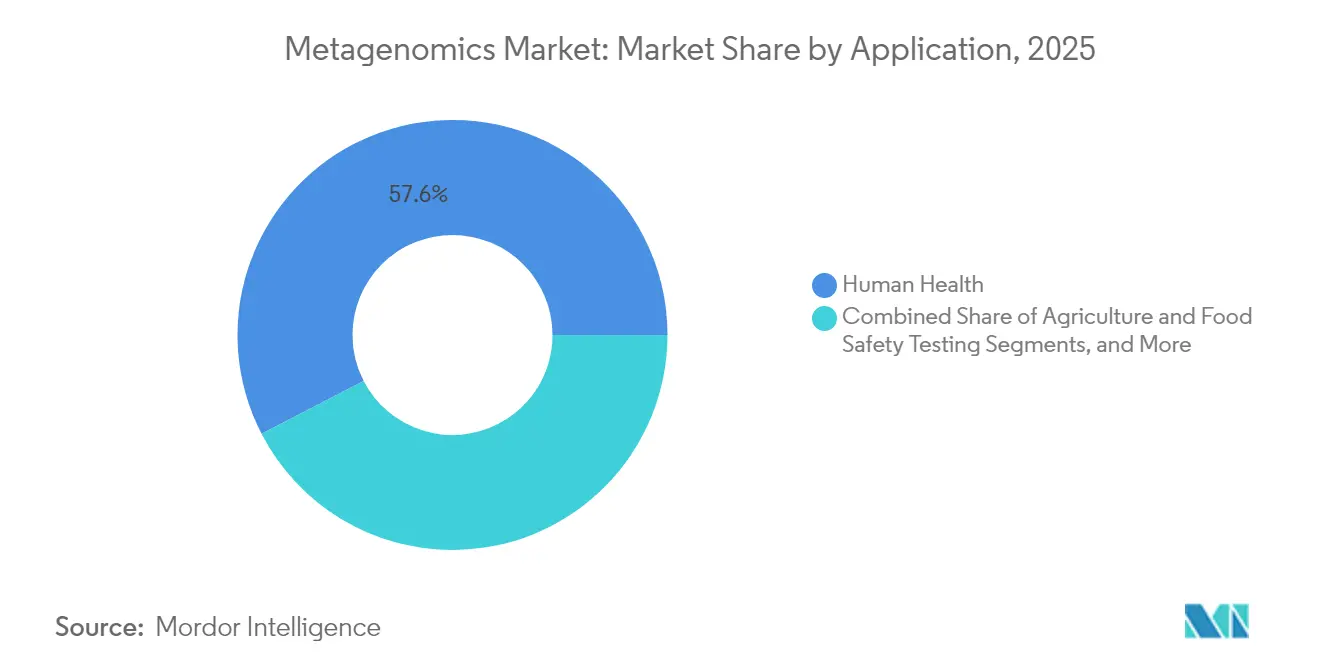
Environmental Monitoring Accelerates Beyond HealthcareHuman health remains the largest application, accounting for 57.60% of 2025 revenue, as clinical diagnostics and pharmaceutical discovery rely on high-resolution microbiome data. Yet environmental monitoring and bioremediation are growing fastest at 23.20% CAGR, underpinned by climate adaptation mandates and corporate net-zero commitments. From oil spill cleanup to wastewater surveillance, governments and multinationals increasingly pay for microbial community profiling instead of chemical assays. The metagenomics market size for environmental deployments is forecast to quadruple by 2031.
Rapid microbiome assays also benefit crop-yield optimization and food authenticity testing, reducing recall risk and improving traceability. In clinical settings, metagenomic antimicrobial-resistance surveillance guides stewardship policies, reducing broad-spectrum antibiotic use in tertiary hospitals by measured margins.
By End User:
Clinical Labs Transition from Research ToolsAcademic and research institutions accounted for 40.90% of 2025 spending, showcasing metagenomics’ academic roots. Clinical diagnostic laboratories, however, are growing at 16.60% CAGR as the FDA clarifies laboratory-developed test requirements and payers introduce reimbursement codes. If reimbursement uptake remains on track, the metagenomics market size for clinical labs will likely overtake academic demand before 2031. Pharmaceutical and biotechnology firms continue to integrate microbiome data into target-discovery pipelines, ensuring sustained demand for high-throughput sequencing.
Contract research organizations (CROs) benefit from smaller biotech clients that outsource end-to-end projects, including wet-lab work, bioinformatics, and regulatory documentation. Environmental and food-testing labs expand metagenomic capacity to comply with stricter pathogen-monitoring rules in North America and the European Union.
Geography Analysis
North America Metagenomics Market
North America controlled 46.20% of global revenue in 2025 due to established sequencing infrastructure, dense biotech clusters, and favorable reimbursement. Federal projects such as the NIH All of Us Research Program continue to channel funding into microbiome-heavy protocols, sustaining domestic demand. Canada’s Precision Health Initiative further bolsters regional sequencing volumes.
Europe Metagenomics Market
Europe maintains a robust position, benefiting from the Horizon Europe funding stream and the European Medicines Agency’s supportive stance on real-world microbiome data. Cross-border clinical trials increasingly incorporate metagenomic endpoints, encouraging standardized data pipelines across European reference labs. The region also houses several leading bioinformatics software vendors that export platforms globally.
APAC, EMEA and South America Metagenomics Market
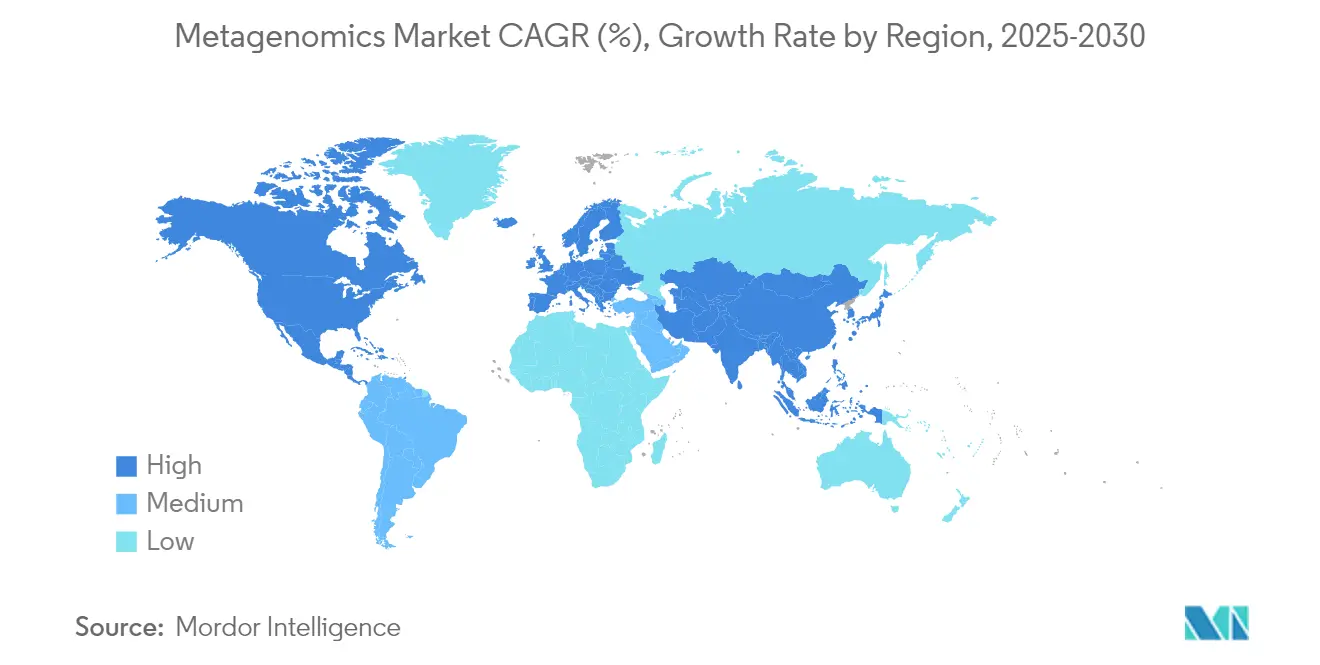
Asia Pacific represents the fastest-growing geography at 16.20% CAGR through 2031. China’s National GeneBank expansion and India’s Genome India initiative exemplify government-funded programs that aim to leapfrog legacy infrastructure. Domestic players such as BGI leverage cost-efficient platforms like DNBSEQ-T7 to drive local adoption while exporting solutions to Africa and Latin America. Singapore and South Korea invest heavily in AI-enabled precision medicine pilots, positioning the broader region as a testbed for end-to-end metagenomics ecosystems. The Middle East and Africa show nascent but rising interest as public-health agencies embrace wastewater surveillance for early outbreak alerts—South America partners with European labs to transfer protocols and build local talent pipelines.

Regulatory Landscape
Regulation for metagenomics is moving toward clearer standards for sample handling, sequencing, and bioinformatics validation as the field expands from research into clinical diagnostics and public health. ISO 20397-3:2025, published in July 2025, provides an international reference for massively parallel sequencing based metagenomics workflows, while China implemented GB/T 46205-2025 in February 2026 to define national requirements for metagenomic data processing and preparation. In the European Union, Regulation (EU) 2024/1938 on substances of human origin entered into force in August 2024 (full application starting 7 August 2027), tightening harmonized safety and quality expectations for human-origin materials relevant to microbiome and metagenomic studies.
Regulators are also updating expectations for how next-generation sequencing data are generated and submitted in regulated settings. The US FDA issued final guidance in July 2026 for submitting next-generation sequencing data to the Division of Antiviral Products, and it opened a public comment period in June 2026 (through 14 July 2026) for draft guidance on using next-generation sequencing in the safety assessment of genome editing in human gene therapy products. In Europe, the EMA launched a public consultation in March 2026 (until 30 April 2026) on a concept paper for non-clinical development and evaluation of microbiome-based medicinal products, reflecting an increased emphasis on standardized evidence packages that link wet-lab methods to auditable bioinformatics outputs.
Competitive Landscape
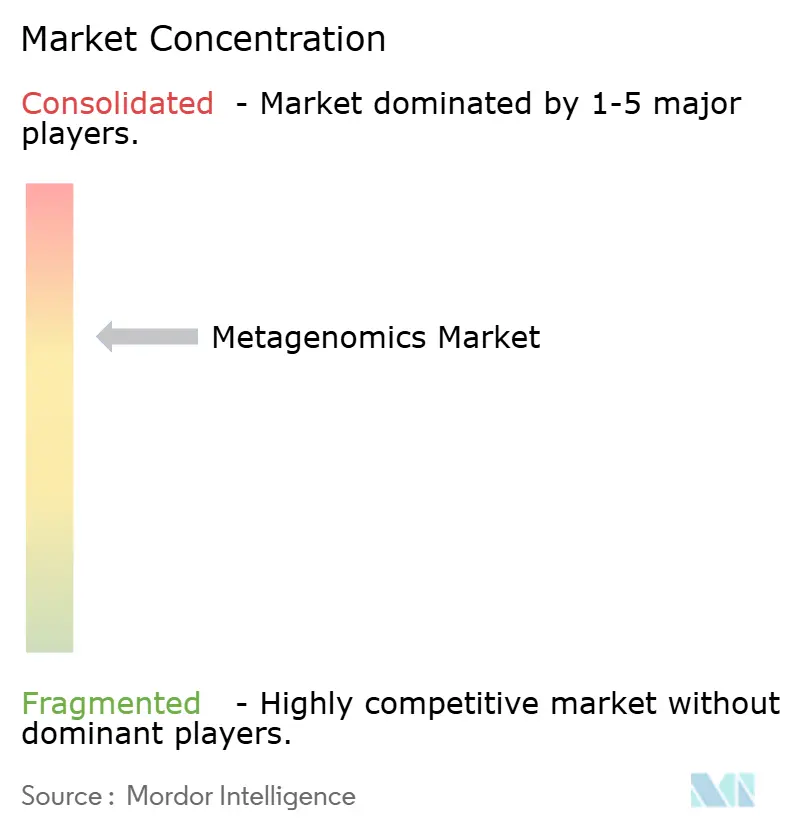
The metagenomics market shows moderate concentration as Illumina holds roughly 80% of DNA-sequencing revenue, yet that dominance faces erosion from AI-native newcomers and ultra-low-cost chemistry. Incumbents pursue vertical integration, with Thermo Fisher Scientific spending more than USD 4 billion annually on acquisitions that connect sample prep, analytics software, and cloud delivery. QIAGEN doubles down on Digital Insights subscriptions to shift its revenue mix toward recurring data services.
Disruptors such as Ultima Genomics slash per-genome prices, compelling incumbents to re-align innovation roadmaps. Oxford Nanopore’s portable sequencers and Pacific Biosciences’ HiFi reads offer accuracy that now rivals short-read benchmarks, broadening clinical acceptance. AI is rapidly turning into the key differentiator, as illustrated by Karius, whose FDA-designated breakthrough test outperforms standard respiratory panels by scanning for thousands of pathogens simultaneously.
Partnership ecosystems are expanding. Illumina teamed with NVIDIA to accelerate multiomic AI pipelines, while bioMérieux collaborates with Illumina for bacterial outbreak surveillance in public-health labs. QIAGEN’s alliance with McGill University focuses on protocols for low-biomass samples, underscoring how suppliers depend on academic centers for validation studies. Service providers like Novogene and Element Biosciences undercut equipment-based models by selling sequencing-as-a-service with transparent pricing, appealing to smaller entities that cannot justify capital purchases.
Metagenomics Industry Leaders
Illumina, Inc
PerkinElmer Inc.
QIAGEN N.V.
F. Hoffmann-La Roche Ltd
Novogene Co., Ltd
- *Disclaimer: Major Players sorted in no particular order
Metagenomics Market Companies Covered in this Report
- Illumina
- Thermo Fisher Scientific
- QIAGEN
- Roche
- BGI
- Novogene Co., Ltd.
- PerkinElmer
- Eurofins
- Oxford Nanopore Technologies plc
- Pacific Bioscience
- Agilent Technologies
- Bio-Rad Laboratories
- Promega
- Merck
- Takara Bio
- Zymo Research
- Genewiz (Azenta Life Sciences)
- CosmosID Inc.
- Genscript Biotech Corporation
- Brooks Life Sciences (Cell & Gene Solutions)

Market Opportunities and Future Outlook
Clinical-grade metagenomics is creating whitespace for platforms and workflows that reduce reliance on culture and speed interpretation, particularly where time-to-answer shapes clinical decision-making. In July 2026, Bruker acquired Noscendo GmbH's DISQVER metagenomic sequencing platform to add whole-genome sequencing based pathogen detection from blood samples without prior cultivation, reinforcing demand for integrated sample-to-result offerings that combine wet-lab workflows with validated analysis. Capacity build-out is also supporting clinical adoption, with Juno Bio opening a CLIA-certified sequencing lab in Oakland, California in July 2026 to scale clinical vaginal microbiome testing.
Standardization and public-sector programs are strengthening procurement and implementation pathways for metagenomics tools in surveillance and food safety. China’s GB/T 46205-2025 implementation (February 2026) formalizes requirements for processing and analyzing metagenomic data, supporting broader deployment of compliant software, pipelines, and services. In food safety, the Joint FAO/WHO Expert Meeting (JEMRA) convened in March 2026 to integrate omics-based technologies, including metagenomics, into Codex Alimentarius aligned microbiological risk assessment, expanding use cases for routine monitoring beyond human health. For biosurveillance, the Johns Hopkins Center for Health Security published the MetaBridge report in May 2026 outlining requirements for 24-hour turnaround metagenomic surveillance systems, sharpening focus on automation, high-throughput sample handling, and scalable analytics services that can operate under public health timelines.
Recent Industry Developments in Metagenomics Market
- April 2026: QIAGEN introduced its QIAGEN Discovery Platform, positioned as an AI-grounded environment that connects biological knowledge, omics data, and analytics for complex oncology research workflows. By tightening integration between data, curation, and interpretation, it supports the shift toward managed analytics layers that metagenomics users adopt when in-house bioinformatics capacity is limited.
- March 2026: Illumina expanded the Alliance for Genomic Discovery with Regeneron Genetics Center membership and added a new 50,000 whole-genome dataset paired with proteomic data. The combination of large-scale genomic and proteomic resources strengthens multiomic discovery pipelines that feed microbiome and metagenomics driven target identification and biomarker work.
- December 2024: QIAGEN released an AI-enabled extension for Ingenuity Pathway Analysis to automate insight generation from complex datasets. This development increased throughput for downstream biological interpretation, a key bottleneck in metagenomics studies where high dimensional outputs require rapid, reproducible translation into actionable findings.


Metagenomics Market Report Scope and Research Methodology
Market Definition and Coverage
This market covers revenues generated from metagenomics tools and services used to study mixed microbial communities directly from samples, without isolating organisms first. It includes lab products, sequencing runs, and analysis services sold for clinical, environmental, industrial, and agricultural use cases.
Scope exclusions: We exclude custom, non-commercial bioinformatics software built under academic grants when it is not sold as an open-market product or service.
Segments Covered in This Report
- By Product
- Sequencing & Data Analytics Services
- Kits & Reagents
- Instruments & Consumables
- Software & Pipeline Tools
- Others
- By Technology
- Sequencing-Driven Metagenomics
- Function-Driven Metagenomics
- Third-Generation Long-Read Sequencing
- Amplicon-Based Targeted Sequencing
- Metatranscriptomics
- By Application
- Human Health
- Environmental Monitoring & Bioremediation
- Agriculture & Food Safety Testing
- Others
- By End-User
- Academic & Research Institutes
- Pharmaceutical & Biotechnology Companies
- Clinical Diagnostic Laboratories
- Environmental & Food Testing Labs
- CROs & Service Providers
- By Geography
- North America
- United States
- Canada
- Mexico
- Europe
- Germany
- United Kingdom
- France
- Italy
- Spain
- Rest of Europe
- Asia Pacific
- China
- Japan
- India
- South Korea
- Australia
- Rest of Asia Pacific
- Middle East and Africa
- GCC
- South Africa
- Rest of Middle East and Africa
- South America
- Brazil
- Argentina
- Rest of South America
- North America
Data Sources, Market Sizing, and Validation
Desk Research
Desk work started by mapping the metagenomics workflow, then identifying where revenue is actually booked across a calendar year, before turning it into a sizing model. We used public sources such as the NIH, NCBI, CDC, and the US FDA for signals on funding intensity, pathogen surveillance focus, and validation requirements that can influence testing volumes and technology choice.
We also reviewed sources such as OECD, World Bank, and customs trade statistics to understand lab activity proxies, instrument import trends, and regional research capacity, then cross-checked these against peer-reviewed journals that report shifts between 16S and shotgun approaches. On the commercial side, we reviewed company annual reports, investor decks, press releases, and product catalogs to confirm product mix and typical pricing logic, then supported the work with a paid subscription for company financials and a paid patent database to track where innovation and launches are clustering. These desk sources are illustrative only, and other public and paid references were also used for data collection, validation, and clarification.
Primary Interviews and Surveys
Primary interviews and surveys were used to test the desk assumptions on what buyers actually purchase, how often sequencing runs are repeated, and how pricing changes by sample type and throughput. We spoke with kit and instrument stakeholders, service labs, informatics specialists, and end users in research and applied testing. We balanced coverage across key demand regions so regional adoption differences could be reflected in the final model.
Distribution of primary research fieldwork respondents
| Company type | Respondent position | Region |
|---|---|---|
| Top tier: 38% | CXOs: 16% | APAC: 42% |
| Mid tier: 44% | Functional/Unit leaders: 31% | EMEA: 32% |
| Smaller Players: 18% | Managers: 53% | Americas: 26% |
Market-Sizing & Forecasting
Our core sizing logic starts with a top-down build that reconstructs demand from the metagenomics workflow, where sample processing activity and sequencing adoption are translated into annual spending across kits, consumables, instruments, sequencing services, and data analytics. Those totals are then corroborated using selective bottom-up checks, mainly by rolling up a sampled set of supplier revenues, channel feedback on run volumes, and typical ASP times volume math for common kit types and service packages.
Key inputs used in the model include the mix shift between 16S and shotgun sequencing, average reads and depth requirements by application, utilization patterns at service labs, replacement and upgrade cycles for sequencing-related equipment, and regional research and surveillance intensity that changes purchasing frequency. Where direct volume signals were thin in smaller countries, we filled gaps using proxy indicators such as lab infrastructure expansion and research output trends, and then validated the implied spend per active site with interview feedback.
For forecasting, we used scenario analysis to reflect different adoption speeds in clinical and environmental monitoring, then applied smoothening with short-horizon time series checks for variables like pricing drift and service capacity. ASP progression and run density assumptions were revisited by region so a single global price curve did not overstate growth where budgets are tightening.
Data Validation & Update Cycle
Validation was done through repeated cross-checks between model outputs and independent demand signals, including public funding direction, surveillance priorities, and visible product and service launch activity. When a region showed a sudden step-change, we rechecked unit assumptions, currency conversion timing, and whether procurement cycles were truly recurring.
Before sign-off, the work goes through multi-step internal reviews where calculations, assumptions, and year-over-year growth patterns are checked for variance and consistency, and follow-up calls are triggered when gaps remain. Reports are refreshed annually, and interim updates are made when material events occur, followed by a final pre-delivery review so clients receive the latest view available.
Mordor Intelligence's Metagenomics Market Size Measured Against Other Published Estimates
Published metagenomics market values often vary because firms do not always count the same revenue lines, and choices for base year and currency can shift results up or down. Differences also show up when one estimate relies more on shipped instruments, while another emphasizes recurring kits, sequencing runs, and paid analytics.
In our checks, the largest gaps usually come from whether sequencing and data analytics services are included as full market revenue, and whether non-commercial software activity is treated as paid market scope. Some sources assume a faster ramp in clinical adoption without validating run frequency and repeat testing, which can inflate near-term totals. Others use older price points even as reagent pricing and service bundle discounts evolve. The spread is also influenced by how calendar-year invoiced sales are handled across regions and by how often the model is refreshed, which is why the open-market sales-only treatment, including sequencing and analytics services but excluding non-commercial grant software, explains the difference most clearly near the end of the chain for Mordor Intelligence.
Benchmark comparison
| Source | Market Size | Gaps in Research Methodology |
|---|---|---|
| Mordor Intelligence | USD 3.76 B (2026) | |
| Trade Journal A | USD 2.68 B (2025) | Uses a prior-year base and may apply a narrower realized revenue capture for services, and it can also mix workflow-stage counts with market revenue without consistently anchoring to invoiced calendar-year sales. |
| Industry Publisher B | USD 2.80 B (2025) | Often groups the market by offering buckets (consumables, instruments, software) but does not clearly state how sequencing and data analytics services are treated, and growth can be driven by assumed clinical uptake rather than validated run frequency and pricing drift. |
Overall, the differences mostly come down to what is counted as paid metagenomics revenue and how base-year pricing and run activity are translated into dollars. By keeping the model tied to repeatable variables such as workflow volumes, mix shift, and calendar-year invoicing, the final number stays traceable even when individual assumptions are adjusted.


Key Questions Answered in the Report
What is the current size of the metagenomics market?
The metagenomics market stands at USD 3.76 billion in 2026 and is forecast to reach USD 7.41 billion by 2031.
Which region is growing fastest in the metagenomics market?
Asia Pacific is expanding at a 16.20% CAGR as national genomics programs stimulate infrastructure and regulatory alignment.
Why are sequencing & data-analytics services growing so rapidly?
Laboratories increasingly outsource bioinformatics because talent shortages and compliance requirements make in-house pipelines costly; the services segment is advancing at an 17.85% CAGR.
How does long-read sequencing differ from traditional short-read methods?
Long-read platforms assemble complete microbial genomes and detect structural variants in real time, driving a 20.90% CAGR for third-generation sequencing applications.
What are the main restraints facing the metagenomics industry?
High total workflow costs and a global shortage of bioinformaticians are the top barriers, together suppressing CAGR growth by about 4.7 percentage points.
Which company currently dominates DNA-sequencing revenue?
Illumina controls around 80% of global DNA-sequencing revenue but faces emerging competition from cost-disruptive and AI-native newcomers.
Page last updated on:


 Your data is secure and never sold or shared.


