
Menstrual Health Apps Market Size and Share
Market Overview
| Study Period | 2020 - 2031 |
|---|---|
| Market Size (2026) | USD 1.60 Billion |
| Market Size (2031) | USD 2.52 Billion |
| Growth Rate (2026 - 2031) | 9.51 % |
| Fastest Growing Market | Asia-Pacific |
| Largest Market | North America |
| Market Concentration | Medium |
Major Players *Disclaimer: Major Players sorted in no particular order Image © Mordor Intelligence. Reuse requires attribution under CC BY 4.0. | |
Menstrual Health Apps Market Analysis by Mordor Intelligence
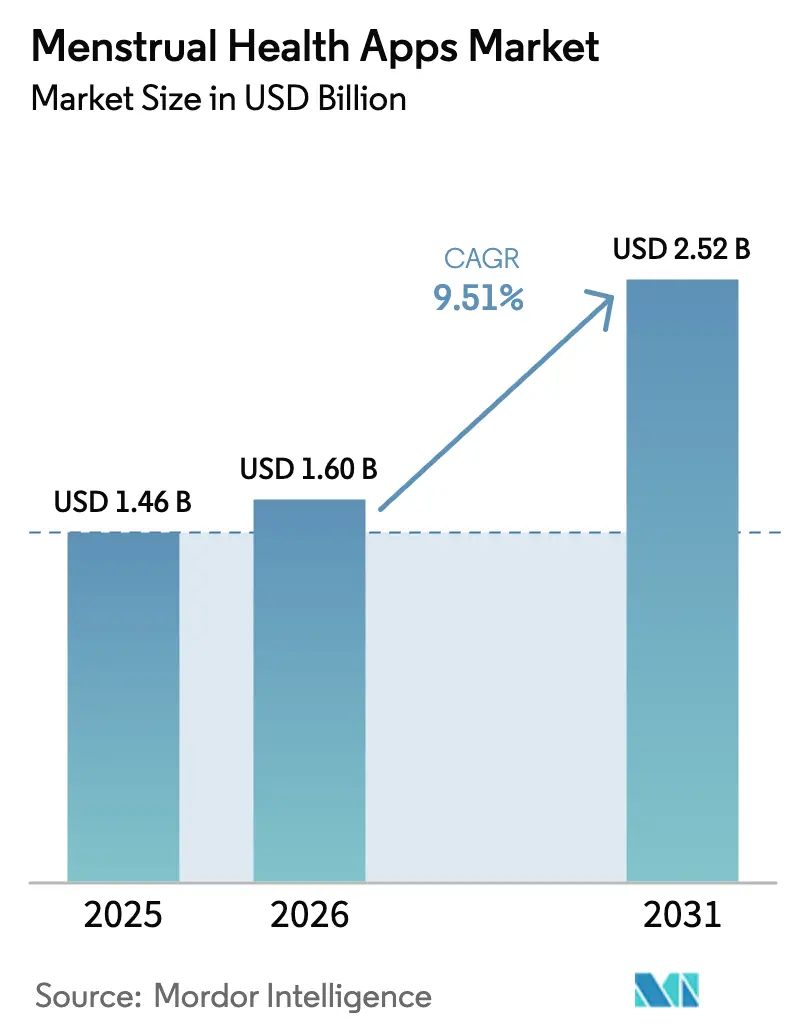
The menstrual health apps market size is expected to grow from USD 1.46 billion in 2025 to USD 1.60 billion in 2026 and is forecast to reach USD 2.52 billion by 2031 at 9.51% CAGR over 2026-2031. Intensifying smartphone adoption, regulatory acceptance of algorithm-based fertility tracking, and employer-sponsored reproductive-health benefits are combining to shift personal cycle data from clinic files to consumer-controlled apps, expanding the menstrual health apps market far beyond its early-adopter base. Venture funding signals durable confidence: Flo Health’s July 2024 Series C valued the company above USD 1 billion, while Maven Clinic closed a USD 125 million Series F at a USD 1.7 billion valuation in October 2024. Hardware integration is another structural tailwind, with Apple Watch wrist-temperature sensors feeding retrospective ovulation estimates straight into Cycle Tracking, lowering input friction and pulling high-income users deeper into the menstrual health apps market. Meanwhile, Karnataka’s 2025 law granting 12 annual paid menstrual-leave days without medical certification is encouraging Indian employers to provide app subscriptions so that HR teams can audit leave utilization, a policy model likely to disperse through Asia Pacific and stimulate further market penetration.
Key Report Takeaways
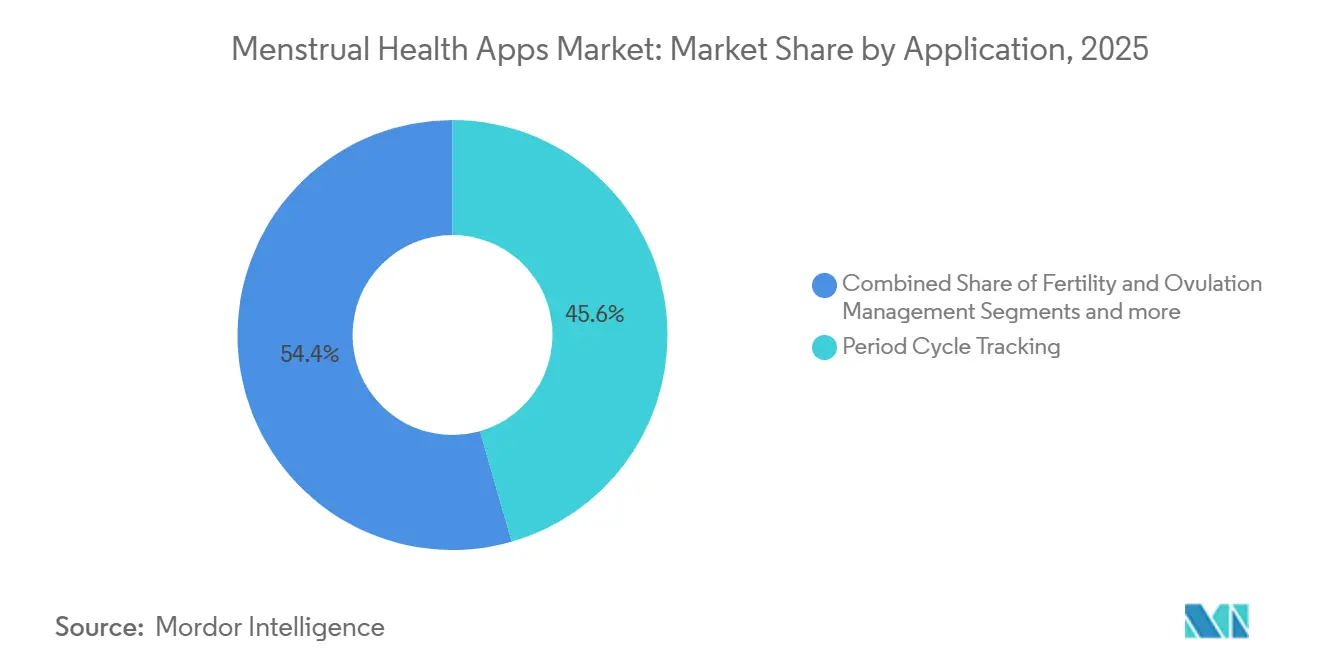
- By application, Period Cycle Tracking led with 45.56% of the menstrual health apps market share in 2025.
- By platform, Android commanded 57.61% of the menstrual health apps market size in 2025.
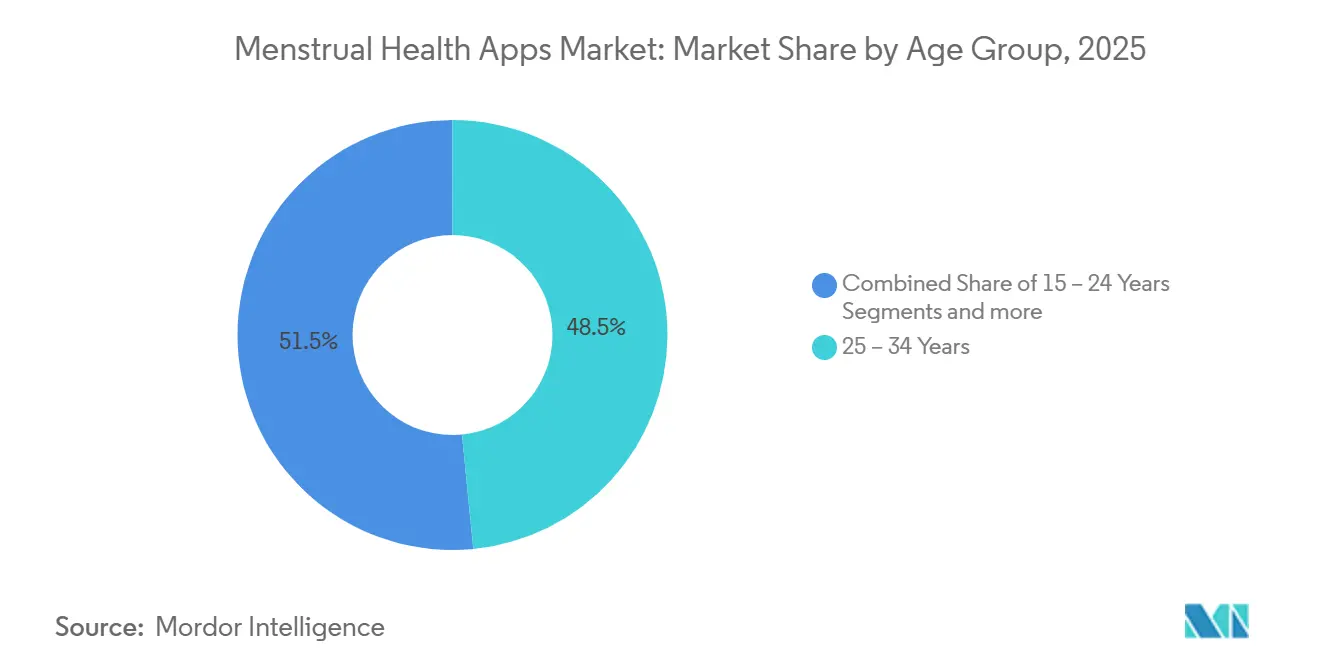
- By age group, the 25–34 segment accounted for 48.47% of users in 2025, while the 15–24 cohort is advancing at a 10.49% CAGR through 2031.
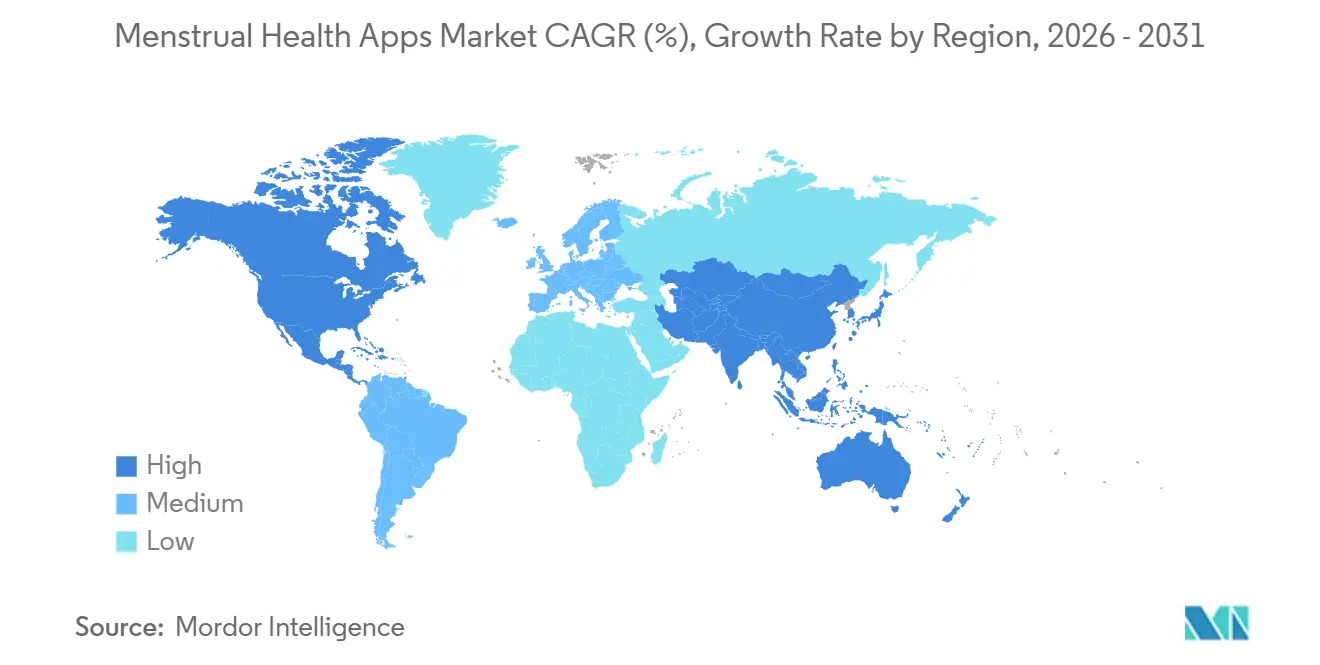
- By geography, North America held 42.12% of the menstrual health apps market size in 2025; Asia-Pacific is growing fastest at a 10.59% CAGR toward 2031.
Note: Market size and forecast figures in this report are generated using Mordor Intelligence’s proprietary estimation framework, updated with the latest available data and insights as of January 2026.
Market Trends and Insights
Drivers Impact Analysis of Menstrual Health Apps Market*
| Driver | (~) % Impact on CAGR Forecast | Geographic Relevance | Impact Timeline |
|---|---|---|---|
| Increased awareness of menstrual & reproductive health | +1.8% | Global, with concentrated campaigns in India, Sub-Saharan Africa | Medium term (2-4 years) |
| Rising smartphone & mobile-internet penetration | +2.1% | APAC core, spill-over to MEA and Latin America | Short term (≤ 2 years) |
| Integration with smart-wearables & health-OS ecosystems | +1.5% | North America, Western Europe, urban APAC | Medium term (2-4 years) |
| Freemium & subscription models accelerating ARPU | +1.3% | Global, premium tiers in North America and EU | Short term (≤ 2 years) |
| Menstrual-leave legislation catalysing employer uptake | +0.9% | Spain, Japan, India (Karnataka), South Korea, Taiwan | Long term (≥ 4 years) |
| Decentralised health-data wallets enabling trust-based onboarding | +0.6% | EU (GDPR-compliant jurisdictions), pilot programs in US | Long term (≥ 4 years) |
| Source: Mordor Intelligence | |||
Increased Awareness of Menstrual and Reproductive Health
Public-health campaigns reframing menstruation as a rights issue rather than a hygiene concern are widening the menstrual health apps market in low-income regions. UNFPA’s 2024 initiative integrated cycle literacy into secondary curricula across 12 nations, while Unicharm India’s school program reached 760,000 adolescents by mid-2025, normalizing app use among first-time trackers.[1] Maven Clinic’s employer agreements with Amazon, AT&T, and Microsoft convert awareness into enterprise revenue, sidestepping direct-to-consumer acquisition costs. Japan’s health ministry logged a 23% annual rise in menstrual-leave claims in fiscal 2024, and downloads of Unicharm’s Sofy app crossed 3.37 million by June 2025, illustrating how policy normalization can accelerate digital adoption. Cultural destigmatization is also visible on social media, where Gen Z users share symptom-tracking screenshots, reinforcing peer-to-peer diffusion and deepening the menstrual health apps market footprint. The net result is a broader funnel of novice users who often transition from free tracking to premium analytics within six months.
Rising Smartphone and Mobile-Internet Penetration
GSMA tallied 1.8 billion mobile subscribers and 1.4 billion mobile-internet users across Asia Pacific in 2024, with India’s smartphone penetration hitting 54% and Indonesia’s at 68%, pushing the menstrual health apps market into millions of new hands. Adjust’s 2025 trends report scored Asia Pacific 45, the highest global growth index for health and fitness apps, while India’s average cost-per-install sat at USD 0.03, enabling scale acquisition under tight budgets. Android’s 57.61% market share in 2025 mirrors this dynamic, yet iOS is expanding faster at a 10.41% CAGR because Apple’s multi-device lock-in lifts switching costs. The diverging economics compel dual strategies: Android apps chase volume through ad-supported freemium tiers, whereas iOS apps monetize via annual subscriptions enhanced by wearables. Accelerating 4G rollouts in Africa and Latin America are expected to echo Asia’s pattern, setting up the menstrual health apps market for sustained double-digit regional growth.[2]
Integration with Smart Wearables and Health OS Ecosystems
Maven Clinic’s June 2025 accord with Oura Ring pipes continuous skin-temperature and heart-rate variability into fertility predictions, reducing manual data entry and enhancing cycle-phase accuracy. Apple Watch Series 8 wrist-temperature sensors, live in the market since 2022, remove the need for bedside thermometers and auto-populate Cycle Tracking across iPhone, Watch, and iPad, tightening Apple’s hold on the premium end of the menstrual health apps market. Bellabeat’s May 2025 IVY+ tracker offers continuous monitoring with a seven-day battery, appealing to users who prefer a dedicated device over a smartwatch experience. Hardware pipelines create a data moat; platforms lacking wearable APIs risk relegation to basic calendars, a feature now bundled free in operating systems. Consequently, investors are steering capital toward companies that can secure firmware integrations, elevating the importance of hardware alliances in the menstrual health apps market.
Freemium and Subscription Models Accelerating ARPU
RevenueCat’s 2025 benchmarks report median Day-60 revenue per install at USD 1.98 for health apps and Year-1 lifetime value per payer at USD 86.35, underscoring that disciplined monetization is already baked into top performers. Trial-to-paid conversion averages 39.9% but jumps to 68.3% among the top-decile, proving that carefully crafted onboarding flows lift cash-flow velocity. Flo Health disclosed 5 million paid subscribers and USD 200 million gross bookings in 2024, equating to an ARPU around USD 40, aligned with the median annual subscription price of USD 39.99. Premium tiers now bundle AI symptom analytics, telehealth consultations, and life-stage content, turning the menstrual health apps market into a recurring-revenue engine rather than a one-time download. As more jurisdictions pass app-store tax transparency laws, platform operators are renegotiating payment splits, which could further improve publisher margins over the forecast horizon.
Restraints Impact Analysis of Menstrual Health Apps Market*
| Restraint | (~) % Impact on CAGR Forecast | Geographic Relevance | Impact Timeline |
|---|---|---|---|
| Growing data-privacy & cyber-security concerns | -1.2% | Global, acute in US post-Dobbs, EU under GDPR | Short term (≤ 2 years) |
| Algorithmic accuracy & regulatory scrutiny of health claims | -0.8% | North America (FDA), EU (CE marking), emerging in APAC | Medium term (2-4 years) |
| Post-Roe legal discovery risks for U.S. user data | -0.7% | United States, spillover to multinational platforms | Short term (≤ 2 years) |
| Stricter app-store policies on sensitive health data | -0.5% | Global (Apple App Store, Google Play) | Medium term (2-4 years) |
| Source: Mordor Intelligence | |||
Growing Data-Privacy and Cyber-Security Concerns
The Federal Trade Commission’s 2021 settlement with Flo Health mandates independent privacy audits through 2041, making the case a perpetual reminder of liability in the menstrual health apps market.[3] Mozilla’s 2022 review showed 72% of period apps lacked transparent deletion policies, while 40% skipped encryption in transit. California’s Delete Act, effective 2026, requires one-click erasure across all brokers, while Connecticut’s SB 3 bans geofencing around reproductive-health clinics, raising compliance complexity. Apple’s HealthKit integration rules introduced in 2025 now require third-party security assessments, a cost shock for early-stage developers. Together, these frameworks amplify user skepticism and inflate legal budgets, slightly dampening the menstrual health apps market growth rate.
Algorithmic Accuracy and Regulatory Scrutiny of Health Claims
Natural Cycles secured FDA 510(k) clearance in 2018 with a 0.98 perfect-use Pearl Index, yet updated guidance on AI-enhanced fertility algorithms is still absent, pressing other vendors into regulatory limbo. A 2024 JMIR study covering 326 users recorded a 14% unplanned-pregnancy rate among those relying on apps for contraception, spotlighting real-world efficacy gaps. The European Union AI Act classifies predictive health algorithms as high risk from 2025 onward, demanding conformity assessments and post-market surveillance that inflate compliance expenditure. App-store review teams now request clinical documentation before approving marketing claims, creating a bottleneck for quick iteration. Collectively these factors inject caution into commercial rollouts, slowing feature velocity in the menstrual health apps market.
*Our forecasts treat driver/restraint impacts as directional, not additive. The impact forecasts reflect baseline growth, mix effects, and variable interactions.
Menstrual Health Apps Market Segment Analysis
By Application:
Symptom Analytics Moving From Wellness to ClinicalMenstrual Health Management and Symptom Analytics is projected to expand at a 10.34% CAGR to 2031, outrunning the broader menstrual health apps market thanks to demand for predictive insights that go beyond ovulation timing. Period Cycle Tracking maintained 45.56% of 2025 revenue, but commoditization looms as Apple and Google continue bundling basic calendars for free. The menstrual health apps market size for symptom analytics is forecast to add nearly USD 420 million in new value over the outlook period, while anomaly alerts for endometriosis and polycystic ovary syndrome help users seek care earlier, tightening links with clinicians.
Flo’s November 2025 study of 19 million users confirmed statistically robust correlations between luteal-phase progesterone and symptoms like mood fluctuations, prompting the platform to surface personalized clinical prompts. Natural Cycles rolled out NC° Perimenopause in October 2025, signaling that life-stage verticals can extend customer lifetime value. Fertility & Ovulation Management remains a middle-ground monetizer, but Ava’s FDA-cleared bracelet automates data capture via overnight wrist sensors, raising the competitive bar for manual-entry apps. As symptom analytics secure scientific validation, payer acceptance inside employer and insurer benefits is expected to rise, adding an enterprise layer to the menstrual health apps market.

By Platform:
iOS Premium Posture Versus Android ScaleAndroid held 57.61% share in 2025 due to its dominance in Asia Pacific and Latin America where price-sensitive consumers flood the menstrual health apps market. Yet iOS is growing quicker at a 10.41% CAGR to 2031, buoyed by Apple Watch sensors and cross-device synchronization that increases stickiness. The menstrual health apps market size derived from iOS users already accounts for a disproportionate 60% of paid subscribers at Flo even though iOS commands just 40% of total installs.
RevenueCat notes median Year-1 lifetime value on iOS at USD 92.50 against USD 78.20 on Android, validating higher customer-acquisition spend on Apple’s ecosystem. Google’s Health Connect API aims to mirror HealthKit’s interoperability, but uptake is modest, and many leading platforms route wearable data through Apple’s frameworks. Compliance hurdles further skew the landscape: Apple’s 2025 demand for third-party security audits raises costs that many Android-first developers cannot absorb. Consequently, the menstrual health apps market is bifurcating: Android apps rely on freemium ad revenue, while iOS apps bundle subscription tiers with wearable analytics, producing higher per-user economics.
By Age Group:
Gen Z Growth and Perimenopause OpportunitiesUsers aged 15–24 are expanding at a 10.49% CAGR, stimulated by school-based menstrual education programs such as Unicharm India’s initiative that has normalized digital tracking among first-time users. The 25–34 cohort still makes up 48.47% of the 2025 installed base, aligning with peak fertility years and premium-feature uptake, including basal-temperature charting and ovulation kits.
Mature demographics are rising too. NC° Perimenopause and Flo’s menopause module serve the 45+ group, which Oova data shows comprises 46% of hormone-strip users. Amissa’s Apple Watch integration delivers clinician-readable symptom severity scoring, creating a bridge to hormone-replacement consultations. As a result, the menstrual health apps market is becoming a lifelong companion rather than a fertility-only tool, with platforms vying to retain users across reproductive milestones.
Geography Analysis
North America Menstrual Health Apps Market
North America represented 42.12% of 2025 revenue in the menstrual health apps market, lifted by employer benefits, FDA-cleared contraceptive apps, and high smartphone penetration. RevenueCat’s 2025 dashboard places median Year-1 value per payer at USD 95.40 in the region, reflecting willingness to pay for premium analytics. Post-Dobbs privacy anxieties spurred California, Connecticut, and Washington to pass consent laws for geolocation and browsing-history linkage, raising compliance overhead for smaller providers.
Europe and APAC Menstrual Health Apps Market
Europe mirrors North America’s regulatory intensity under GDPR and the incoming AI Act, yet Spain’s menstrual-leave law and German employer uptake are turning policy into revenue funnels. Asia Pacific is the fastest-growing cluster at 10.59% CAGR, fueled by affordable smartphones and favorable policy, such as Karnataka’s 2025 menstrual-leave mandate. GSMA reports 1.8 billion subscribers in the region, underpinning a giant addressable base.
MEA and South America Menstrual Health Apps Market
Middle East and Africa and South America are nascent but promising. Brazil’s Pix instant-payment network reached 150 million users in 2024, lowering friction for subscription conversions. South African insurers like Discovery Health are piloting cycle-tracking rewards, and Gulf Cooperation Council countries combine near-universal smartphone ownership with cultural guardedness, requiring physician referrals over mainstream marketing.
Regulatory Landscape
Menstrual health apps operate under overlapping privacy, consumer-protection, and medical-device regimes, with requirements tightening as apps move from wellness tracking into algorithm-driven fertility or symptom decision support. In the European Union, GDPR treats menstrual and fertility data as special category data under Article 9, which pushes explicit-consent, minimization, and user-rights workflows into product design. Alongside this, the EU AI Act classifies predictive health algorithms as high risk from 2025 onward, raising expectations for conformity assessment and post-market oversight for clinically positioned features.
In the United States, the Federal Trade Commission has set a widely cited enforcement anchor through its 2021 Flo Health consent order, including independent privacy audits extending through 2041, and it continues to influence disclosure, consent, and data-sharing controls for cycle tracking platforms. In India, the Digital Personal Data Protection Act 2023 is being operationalized via DPDP Rules, 2025 (notified November 14, 2025), with a transition away from the 2011 SPDI Rules by May 13, 2027, increasing the need for purpose limitation, notice, and consent tooling for sensitive reproductive data. Across markets, FDA Software as a Medical Device (SaMD) expectations and app-store rules on sensitive health data also shape claim substantiation, security testing, and update governance for apps that market contraceptive or medical-grade predictions.
Value Chain Analysis
The value chain starts with user acquisition and onboarding through app stores, employer benefit channels, and clinician referrals, then moves into product engineering for cycle logging, symptom analytics, and algorithmic prediction that increasingly draw on wearables and health-OS data pipes (for example, HealthKit-style integrations). Data handling and trust operations are now key value-chain stages, including secure ingestion, encryption, consent management, retention and deletion, and auditability, reflecting the sensitivity of menstrual and reproductive data and the scrutiny applied to health claims in app stores.
Downstream, monetization includes freemium subscriptions, employer-paid licenses, and care-network bundles, which depend on integration with benefits administrators and clinical partners. Compliance and assurance activities are embedded throughout the chain rather than confined to legal review, and vendors invest in security and privacy controls and in formal certifications as differentiators, including Flo Health reporting ISO 27001 and ISO 27701 certifications in 2024. As more apps pursue medical-grade positioning, quality management and regulatory documentation workflows (including automated QMS infrastructure referenced in FDA-readiness initiatives) affect release cadence, vendor selection across cloud and analytics and security testing, and the economics of scaling internationally.
Competitive Landscape
The menstrual health apps market is moderately fragmented. A March 2024 Reproductive BioMedicine Online survey put Clue at 31.6% and Flo at 24.2% of user share, with no player able to impose premium pricing beyond USD 39.99 median annual fees. Venture capital is concentrating behind platforms capable of telehealth, wearable data, and employer channels, as illustrated by Flo’s unicorn round and Maven’s USD 1.7 billion valuation. Apple’s free Cycle Tracking threatens to commoditize basic prediction, compelling rivals to differentiate through AI symptom analytics, regulatory approvals, or hardware tie-ins, such as Natural Cycles’ FDA clearance.
White-space innovation is concentrating on perimenopause, as shown by NC° Perimenopause and Flo’s menopause library, and on employer benefits where Maven’s 2,000+ corporate clients validate B2B appetite. Most startups lack the resources for decentralized health-data wallets, leaving trust gaps in U.S. jurisdictions sensitive to legal discovery. The top five players control slightly below 60% of active users, keeping competitive intensity high and margins moderate.
Menstrual Health Apps Industry Leaders
-
Flo Health
-
Glow Inc
-
Biowink GmbH
-
Ovia Health
-
Eve
- *Disclaimer: Major Players sorted in no particular order

Menstrual Health Apps Market Companies Covered in this Report
- Apple Inc. (Cycle Tracking)
- Ava Science
- Bellabeat Inc.
- Biowink GmbH (Clue)
- Eve
- Fitbit
- Flo Health
- Glow Inc.
- GP Apps – Simple Design
- Kindara
- MagicGirl
- Maven Clinic
- Meiyou (Xiamen Meiyou)
- Natural Cycles Nordic AB
- Ovia Health
- Perigee (Cycles)
- Period Tracker by GP Apps
- Planned Parenthood (Spot On)
- Stardust
- Wildflower Health
- Withings SA
Market Opportunities and Future Outlook
White space is expanding where menstrual tracking connects to validated life-stage programs and reimbursable care pathways rather than stand-alone calendars. The shift shows up in platform moves into perimenopause and maternal health bundles, including Natural Cycles launching NC° Perimenopause (October 2025) and Maven Clinic piloting Medicaid value-based contracts in three US states (January 2026) that layer cycle tracking into broader maternal-health offerings. These pathways support opportunities for vendors that can provide clinically interpretable outputs, documentation, and integrations that fit payer and provider requirements.
A second opportunity is privacy-forward product design and governance as a commercial differentiator in sensitive jurisdictions. The FTCs 2021 Flo Health order (with audits through 2041), GDPR Article 9 constraints on special category data, and India DPDP Rules, 2025 implementation timelines push vendors toward stronger consent, deletion, and security postures that can reduce employer and health-system procurement friction. Finally, partnerships can accelerate distribution and retention, since Flo Healths May 2026 collaboration with Hims and Hers Benefits to offer discounted Flo Premium illustrates how benefits channels can subsidize subscriptions, while wearable and OS integrations reduce manual logging and support higher-value analytics that compete beyond basic cycle calendars bundled in operating systems.
Recent Industry Developments in Menstrual Health Apps Market
- May 2026: Flo Health collaborated with Hims & Hers Benefits to provide subscribers with discounted access to Flo Premium. The arrangement expands payer-backed access to Flo Premium and supports user adoption through corporate channels. It also strengthens user acquisition and retention by linking the app to employer-sponsored benefits.
- May 2026: Flo Health launched doctor-backed perimenopause tools for Flo Premium users. The expansion into the perimenopause lifecycle segment broadens the product scope and increases relevance for users with evolving needs. It improves clinical credibility and differentiates Flo Premium in a crowded market.
- January 2026: Flo Health and Mayo Clinic collaborated on a study regarding perimenopause awareness. The collaboration supports clinical credibility and evidence generation for Flo Health offerings. It helps validate product claims and improves regulatory and clinical legitimacy.
Menstrual Health Apps Market Report Scope and Research Methodology
Market Definition and Coverage
For this study, the market covers mobile and web applications primarily used to track menstrual cycles and related reproductive health signals, where revenue is generated through subscriptions, in-app purchases, and app-linked services.
Scope exclusions: The market excludes physical products and tests sold outside the app (such as standalone kits and devices) unless the paid app service is the priced item being measured.
Segments Covered in This Report
- By Application
- Period Cycle Tracking
- Fertility & Ovulation Management
- Menstrual Health Management & Symptom Analytics
- By Platform
- Android
- iOS
- Others
- By Age Group
- 15 – 24 Years
- 25 – 34 Years
- 35 – 44 Years
- 45 + Years (Peri- & Post-menopause)
- Geography
- North America
- United States
- Canada
- Mexico
- Europe
- Germany
- United Kingdom
- France
- Italy
- Spain
- Rest of Europe
- Asia-Pacific
- China
- Japan
- India
- Australia
- South Korea
- Rest of Asia-Pacific
- Middle East and Africa
- GCC
- South Africa
- Rest of Middle East and Africa
- South America
- Brazil
- Argentina
- Rest of South America
- North America
Data Sources, Market Sizing, and Validation
Desk Research
Desk research was used to build the base structure of the model and set practical guardrails for adoption and pricing. Public sources, such as the World Health Organization, the World Bank, International Telecommunication Union indicators on connectivity, and OECD health statistics, were used to map where app usage can scale and where it stays limited.
We also reviewed app store policy and category notes, clinical literature indexed in PubMed on cycle tracking and women's health self-monitoring, and selected government health portals that discuss reproductive health awareness. Company filings, investor presentations, and credible press interviews were reviewed to interpret monetization patterns (free vs subscription) and typical feature bundles. In addition, paid subscriptions we hold for company financials, news coverage, and patent databases were used to sanity check business models and innovation activity. These examples are not exhaustive, and many other sources were used during data collection, validation, and research clarification.
Primary Interviews and Surveys
Primary work centered on interviews and short surveys with app product owners, digital health managers, clinicians who advise patients on tracking, and channel stakeholders that understand subscription conversion. Because this is a global market, inputs were checked across major regions so differences in smartphone use, privacy expectations, and willingness to pay could be reflected, and then key assumptions were triangulated where desk research was thin.
Distribution of primary research fieldwork respondents
| Company type | Respondent position | Region |
|---|---|---|
| Top tier: 26% | CXOs: 19% | APAC: 44% |
| Mid tier: 55% | Functional/Unit leaders: 28% | EMEA: 29% |
| Smaller Players: 19% | Managers: 53% | Americas: 27% |
Market-Sizing & Forecasting
Sizing starts with a top-down build where the eligible user pool is reconstructed from smartphone-connected female population indicators, followed by an adoption and monetization ladder that converts users into paid revenue. Once the demand pool is formed, average revenue per paying user is applied using observed subscription price bands, free-to-paid conversion assumptions, and renewals, so totals stay tied to what users can realistically pay.
To keep the model grounded, we corroborated outputs with selective bottom-up checks, such as rolling up sampled app revenues where public disclosures exist, and then using channel checks on typical pricing, discounting, and the share of subscriptions vs one-time in-app purchases. Inputs that materially move the model include smartphone penetration and mobile broadband usage, share of users in reproductive age, typical cycle tracking frequency and retention, subscription penetration within the installed base, and regional purchasing power effects that shift price points.
For forecasts, scenario analysis was used, since growth can swing based on privacy policy changes, app store rules, and healthcare integration pace. Expert inputs were used to set conservative, base-case, and aggressive paths for conversion and retention, and then the final forecast was selected where multiple signals lined up. Where a bottom-up view was incomplete for smaller publishers, gaps were handled by applying region-specific adoption and price ranges rather than forcing a company roll-up that cannot be validated.
Data Validation & Update Cycle
Outputs are checked in several passes so big swings are caught early and explained before sign-off. We compare implied paid users, ARPPU levels, and regional splits against independent demand signals such as connectivity growth, health app download momentum, and the direction of subscription pricing observed in the market.
Variance checks are run across regions and years, and outliers trigger a re-check of the input chain, followed by selective re-contact with interviewees if assumptions look stretched. Reports are refreshed annually, and interim updates are made when major events occur, such as meaningful policy shifts on health data, material changes in subscription models, or step-changes in platform distribution. Before delivery, the latest public signals are reviewed again so the final view reflects current conditions.
Mordor Intelligence's Menstrual Health Apps Market Size Measured Against Other Published Estimates
Published market sizes for menstrual health apps can look far apart because each publisher draws the line differently around what revenue counts, and then they apply different assumptions on paid conversion and pricing progression over time. Timing also matters because app monetization can change quickly when subscription plans, privacy settings, or store policies shift.
The main gap usually comes from whether adjacent femtech categories and offline items are folded into the total, and from how aggressively paid adoption is projected versus keeping it tied to observable subscription behavior. Some estimates also lean heavily on long-horizon growth rates without re-checking regional willingness to pay and currency translation timing, which can inflate or compress the USD total depending on the year selected.
Benchmark comparison
| Source | Market Size | Gaps in Research Methodology |
|---|---|---|
| Mordor Intelligence | USD 1.60 B (2026) | |
| Trade Journal A | USD 2.49 B (2026) | Uses a broader femtech-style scope that can bundle menstrual apps with nearby women's health app revenues and then applies faster paid conversion assumptions without consistent region-level willingness-to-pay checks. |
| Industry Research Desk B | USD 1.89 B (2026) | Relies on high-level growth math with limited transparency on renewal and churn behavior, which can understate or overstate recurring subscription revenue depending on how retention is treated. |
The table shows that scope and monetization treatment explain most of the spread. The biggest driver is whether non-app revenue and broader women's health app categories are included, where Mordor Intelligence counts value only when it is generated inside the menstrual health app business model (subscriptions and in-app monetization) and keeps ARPPU and conversion anchored to primary checks by region. Because the steps are traceable from user pool to paid users to revenue, the final number stays repeatable even when market conditions shift year to year.
Key Questions Answered in the Report
What is the current revenue size of the menstrual health apps market?
The menstrual health apps market size stood at USD 1.60 billion in 2026.
How fast is the market expected to grow?
The sector is forecast to post a 9.51% CAGR and reach USD 2.52 billion by 2031.
Which platform contributes most users?
Android devices held 57.61% of 2025 market share, driven by high penetration in Asia Pacific and Latin America.
Which application segment is expanding fastest?
Menstrual Health Management and Symptom Analytics is pacing ahead with a 10.34% CAGR through 2031.
Which region will see the highest growth?
Asia Pacific is projected to expand at a 10.59% CAGR through 2031 on the back of affordable smartphones and supportive legislation.
What drives employer adoption of cycle-tracking apps?
Policies like Karnataka’s 12-day menstrual-leave mandate and corporate benefit packages are pushing companies to fund app subscriptions that verify leave and support retention.